Houston Updates
-
Archive
- June 2025
- March 2025
- December 10, 2024
- September 14, 2024
- May 21, 2024
- March 19, 2024
- December 9, 2023
- June 16, 2023
- April 6, 2023
- March 17, 2023
- Dec. 19, 2022
- Sept. 14, 2022
- July 4, 2022
- March 27, 2022
- March 9, 2022
- September 2021
- April 2021
- March 2021
- September 2020
- August 2020
- June 2020
- April 2020
- March 2020
- January 2020
- December 2018
- June 2018
- March 2018
- February 2018
- January 2018
- September 2017
- September 2017 Post-Hurricane
- June 2017
- March 2017
- January 2017
- September 2016
- March 2016
- December 2015
- September 2015
- June 2015
- March 2015
- December 2014
- June 2014
- March 2014
- November 2013
- September 2013
Houston's Job Growth Machine Breaks Down: A Quick Update
September 4, 2015
It is hard, especially now with oil prices depressed, to predict where Houston’s economy is headed. It also is hard to know where it stands today, even if we are familiar with the economic data and can interpret it properly. Houston has arrived at a critical juncture in its business cycle, and it is important to understand how the local economy is faring right now, a small first step if we ever hope to understand its future. Recent job growth numbers have led to some confusion about Houston’s recent economic performance, and the purpose of this brief Economic Update is to put Houston job reports under the microscope. The figures show the emergence in 2015 of significant economic weakness, and they may well portend more slow growth ahead.
Nonfarm payroll employment data provided by the Texas Workforce Commission and the Bureau of Labor Statistics are the most comprehensive and timely description of Houston’s economy. It is an excellent gauge of state and metropolitan performance, although subject to substantial revision. Revisions are made regularly to the prior month, plus an annual “re-benchmark” revision takes place in early March that can change the figures for the past 24 months or longer. The preliminary data issued each month are based on a sample of Houston area employers, and revisions are inevitably most significant at times of substantial change in the economy, such as those we are experiencing now. The numbers we look at below are subject to these revisions, but are the most current available.
The employment reports from the press or various commentators sometimes seem to vary in the number of jobs reported, and often differ in the interpretation of the data. We will see why in the write-up below. The simple point to be made here is that since December 2014 the Houston job growth machinery mostly has been shut down, with negative growth through May. Then as oil approached $60 per barrel over the summer, Houston’s energy sector seemed to stabilize, and modest local job growth returned. Through July of this year, Houston has added 5 – 12,000 new jobs, depending on the source and interpretation of the figures. As oil’s price declined again in August, it put even this modest growth at risk. Widely quoted figures of 60,000 or more jobs created in Houston are simply a poor interpretation of current events, over-estimating local economic strength, as the number mostly reflecting job growth that took place in 2014.
How Are We Doing?
Let’s start with the 12-month change in the number of jobs, i.e., the number of new payroll jobs created in the 12 months leading up to July 2015, where July is the latest number available. The official number from the Texas Workforce Commission is 64,600 new jobs, an amazing statistic given that Houston has sustained major damage to its oil and gas sector. It is a widely cited number, much loved by those who insist on booming the local economy, and cited as proof of Houston’s resilience and new-found diversity. Unfortunately, it is a poor guide to current events.
Table 1 shows Texas Workforce Commission data on the number of Houston jobs at three dates – July 2014, December 2014, and July 2015. The 12-month change would be July to July, and the jobs created in 2015 are the difference between July 2015 and December 2014. The basic data as reported by TWC are in the first line of the table, and the second line is the same data adjusted for seasonal variation. This adjustment can be critical if we want to compare the December holiday season to the summer doldrums of July. The third line is from the Research Department at the Federal Reserve Bank of Dallas. The Dallas Fed begins with the TWC data, also seasonally adjusts it, but adds some preliminary revisions. The major re-benchmark revision that is an annual event for TWC is performed quarterly by the Dallas Fed as the data becomes available.
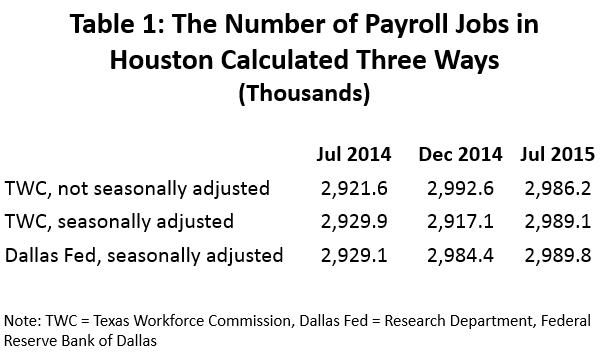
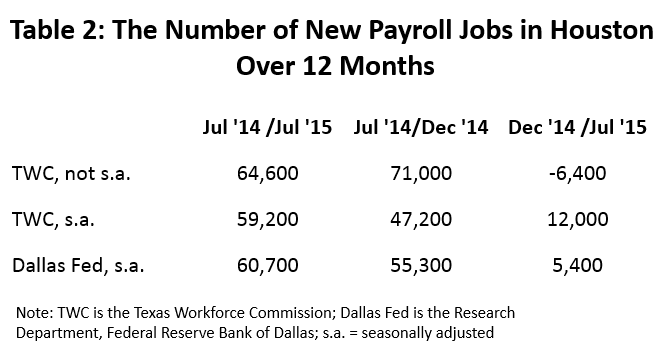
Table 2 computes the change in the number of jobs measured from July2014/July2015, July 2014/December 2014, and December 2014/July 2015. The first figure in line one (64,600) is the 12-month change; the second figure is the number of jobs created in the last five months of 2014 (71,000), and the third figure is the number of new jobs in Houston in the first seven months of 2015 (-6,400). These are not seasonally adjusted.
So, in fact, the 64,600 new jobs is way too good to believe if we are describing current events. By this measure, all of the 12-month job growth came in late 2014, and that offers little help in understanding current events. We already knew that 2014 was a good year. We know exactly what happened to make the data behave this way. Oil prices began to decline slowly at mid-year in 2014, and the real reversal in the oil fields only emerged with OPEC’s Thanksgiving Day announcement that it would not serve as swing producer in oil markets, no longer using cuts in its own production to rebalance oil supply. Oil’s price immediately tumbled under $70 per barrel, and was under $50 by mid-January.
Through 2014, a red hot Houston job market had no time to absorb the emerging bad news about oil, and the local economy continued to grow strongly. Measured December to December, there were 114,000 new jobs in 2014, and this came on the heels of 291,000 added over the previous three years. You want to start counting jobs after December, of course, because that is when the calendar turns for 2015, but is also appropriate to start in December because it marks the point at which crisis conditions emerged in the oil fields. Looked at this way, it is amazing how quickly and almost completely the drop in the price of oil shut down Houston’s job growth.
The next two lines of Table 1 are adjusted for seasonal variation. We need this adjustment to compare the December holiday season, with its strong retail hiring, to the seasonally weak summer data, with teachers on holiday and out of the classroom. This comparison turns Houston’s job growth positive for the first seven months of 2015, and the TWC says we added 12,000 new jobs and the Dallas Fed only 5,400. For the first five months of 2015, the year-to-date job growth numbers were negative. They only turned positive in the last two months, as the price of oil briefly pushed back near $60 per barrel. As the price of oil again has since fallen to near $40 per barrel, and energy layoffs have resumed, even these modest employment gains are placed at risk.
As we move through the remainder of 2015, the weakness of the local job market, as measured by a 12-month change, would slowly emerge until we ultimately reached the December-to-December change, with all of 2014 finally purged. What would this December/December comparison look like if local job growth continued to perform exactly as it has for the first seven months? Table 3 uses the Dallas Fed data to extrapolate the figures into a full year 2015 job growth, and shows the losses and gains by industry. TWC provides no comparable industry-by-industry seasonal adjustments.
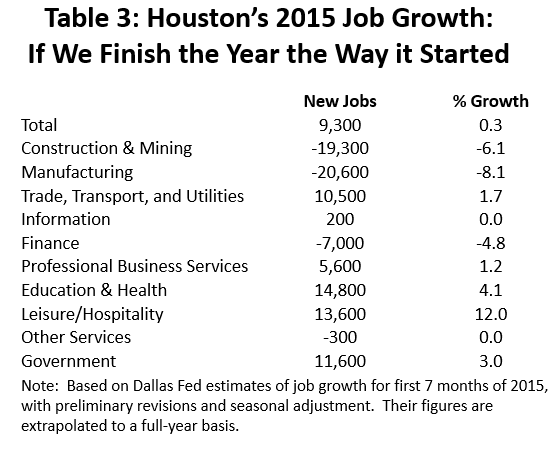
Extrapolating out, the full-year 2015 job growth would be 9,300 jobs or 0.3 percent. Construction and mining account for a loss of 19,300 jobs, and all of these are likely in oil production and oil services. The Dallas Fed does not separate the two industries, but construction continues to hold up well, helped by Houston’s recent history of strong growth, and by continued efforts to catch up with continued local housing and infrastructure needs. Plus, the east-side boom in petrochemical construction continues to add thousands of jobs, with more new plant announcements. Manufacturing jobs decline by 20,600, most of them concentrated in machinery and fabricated metal. Financial activities fall by 7,000 jobs.
The biggest gains come in private education and healthcare (14,800), leisure and hospitality (13,600), government (11,600), and trade, transportation and utilities (10,500). These all are sectors susceptible to a slowdown in the near future as the Houston economy catches up with past job growth, and the current reality of no-growth/slow-growth fully sets in. Area construction contractors report, for example, that they are still very busy, but that they are quickly working through backlogs that are no longer growing.
Where Are We Headed?
To borrow a popular maxim, only fools and liars forecast oil prices. But, we can look at current fundamentals in oil markets, and it’s easy to find a bleak outlook that could persist through 2016 and beyond. Table 4 is a list of factors currently weighing on world oil markets, and most of them have been with us for a while. The Saudi withdrawal as swing producer, turmoil in the Middle East, and stubbornly high U.S. production are continuing issues left from last year. However, the initial blow to oil price late this summer, pushing it back to the $40 range, was the pending agreement with Iran to allow the country to return to world oil markets. Once economic sanctions are lifted, Iran will immediately bring some mix of crude and oil products out of floating storage, they will increase oil exports, and future exports will rise as they update their aging petroleum infrastructure.
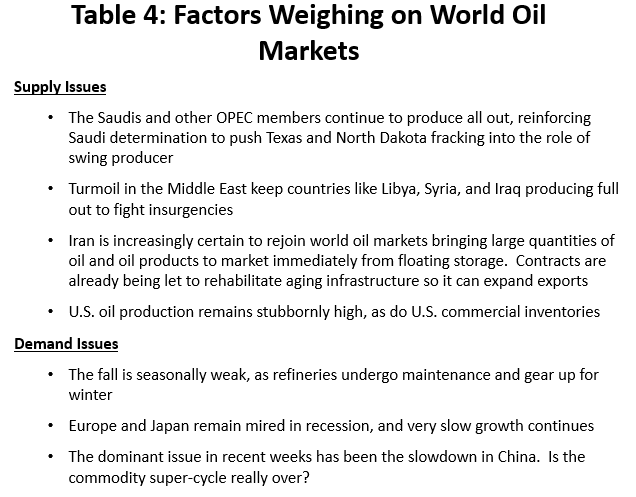
On the demand side, the newest issue to surface is the slowing growth of China and other emerging markets. These countries have driven high raw material prices – oil, metals, fertilizer, and foodstuff – for the past decade. It has been called the commodity super-cycle, a combination of strong demand driven by China and the developing world, historically high commodity prices, and rapid expansion of mining and agriculture industries. The financial market has been, for some time, digesting the possibility that this cycle is at an end with forecasts of Chinese growth drifting down to 6 percent. Current turmoil in financial markets reflects even greater concerns about Chinese growth, concerns that have pushed investors to accept the end of the commodity super cycle as a growing certainty. The oil industry is among many commodity producers now being severely punished.
This does not bode well for many of Houston’s oil producers. Continued low oil prices seem likely to bring another round of cuts in drilling; producers are rapidly running out of past hedges that bring them face to face with the current spot price; the autumn review of loan covenants is here, and without relief from higher oil prices, banks and other lenders seems sure to tighten credit. Highly leveraged producers will have to sell bonds (unlikely), sell assets (for pennies on the dollar), or seek merger or bankruptcy.
Table 5 summarizes the job growth estimates presented at the May 2015 Economic Symposium and published on this website as an Economic Update on June 23. Details of the forecast can be found in that write-up. Scenario 1 assumed a quick snap-back in drilling, beginning in early 2016, and a return to solid growth for the fracking industry once oil prices revived. Scenario 2 assumed a later return to high levels of drilling, with drilling only picking up in mid-2016, and slower long-term growth as the fracking industry grows but falls short of boom times in 2017 and beyond. The delay brings two years of slow growth to Houston in 2016 and 2017.
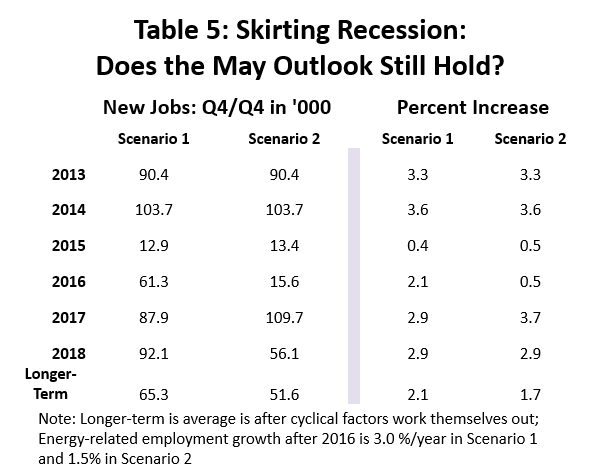
Our May projection of 12-13,000 new jobs in 2015 are right on track, compared for example, to our extrapolation of the Dallas Fed data to 9,300 jobs. But for 2016, Scenario 1 may now be looking too optimistic, with its assumption of a strong drilling revival beginning as early as this January. Several recent forecasts of the rig count have assumed further declines in 2016, and pushed any growth in the rig count back as far as 2017. At a minimum, Scenario 2 probably is now much more likely than just a few months ago, which would portend another slow year for Houston in 2016.
Conclusion
So far, 2015 has been less than a stellar year for Houston’s economy, now on track to deliver fewer than 10,000 jobs by year-end. Our projection for employment growth this year, the period of initial downturn in oil markets, remains right on track. The combination of solid U.S. expansion and a petrochemical construction boom have been just enough to keep Houston out of recession. Who would have thought downstream oil refining and petrochemicals would be the most important part of the “diversification” that is currently hard at work to offset the shale bust?
Houston’s outlook for 2016 and beyond is increasingly at risk, however. By the time of our November 12 symposium, perhaps a new consensus on China or oil markets will have emerged, and we can run new numbers on local job growth. Even without consensus, we can look at several possible scenarios, to get a feel for how Houston’s economy might fare under different conditions. How good or bad might it be? What happens in oil? Manufacturing? How does this trickle down to professional and business services? Single-family and apartments? Office, industrial, and retail real estate? Meanwhile, keep your seat belt fastened.
Written by:
Robert W. Gilmer, Ph.D.
Institute for Regional Forecasting
September 4, 2015