Houston Updates
-
Archive
- June 2025
- March 2025
- December 10, 2024
- September 14, 2024
- May 21, 2024
- March 19, 2024
- December 9, 2023
- June 16, 2023
- April 6, 2023
- March 17, 2023
- Dec. 19, 2022
- Sept. 14, 2022
- July 4, 2022
- March 27, 2022
- March 9, 2022
- September 2021
- April 2021
- March 2021
- September 2020
- August 2020
- June 2020
- April 2020
- March 2020
- January 2020
- December 2018
- June 2018
- March 2018
- February 2018
- January 2018
- September 2017
- September 2017 Post-Hurricane
- June 2017
- March 2017
- January 2017
- September 2016
- March 2016
- December 2015
- September 2015
- June 2015
- March 2015
- December 2014
- June 2014
- March 2014
- November 2013
- September 2013
Houston’s Payroll Employment Revisions Confirm No-Growth Scenario: But the Local Economy Shows Resilience in the Face of Oil Market Damage
March 16, 2017
Recent revisions to Houston’s total payroll employment figures are not large, and they do not change the fundamental narrative of no-growth/slow-growth in Houston since 2014. The revisions to total employment wiped out all job gains in 2015, as well as for the first eight months of 2016. The revised figures are mostly small changes to previously estimated small employment numbers, but they remain compelling because of concern about low oil prices and the on-going damage to oil-related activities. Revised detail on the local oil industry confirms deep and widespread damage, with 77,200 oil-related jobs lost since December 2014. The Houston economy’s resilience to these steep losses — with no downturn in total employment — is quite remarkable.
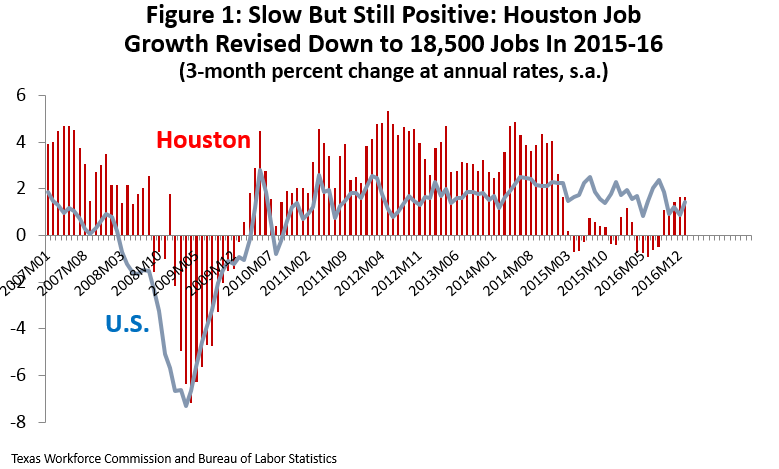
Figure 1 shows the revised total employment data in 2015-16, and its history since 2007. The figures are the monthly percentage growth rates of payroll employment stated at annualized rates. The strong job growth of the fracking boom evaporated almost immediately in 2015 as oil prices fell, and growth stayed near zero until the last few months. The recent switch to positive job growth is welcome, but open to interpretation. The best outcome would be that these jobs resulted from higher oil prices that rose to near $55 for several months. The cautionary view is that these last few estimates are still preliminary and unrevised sample data, and we have repeatedly seen similar estimates revised away since 2014.
Why Revisions?
On March 10, the Texas Workforce Commission (TWC) released its annual benchmark revisions to Houston’s payroll employment estimates. TWC’s monthly report on local payroll jobs is the timeliest and most important report that we receive on Houston’s economic performance, providing an update on total jobs, as well as substantial employment detail by industry. Payroll employees are those eligible for unemployment insurance, and they account for about three-fourths of Houston’s total jobs.1
Initial monthly estimates are drawn from a sample of local employers, and each year in March the TWC stops the sampling process and revises the preliminary estimates. Over the previous 12 months, administrative records will have accumulated on the number of local workers that can draw unemployment insurance, and these reports provide the new statistical ”benchmark” for revisions.2 Revisions over the prior 12 months will mainly be to the sample estimates, but changes can reach back another year or more based on any improved count in the administrative records.
The annual revisions also include a general clean-up of the data, moving some employers from one industry to another if their line of business has changed or was previously misclassified, or moving businesses from one metropolitan area to another. Both kinds of revisions are present in the current release, moving thousands of workers from wholesale trade to mining, for example. Also, a large number of state employees, previously counted elsewhere, were moved into the Houston metro area, along with a smaller number of workers in other industries.
Latest Revisions to Total Employment
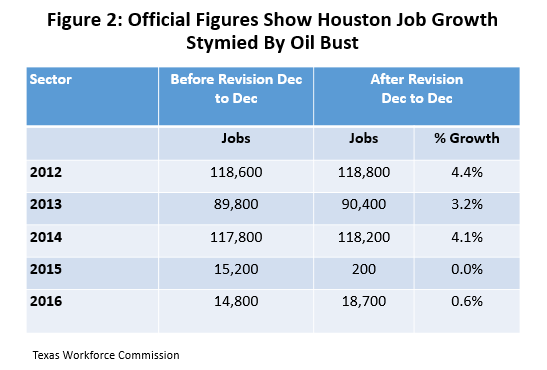
The recent annual revisions to Houston’s payroll employment are described in Figure 2, comparing December to December changes each year, both before and after revision. The big jobs gains from 2012 to 2014 (averaging nearly 110,000 jobs per year) marked the last years of Houston’s fracking boom. After the oil bust began in late 2014, preliminary estimates indicated 30,000 new jobs during 2015 and 2016 combined. Post-revision, nearly all the 2015 job growth disappears, leaving 18,900 new jobs over two years. As we saw in Figure 1, these remaining jobs are mostly a product of unrevised sample estimates during the last few months.
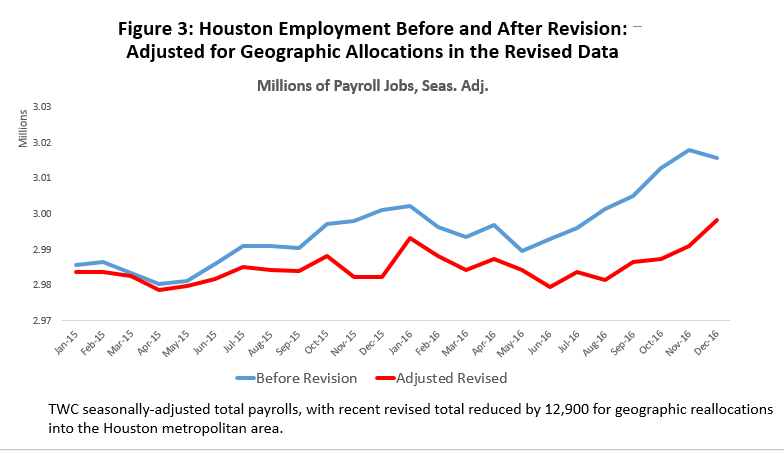
Figure 3 compares Houston’s estimated total employment levels since early 2015, based on both revised and unrevised data. The top curve is before revision, and the bottom curve is revised data that I have uniformly shifted down by 12,900 jobs. With this adjustment the bottom curve is lower than the unrevised data in every month, and in recent months lower by as much as 27,000.
The shift downward by 12,900 jobs is to make sure we compare pre- and post-revision Houston on roughly the same employment base. The latest revisions apparently added new establishments/employers to the Houston area that were previously counted elsewhere. These revisions extend monthly back to 1990, adding 7,800 jobs in 1990, for example, then 10,500 by 2000, and 12,900 in 2014.
The bulk of these revisions (8,500 by 2014) are in state employment, so we might guess that one or more state agencies previously had Houston-based workers that were counted as if they were in Austin, but that are now divided up across the state for purposes of statistical reporting. Houston and other metro areas gain jobs, while Austin loses. There was no change in Houston’s economy, of course, the workers were here all along. It is just a different accounting system operating under new rules. To keep the comparison of employment levels honest as possible, we subtracted out the 2014 average number of jobs contributed by the “new employers.” This shift does not affect the results of Figure 2.3
The most striking thing about the revised number of jobs in Figure 3 is that it is very flat. Except for the last few months, it changes very little. No job growth is the bad news here, of course, but the good news is no decline in the face of large employment losses in the oil industry. Given the severity of the oil bust, avoiding an economic setback is no mean feat.
Revisions in Key Industries
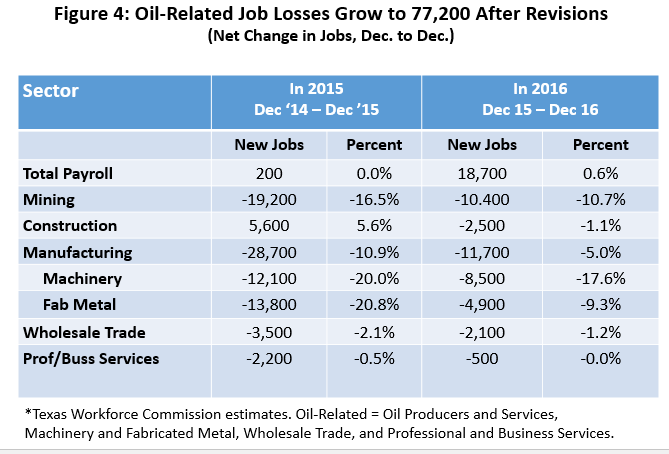
Houston’s recent economic problems result almost exclusively from the collapse of oil prices and record-low levels of drilling activity. This has been offset by U.S. economic growth that helps Houston’s many local employers that sell into national markets, and by low natural gas prices that have triggered a major petrochemical construction boom on the Ship Channel. Figure 4 outlines the latest estimates of job gains or losses since December 2014 among the key industries that are caught up these trends.4
Over the combined 2015 and 2016 period, construction shows an upward revision in the number of new workers to 3,100, where estimates previously showed only 700 new jobs. However, this modest revision disguises some major year-to-year changes. What was previously an out-sized gain of 12,100 jobs in 2015 is now only 5,600, and a large employment loss of 11,400 last year is now only 2,100. The good news here is the relatively small construction losses now recorded in 2016, perhaps indicating that Ship Channel petrochemical construction was still holding off any on-going declines in commercial construction.
Gaging revisions in mining and wholesale trade is complicated by industrial reclassifications that affected these sectors. Since these transfers were mostly directly from wholesale trade to mining, we can add them together and look at the change in the combined industries. Losses in these sectors during 2015-2016 were revised up by nearly a quarter, from 28,600 jobs to 35,202.
Combined machinery and fabricated metals similarly were found to have incurred a 2015-16 loss that was 28.4 percent greater than previously estimated, revised up from 30,600 to 39,300. Total employment in machinery and fabricated metals peaked at 126,800 jobs in December 2014, so we have lost just over 30 percent of these key manufacturing jobs.
In summary, we now see much bigger post-revision losses in the core oil-related sectors of mining, machinery and fabricated metals. They are offset, however, by much smaller losses in professional services. Professional and business services improved from a combined 2015-16 loss of 14,700 jobs to only 2,700 after revision. We know there have been large oil-related layoffs in many engineering companies, so we should credit U.S. growth with offsetting them.
If we count oil-related losses as those occurring in mining (oil producers and oil services), machinery, fabricated metal, wholesale trade, and professional and business services, then we can use Figure 4 to total up a two-year loss of at least 77,200 oil-related jobs. The comparable unrevised figure was 73,900 jobs. On a total payroll base of 3 million jobs, oil-related losses now stand at 2.6 percent of total employment.
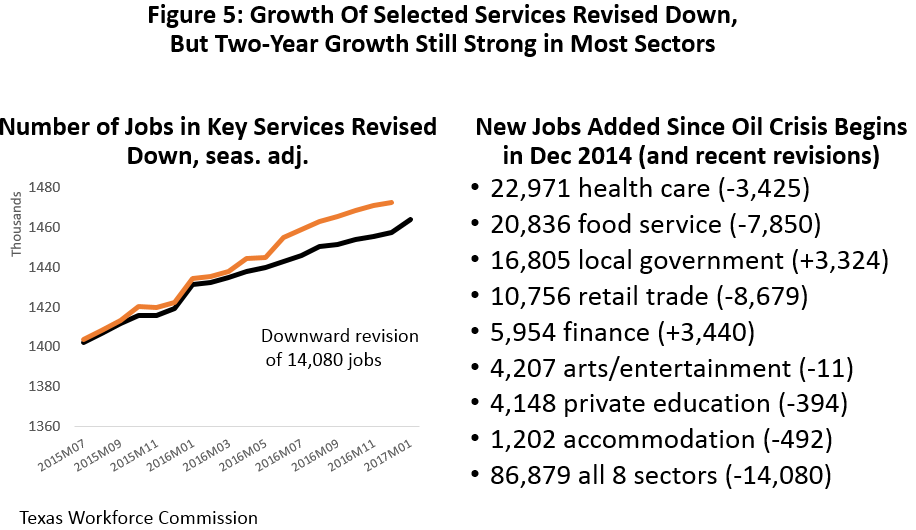
Selected Services
What offset these large energy losses? Figure 5 lists eight selected service sectors with almost 1.5 million workers that — according to the preliminary estimates — added over 100,000 jobs to the Houston economy since December 2014. The source of these job gains has been discussed at length elsewhere: strong national markets, petrochemical construction, past momentum from the fracking boom, and continued (if now waning) population growth.5
Figure 5 shows our current estimate of the number of new jobs by sector, and the recent revisions are in parentheses. The number of jobs created by these eight sectors since December 2014 was revised down from 100,967 in December 2017 to 86,880, a decline of 15.6 percent. The biggest losses to benchmark revisions were in retail trade (-8,679), food service (-7,850), and healthcare (-3,425). The largest upward revisions were finance (3,440) and local government (3,324). State employment was excluded from these comparisons because of the apparent allocation of a number of new state jobs into Houston from other places, as discussed earlier.
Conclusions
These revisions confirm that Houston’s payroll employment has not grown significantly since 2014, but it also shows no signs of a downturn. As we review the results of the Fracking Bust, we need to be careful to separate the depth and breadth of the damage done to the oil industry from its effect on the broader Houston economy. There is a good argument that the current downturn in drilling activity is in the same league as the 1980’s: the percentage decline in the rig count is comparable; this decline in working rigs reached all-time lows; this decline occurred much faster; and the current fall in upstream capital spending (adjusted for inflation) was 2.5 times bigger than the 1980s. This has been a brutal reversal for the oil industry.
Houston meanwhile has lost at least 77,200 jobs in oil-related industries, worse than initially estimated, but with no loss apparent yet in total employment. While the local economy is barely treading water, it has not slipped under the waves.6 This stands in sharp contrast to the 220,000 jobs lost in the 1980s, when Houston was half the size it is today. Why the better economic performance this time around? This will be discussed at length in out upcoming Spring Symposium, but we mostly credit continued growth in the U.S. economy and the “diversification” offered by the downstream petrochemical boom.
The proper comparison to today’s events — drawing from Houston’s business cycle history — is not the 1980s, but its performance during the Asian Financial Crisis in the late 1990s. Global recession pulled the price of oil down to $10 per barrel and the U.S. rig count fell 46 percent, but a strongly-growing U.S. economy carried Houston right through the crisis. Local job growth slowed in 1997-98, but never turned negative. No, the oil cycle is certainly not defeated, and oil continues to play a critical role in the local economy. But we can at least put to bed the myth that every reversal in oil markets brings economic crisis to Houston.
Written by:
Robert W. Gilmer, Ph.D.
Institute for Regional Forecasting
March 16, 2017
1 According to the Bureau of Economic Analysis, payroll employment made up 76.4 percent of Houston’s employment in 2015. The rest are primarily self-employed proprietors.
2 These data on payroll employment data are reported in detail by place and industry by the Bureau of Labor Statistics in its Quarterly Census of Wages and Employment. The data come with a lag of about six months, and can be subject to revisions for up to 30 months.
3 These 12,900 new jobs allocated to Houston from elsewhere are small change in the great scheme of things, at only 0.4 percent of total employment. They become important only because of the current zero-growth environment. They are just big enough to distort our comparisons of small changes in total employment.
4 To see what Figure 4 looks like with the unrevised numbers, see Figure 13 in R.W. Gilmer, “Houston’s Outlook for 2017: Is the Worst Behind Us? Institute for Regional Analysis, January 2, 2017. http://www.bauer.uh.edu/centers/irf/houston-updates-jan17.php
5 See Figure 14 and the discussion in the article cited in the previous footnote.
6 Another data set shows that Houston came close to recession in 2016, or perhaps slipped into a mild recession. The Federal Reserve Bank of Dallas computes a business cycle index for Houston that contains four variables: payroll employment, the unemployment rate, real wages and salaries, and real retail sales. It is specifically constructed to follow the local business cycle, and has fallen about 2.4 percent over the last 6 quarters. I don’t think this affects the conclusion drawn here about the resilience of the overall economy in the face of over 70,000 jobs lost in local oil-related activities.