Houston Updates
-
Archive
- June 2025
- March 2025
- December 10, 2024
- September 14, 2024
- May 21, 2024
- March 19, 2024
- December 9, 2023
- June 16, 2023
- April 6, 2023
- March 17, 2023
- Dec. 19, 2022
- Sept. 14, 2022
- July 4, 2022
- March 27, 2022
- March 9, 2022
- September 2021
- April 2021
- March 2021
- September 2020
- August 2020
- June 2020
- April 2020
- March 2020
- January 2020
- December 2018
- June 2018
- March 2018
- February 2018
- January 2018
- September 2017
- September 2017 Post-Hurricane
- June 2017
- March 2017
- January 2017
- September 2016
- March 2016
- December 2015
- September 2015
- June 2015
- March 2015
- December 2014
- June 2014
- March 2014
- November 2013
- September 2013
Houston Moves On from the Virus: But an Inflation Outbreak and Fed Policy Bring No Growth Ahead
December 19, 2022
Houston’s economy is again sliding into a major slowdown and possible recession in 2023. This somehow seems unfair after nearly a decade of steady oil reversals in Houston followed by the pandemic, but the outlook for both the U.S. and Houston in 2023 has made a dramatic turn.
Policy errors by both the fiscal and monetary authorities led to a major outbreak of inflation just as we came out of the pandemic. Stated most simply, a huge pandemic stimulus left far too much money chasing too few goods.
The Federal Reserve is now moving rapidly to raise interest rates and to dramatically slow the economy. Economic storm clouds are already apparent in weak housing markets, slowing retail activity, and lower commodity prices. There will be no near-term policy help from any quarter as inflation takes a strong priority over recession. Expect near-zero job growth in Houston and the U.S. in 2023 followed by sub-trend growth through 2024, with the risk of possible recession heavily weighted to the downside.
Houston and the End of the Pandemic Economy
Houston’s COVID recovery brings very good news, although still accompanied by significant on- going -- and some new -- economic concerns. Certainly, the good news is that in April of this year the Houston metro area added back all of the jobs lost to COVID since the April 2020 lockdowns, and U.S. payrolls reached the same milestone in July. The recovery in both cases gained momentum in spring 2021 as vaccines became widely available, as many COVID restrictions were dropped, and with extra spending induced by the second and third round of fiscal stimulus.
COVID has become much less pressing, but some local economic hangover lingers. Although Texas has led the nation in job gains, until very recently Houston’s recovery was a serious laggard among the state’s major metro areas, especially compared to Austin or Dallas where most of the state’s widely noted population gains and corporate relocations to Texas have occurred.
Houston’s payroll employment losses and recoveries are shown in Figure 1, with a lockdown decline of 360,100 jobs or 11.3 percent. This compares to 22.0 million U.S. jobs lost or 14.2 percent. Houston’s decline was smaller thanks to a less restrictive lockdown policy in Texas, and the stronger initial U.S. recovery was a strong bounce back as heavier national COVID sanctions were lifted. By this April, re-benchmarked and revised employment data showed that Houston had added back all of the lockdown losses, and in November recoveries stood at 122.7%, i.e., all of the jobs were back in September plus 22.7% more. The U.S. in July finally added back 100.0% of these losses, and now is at 104.7%.

The differing stringency of lockdown periods complicates comparisons of the U.S. and Houston recovery, as the U.S. brought jobs back at a faster rate but from a lower level. Comparison to other Texas metros is much clearer in the sense that we had the same public health and lockdown rules imposed across the state. Figure 2 shows COVID lockdown period losses and recoveries through this September for major Texas metro areas. Austin has recovered 187.5% of losses or all the losses plus 87.5% more. Dallas stands at 165.0% of jobs returned, Fort Worth at 133.5%, and San Antonio at 122.7%. The statewide recovery is at 137.0%.
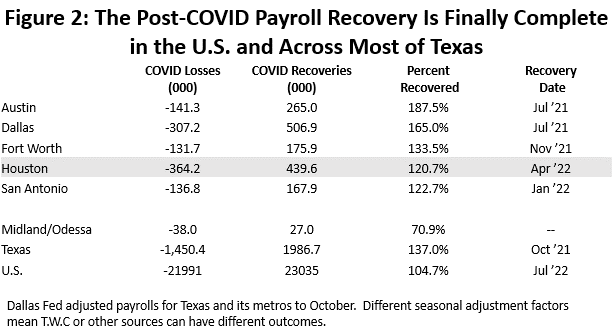
Why has Houston lagged? Note that Midland/Odessa have added back only 27,000 jobs since the lockdown or 70.9% percent. This is the heart of the state’s oil production region and these cities -- like Houston – are highly dependent on oil-related jobs. We must strongly suspect that Houston’s relatively slow recovery was centered in its large oil sector.
How does the vaccine play into the broader economy? The immediate, huge job losses to lockdowns was led by jobs in sectors sensitive to close contact and social distancing, or heavily affected by COVID public health regulations. Nine local sectors are listed in Figure 3 that are sensitive to such contact (bars and restaurants, health care, retail sales, accommodation, etc.), and which together made up 41.9 percent of all Houston employment in 2019. They are important because they also collectively accounted for 68.5% of the lockdown-period job losses.
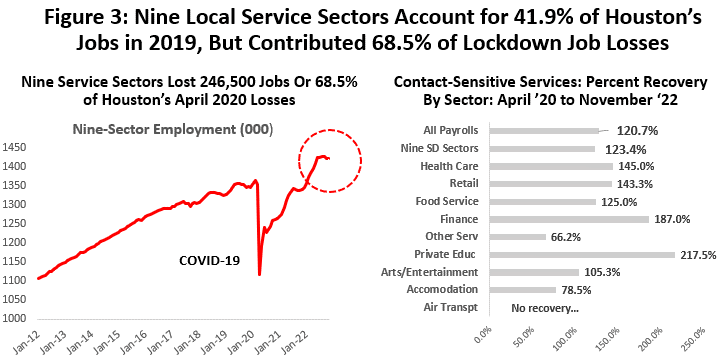
The key point about the vaccines is that they led a strong surge in contact-sensitive jobs. This surge was led by the arrival of the vaccines in spring of 2021, and this improvement was further bolstered by two large stimulus packages that together totaled $2.5 trillion. As the population became more comfortable with public settings, and was given the wherewithal to spend, these service jobs sprinted forward, and contact-sensitive job losses were completely restored by last February. By September of this year total local employment was catching up. All of the lockdown losses in these nine COVID-sensitive sectors were restored plus another 23.4%, compared to a similar gain of 20.7% of total Houston payrolls. These service jobs have clearly slowed recently and had been leading the overall economy by a far greater margin until just the last few months when the recent surge in total job growth closed the gap.
Sector-by-sector gains came as COVID damages tied immediately to the virus and many public health regulations were reversed by vaccines. The largest three sectors – health care, retail, and food service – have high recovery rates at 145.0, 143.3, and 125.0 percent.
We will count several such mini-bubbles as we move through this report – others in spending and housing, for example – and several of these contact-sensitive sectors appear to have surged to levels well out of line with total employment gains thanks to fiscal and monetary stimulus. Our forecast anticipates a turnaround in the growth of these social-distancing jobs in 2022 as stimulus cools, leading to the loss of 10,000 or perhaps much more of these jobs by the end of this year or early in 2023.
The End of COVID Stimulus
Fiscal stimulus was an enormous injection of cash into the economy that now has come to an end for practical purposes, and it now must be replaced by local economic growth. The stimulus came in two waves of about $2.5 trillion dollars each, first in early 2020 during the lockdown period, then followed by two more rounds in late 2020 and early 2021 that totaled a second $2.5 trillion. Two and a half trillion dollars was about $16,800 per U.S. household in 2020, and each round saw about half of this cash flow to individuals directly or indirectly -- but quickly and as needed. The money went into the bank accounts of individuals and businesses mostly through economic impact payments, the paycheck protection program, and enhanced unemployment checks.
In Figure 4, the blue line shows the pandemic-period track of total personal income (including stimulus), and the red line is the wages, salaries, and income of the self-employed (no stimulus). Each point compares these measures to pre-pandemic levels in February 2020. The initial round of stimulus came against a backdrop of consumer shock and lockdowns, and a ten percent drop in early wages and salaries that was immediately matched by ten percent jump in personal income via stimulus. These cash payments appeared to quickly right the economic ship by mid-2020 by offsetting wage losses and delivering record levels of income. Pre- pandemic levels of wages and salaries were fully restored by November 2020.
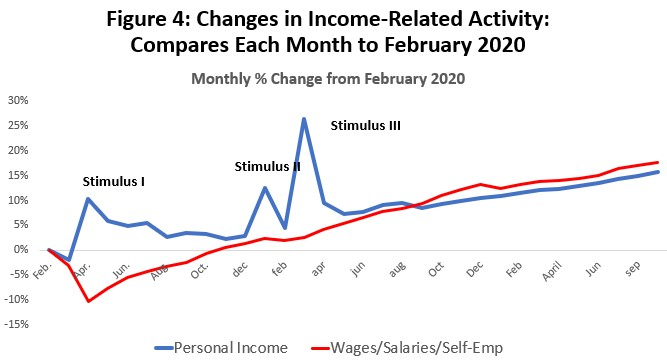
The lockdown month of March 2020 was the only month that U.S. personal income fell below pre-pandemic levels, telling us that consumers have had the wherewithal to spend if they chose to do so. In fact, Americans collectively were never before been so well off financially as during the pandemic.
Figure 4 also shows us an economy is now expanding on its own. The red line for wages and salaries has been growing rapidly since late 2020 and now stands 17.6 percent above pre- COVID levels. The blue personal income line has been steadily slowing as the stimulus recedes, although it is now being carried forward nicely by wages and salary growth and remains 15.7 percent above pre-COVID levels. The gains are much less impressive if inflation is removed, however, with personal income up only 3.0 percent since early 2020 and wages and salaries up only 4.8 percent.
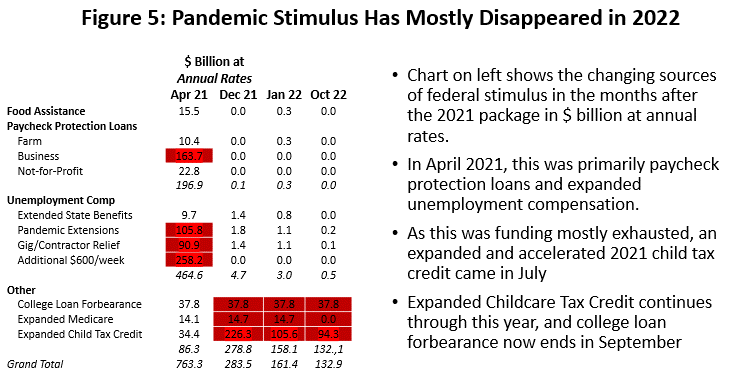
Figure 5 shows how the stimulus has slowly disappeared over the last year. The first column for April 2021 is just after the final round of stimulus, and it shows that the paycheck protection program and enhanced unemployment compensation programs dominated spending, running at monthly $763 billion measured at annual rates. Almost all of these programs ended last fall, and by January fiscal spending was only $164.1 billion at annual rates, mostly via expanded Medicare and college loan forbearance. An expanded childcare tax credit ended in September and college loan forbearance ends this year.
How will the Houston and U.S. and Economy Replace the Stimulus?
The stimulus payments had a big impact on spending in the U.S. and Houston. Figure 6 shows the obvious timing of a jump in U.S. retail sales following each round of fiscal help: first, there is returning retail activity to pre-pandemic levels by June 2020, followed by an added sharp pick up that comes in March 2021, pushing spending well above pre-pandemic levels where it has stayed throughout this year.
However, inflation is taking a substantial toll. Consumer prices including food and energy rose 6.2 percent measured fourth quarter to fourth quarter of 2021 and at a 10.0 percent annual rate in the first two quarters of 2022. The bite that inflation has taken from spending is the difference between the blue and red lines of Figure 6.
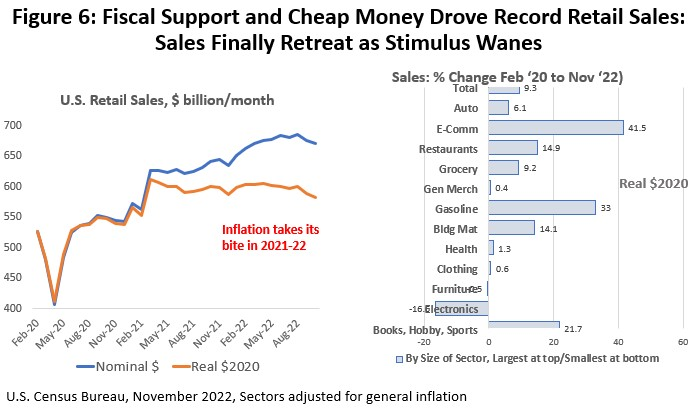
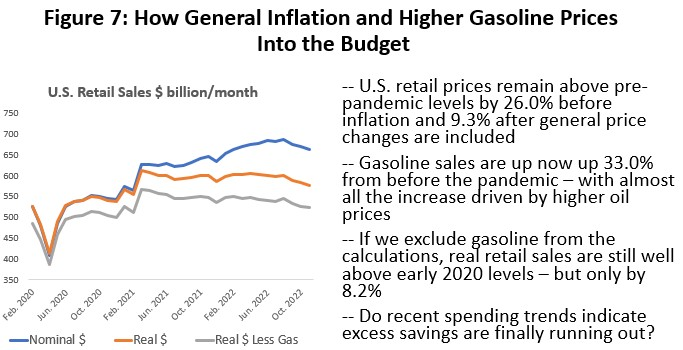
Figure 7 sharpens the focus on inflation. U.S. retail sales are again 30.4% above pre-COVID levels in August, and even with inflation subtracted out consumer spending remains 14.2% above pre-COVID levels.
We finally begin to see signs that spending is beginning to slow in recent months. November revisions to the spending data clearly support the idea the idea that consumer spending is finally weakening and rolling over. Economists have been waiting for this to happen for some time for the stimulus to finally wear off.
Another argument has been that spending has remained high only because gasoline prices are still up, because gasoline is an essential item in many budgets with no easy way to substitute for it. Gasoline sales are still up 33.0 percent from before the pandemic, and almost all the gain was price increases. But even if we take gasoline out of the calculations, consumers are still keeping spending on other goods and services at levels well above pre-COVID levels. This still looks suspiciously like a retail spending mini-bubble driven by the 2021 monetary and fiscal stimulus.
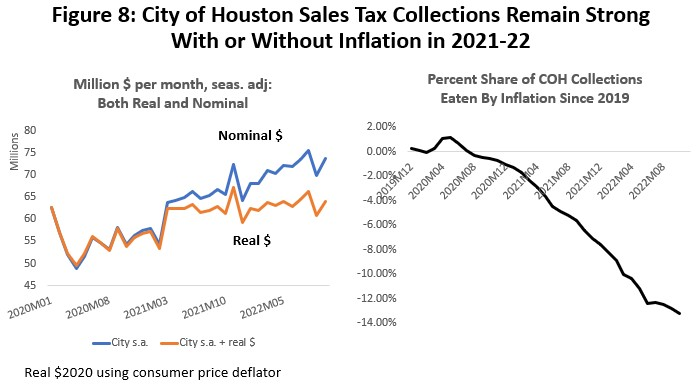
There is no reason why Houston has not been a full participant in the stimulus payments and in any resulting local spending bubbles. Figure 8 shows City of Houston sales allocations and not retail sales, but we see the same pattern as the U.S. with continued high levels of spending.
Figure 8 also shows the COVID history of sales tax collections in both current and inflation- adjusted dollars. Before COVID, City revenues in 2019 had been trending upward to near $60 million per month, only to fall back to $50 million in the April lockdown. Allocations stabilized and returned to pre-COVID levels with the first stimulus, but significant recovery does not come until March 2021 and several months of allocations above $70 million, following the lead of an improving U.S. economy, vaccines, and further stimulus. This spending surge is despite the fact that Houston’s economy continued to struggle until this April to return to 2020 pre-COVID levels of employment.
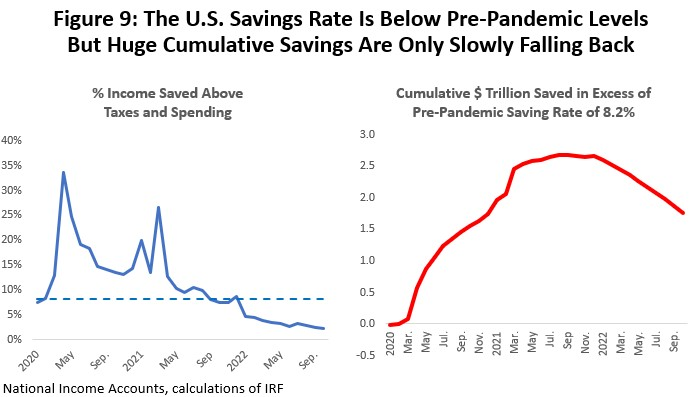
How do allocations stay high with the stimulus now largely depleted? The key for the consumer is that the pandemic stimulus was not all spent, and much was saved. “Savings” as defined by the National Income and Product Accounts are simply the difference between after-tax personal income and outlays on goods and services. If 8.2 percent of after-tax income is a comfortable past level of saving, Figure 9 shows that actual savings rates were far higher throughout the pandemic. The saving rate finally slipped below 8.2 percent only early this year and has fallen to a very low 2.3 percent in the most recent data.
The right side of Figure 9 shows that these past savings accumulated into a huge amount of money, with “excess” savings above the 8.2% mark reaching $2.7 trillion in September of last year, and still around $1.8 trillion in October.
You must be careful with the definition of savings, however. It includes anything that is not spent on goods and services and included in “outlays.” New homes, existing homes, upgrades of existing homes would be in savings, along with any financial investment like stocks and bonds. Liquid investments like checking, savings, or money market accounts were substantial, however, and the amount is important because they are the dry powder that can still drive spending forward. Stocks and bonds might be liquid or they might have gone to a 401(k) where they are subject to penalty withdrawals, or maybe they were just losses to bad investments in meme stocks. It is unclear exactly how much dry power is really available, i.e., how easily past investments can be converted to cash? And how this question changes by income level, i.e., does it matter only to the bottom of the income scale as excess savings dry up?
Economists have been expecting a decline in real consumer spending for some time, and so far, they have been disappointed. High levels of spending will likely continue as long as the consumer is willing and able to dip into liquid savings. There are signs of the low-income consumer beginning to struggle, with credit-card use rising, for example, although bills are being paid on time. But high inflation, rising interest rates, and a slower job market will accelerate the arrival of spending cuts. And it is not a matter of “if” spending pulls back -- just a question of when it happens.
Local big-ticket items have been subject to similar COVID-driven mini bubbles. The sales of local trucks and autos for example have remained relatively subdued, mostly due to shortages of chips and other supply chain issues that left dealer lots empty. But we have seen sharply rising car prices in place of the number of sales, with prices quickly moving up 25% and reaching over $50,000 for the typical Houston truck or auto.
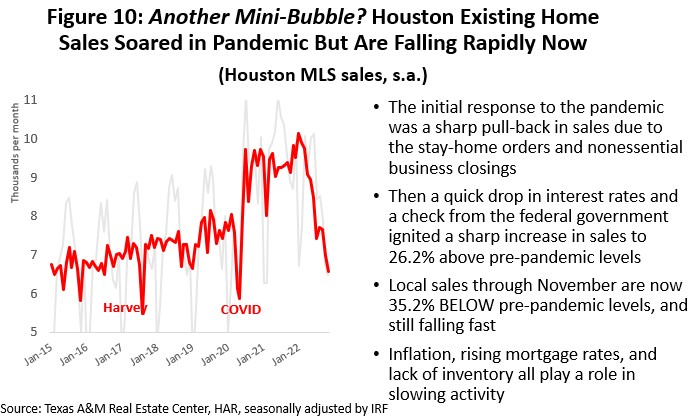
Also, Houston’s existing home sales and prices soared with successive rounds of stimulus. This began early in the pandemic and was helped by low interest rates as well as fiscal spending.
Existing home sales spiked as much as 26.2% above pre-pandemic levels, prices rose 38.1%, and inventories fell to a 1.3-month supply. Figure 10 shows that seasonally adjusted sales have been in full retreat since early this year, and home prices have leveled out and inventories are slowly rising. Higher mortgage rates have been the primary lever in bursting this COVID mini bubble.
Inflation Changes the Outlook
Inflation is often described as too much money chasing too few goods. The current outbreak of inflation is significant and almost certainly results from both too few goods (a still-incomplete COVID recovery and continued supply chain disruptions as exemplified by on-going Chinese lockdowns) and too much money (especially the large 2021 fiscal package that arrived after pandemic support was needed). The Federal Reserve also gets its share of blame for reacting too slowly to the inflation threat and arriving late with aggressive policy measures.
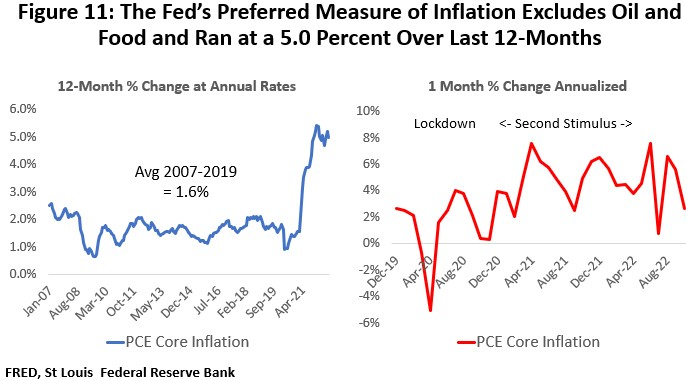
The Federal Reserve’s preferred measure of inflation is the Personal Consumption Expenditure (PCE) deflator excluding oil and food prices. Food, oil, and other energy products are excluded from the remaining core of goods because they are volatile and often dependent on noneconomic factors like war, embargoes, or crop failure. The Federal Reserve has no control over oil markets, weather or harvests, and for policy purposes it reacts only to the narrower group of goods that it can control.
By this measure, Figure 11 shows that 12-month inflation peaked at 5.4 percent last February and has since barely trended down to 5.0 percent in October. Month-to-month changes have been volatile, averaging 4.6 percent if annualized. The Fed has acknowledged this only as a beginning for policy and also has strongly and recently reiterated its 2 percent policy goal for core inflation.
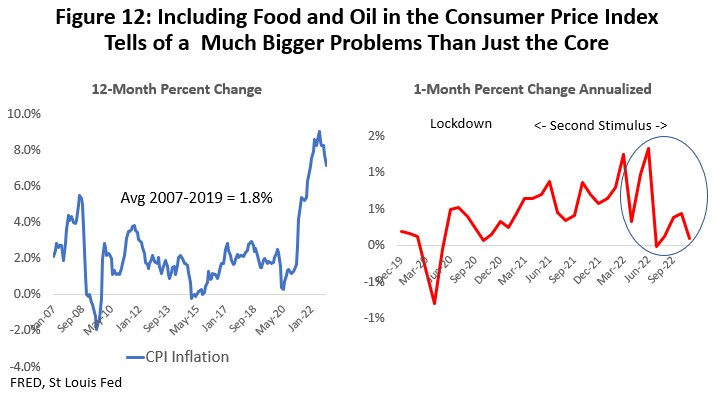
Once food and oil enter the equation, the consumer’s picture of inflation becomes much more pessimistic. Note in Figure 12 that inflation began to pick up strongly in March 2021 as the Ukraine/Russia conflict begin in early 2022. However, Ukraine simply made an already-serious problem much worse. Embargoes of Russian oil briefly pushed oil’s price as high as $125 per barrel and it remains near $80 today, and Ukraine – the Breadbasket of Europe – could plant or move many of its crops to market. Summer droughts in the U.S. and Europe added another layer of gloom. If we shift the previous chart to the more familiar Consumer Price Index (CPI), and include energy and food, then 12-month inflation peaked at 9.0 percent in June and recently fell back in October to 7.1 percent. The latest one-month, annualized changes have been volatile and hard to interpret. So far, progress in bringing down headline inflation remains mixed in 2022.
Where is inflation Headed?
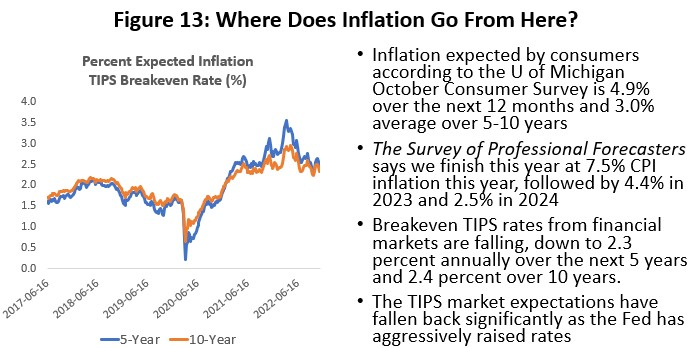
Where does inflation go from here? See Figure 13. The Fed has a critical interest in where the public believes inflation is headed and their expectations for price change. They want business and consumer expectations to be well-anchored at or near their two percent policy goal. If expectations move higher, demands for wage increases become embedded and kick-off a wage- price spiral. Figure 13 contains several measures of expectations that -- so far – indicate that in coming months the Fed can and will bring core inflation back to two percent annual rates.
Consumer expectations as measured by the University of Michigan’s widely followed survey says prices will rise 4.9 percent over the next twelve months and 3.0 percent annually over five years. Consumer expectations for inflation have a long history of being gloomy, but recent cuts to their outlook have favored inflation falling under control.
Alternatively, if we look at the Survey of Professional Forecasters outlook assembled by the Philadelphia Fed we see 7.5 percent inflation for this year, followed by 4.4 percent in 2023 and 2.5 percent in 2024. The longer-run projections fall to 2.1 percent.
Over the coming five years the CPI estimated by financial markets – based on the breakeven inflation rate implied by Treasury Inflation-Protected Securities (TIPS) – indicate 2.4 percent inflation annually over five years and 2.3 percent over 10 years. These expectations also have fallen back steadily in recent weeks as the Fed has become more aggressive in raising rates.
Certainly, the continued fall over time in expectations in all surveys sets a positive tone. Especially as the inflation estimates listed in Figure 13 include food and energy, meaning the core measures of inflation should look even more positive.
The Fed’s policy committee has now raised its target fed funds rate six times this year with increases of 25, 100, 75, 75 and 75, and 50 basis points, and fed funds now stand at a target range of 4.0-4.5 percent. Figure 14 shows projections of fed funds based on futures markets and other financial variables, indicating a terminal Fed funds rate near 5.0 percent in mid-2023 and holding there though much of the year.
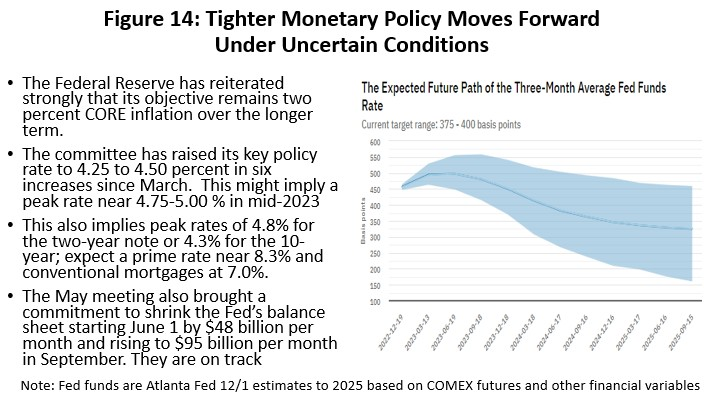
Looking through various major bank forecasts, the two-year note might peak at 4.8 percent and the 10-year near 4.3%. The 10-year is widely used as a key rate for mortgage determination and many other important financial decisions. Conventional mortgage rates could rise to 7.0 percent and the prime rate to 8.25 percent.
The current 10-year note is near 3.5 percent and the coming rate increases will slow consumer spending and home purchases as credit card and mortgage rates rise; they mean less investment by business, slower general construction, and falling capital spending for machinery and equipment. Higher interest rates typically hurt the stock market and bring capital losses for equities, and they reduce the value of existing fixed rate securities.
Policy is moving quickly as the Fed tries to make up for falling behind in its efforts to slow inflation, and a modest recession in 2023 has become a widely discussed possibility. No recession is built into the forecast, however, as we follow the lead of the Survey of Professional Forecasters who see job growth of about 100,000 jobs per month over the next four quarters. Meanwhile, these forecasters say real GDP averages 1.8 percent. This is a substantial contrast to economic expectations from just a few months ago, which were for the end of the COVID pandemic to bring a smooth transition back to normal growth.
What $100 Oil Means for Houston’s Economy in 2022
The Russian invasion of Ukraine that began in late February continues as a hot war, and it has brought extraordinary market disruptions to oil, natural gas, wheat and many other global commodities. When oil and natural gas prices have soared in the past, they have typically brought long and enduring U.S. oil booms with rising rig counts and growing production. So far, the American oil industry has been reluctant to chase higher oil prices at all, much less buy into a sustained multi-year commitment to oil prices at $100. Indeed, it is unlikely that $100 oil will ever again mean what it once did to the American fracking industry -- or to Houston’s economy.
We start with a high-level perspective on the current state of the U.S. fracking industry. This is not the same industry that responded to high oil prices from 2007 to 2014 with 2,000 working rigs in the U.S. Instead, fracking’s recent history is of an industry seriously damaged by a series of reckless investment decisions in the run-up to the 2014 fracking bust, by its continued bad investments after 2016 when it was clear that fracking is a high-cost source of oil, and by repeated punishing price cuts from OPEC+ that forced this high-cost reality on them.
- Growth of tight oil and natural gas exploded in the early 2000s, and it has since been boom and bust for American fracking. U.S. oil production boomed at 24.6 percent annual rates from 2004-2014 as a result of OPEC driving $100 oil prices, the Federal Reserve delivering zero interest rates after 2008, and speculative excesses by both the U.S. fracking industry and those who financed it. It was an oil boom that rivaled the 1980s.
- The fracking bubble burst in 2015-16 when OPEC slashed oil prices, but it took until 2018 and rising interest rates from the Federal Reserve before the last avenue of growth was cut off from this capital-intensive industry. With oil prices hovering at $50-$55 in 2018, the industry could neither improve equity values nor earn significant profits.
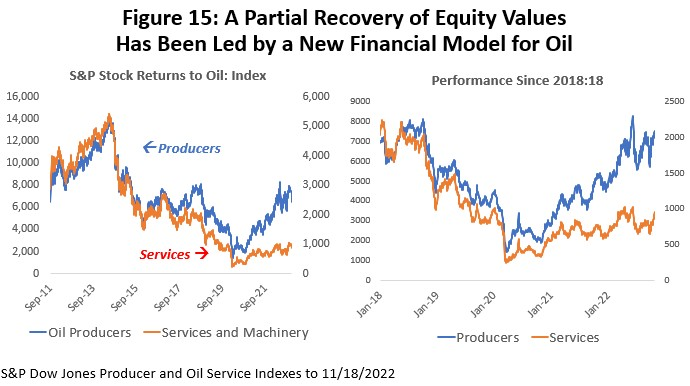
- In 2018-19 the fracking industry saw a severe industrywide credit crunch as Wall Street and the investor community turned its back on the fracking business. The S&P Producer Stock Index was over 14,000 in September 2014, but it had fallen to near 2,400 by August 2020. Even with the current oil prices near $85, producer equity prices have only returned to 2018-19 pre-pandemic levels. Oil services and machinery suffered even worse losses and have seen relatively little recovery. (Figure 15)
- COVID lockdowns and the Saudi-Russian oil war in May 2020 marked the low point for fracking – and posed a near-death experience for many companies. The rig count briefly fell as low as 267 working rigs, down from near 2000 in 2014, and it has only recovered to 750 in 2022Q3 compared to over 1000 rigs working in 2019.
- Before 2014 the fracking industry – with the support of $100 oil – was a high-flying growth stock. All its free cashflow could be directed to the oil fields and new production. However, the 2014, 2018-19, and 2020 reversals took $300 billion in oil producer, oil service, and machinery assets through the bankruptcy courts. Today a smaller and chastised industry is a value stock that can attract investors only by committing 30% or more of its free cashflow to potential investors through dividends or to rebuilding its financial position. This means a smaller and more slowly growing industry, and that any given oil price brings a smaller impact on oil fields than in the past.
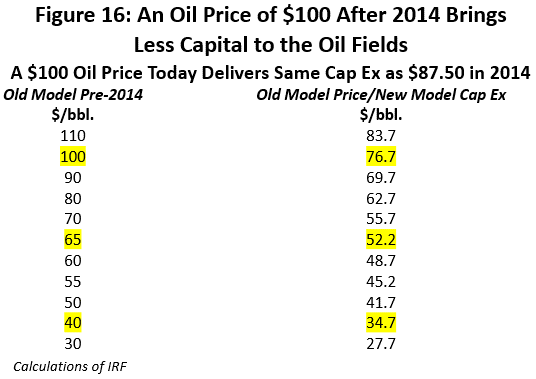
- How much smaller? Given the new financial model, how would the industry respond today to a WTI market price of $100? We know that the capital diverted to the oil fields under the new financial model will be less than before. Let’s ask the following “what if” question: Once we see the new lower capital spending level, what if we had been working under the old free-spending model? Back in 2014, what oil price could have delivered this new lower level of capital? The answer is in Figure 16, and we interpret it as saying that what $100 oil prices deliver today as oil field spending could have been bought for $76.67 under the old financial rules. For $65 oil, think of it as today having the same impact on drilling as $52.70 would have in the boom days.
Time for Houston’s Oil Sector to Make Some Gains?
Even putting thoughts of $100 oil prices aside, there is plenty of room for fracking to make some substantial gains in 2022-23. This was true well before the Russian invasion of Ukraine, and our forecasts from last year already included some meaningful increases in oil field activity and local oil employment in 2022-23. This was based on financially responsible gains by the fracking industry as its economic health has improved.
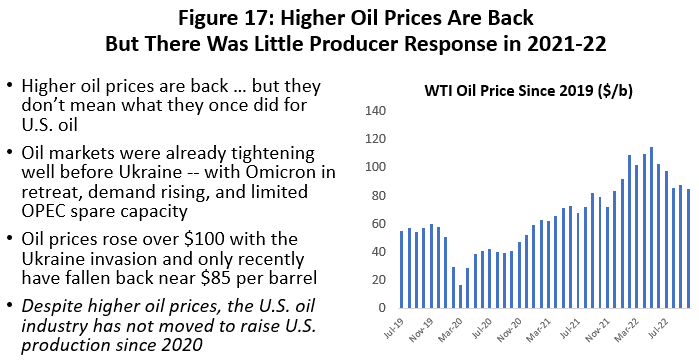
Until recently, producers were reluctant to react to higher oil prices with more drilling as long as their financial position remained weak. Recent higher oil prices and stronger balance sheets, however, have offered producers the opportunity to respond with more drilling and production, although so far with limited results.
Even before the embargoes of Russian oil, oil prices have been over $70 per barrel since the summer of 2021 (Figure 17). Although we just learned from Figure 16 that $70 now has the same impact on drilling as $55.70 would have had a couple of years ago. But the producer response, based on improvement in the rig count or local oil employment, has been weaker than even $56 would suggest.
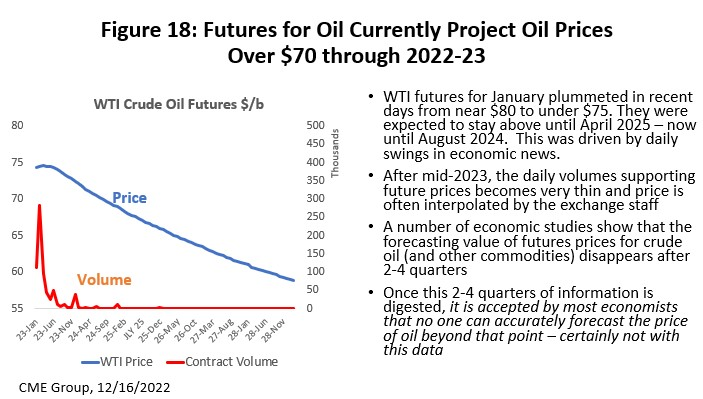
Producer caution was well justified because of skepticism about $100 oil. But how long will it last? Oil prices are up nicely now, but can they trust higher prices far into the future? Figure 18 shows recent futures prices are projected to hold at $80 per barrel through spring of next year. But the daily volume of contracts on which the futures prices are based become exceedingly thin past late 2022. Further, study after study of commodity markets conclude that there is virtually no information about the future in these prices past three to six months. Despite the army of consultants that has grown up around forecasting oil prices, studies repeatedly confirm that no one can predict the price of oil effectively past that 3 to 6-month point. Oil markets are too complex, we are missing too much basic information, and they repeatedly are subject to unforeseeable events like recession, pandemics, and European wars.
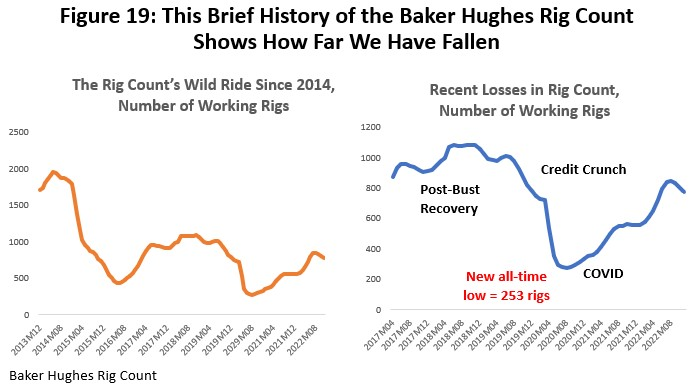
Slow and methodical recovery in the oil fields since 2020 is seen in Figure 19 and in the latest data on the rig count. Working rigs have made only limited progress over the past 18 months. The rig count fell from near 2000 rigs in 2014 to an all-time quarterly low in 2016 of 420. The pandemic and Saudi-Russian oil war then crushed that record in August 2020 with a further fall to 252 rigs. The rig count still shows a return to only 760 working rigs through December of this year, well still short of the 1000 level briefly reached in pre-pandemic 2019, and with few signs of further progress to come in recent months.
Houston’s recent trough in local oil-related employment came in September 2020 after losing 35,700 upstream jobs measured from its June 2019 peak. These are large losses, but only half of the 77,200 oil-related jobs lost during the 2015-16 Fracking Bust. The 2015-16 collapse in Houston jobs resulted from a bubble that burst in U.S. fracking after oil prices fell hard in late 2014. Oil jobs hung on better this time because the local job market already had been substantially right sized by early 2020.
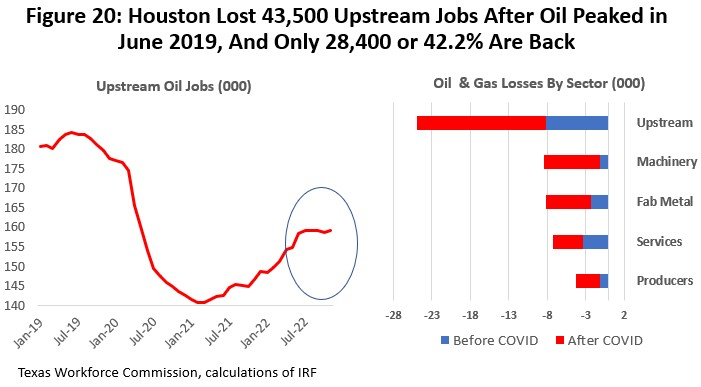
Many of the oil jobs currently lost may return – but not quickly or soon. Figure 20 shows changes in upstream oil jobs: producers, services, machinery, and fabricated metal. They are measured from (1) the beginning of the 2018-19 credit crunch and before COVID, and (2) after the COVID-19 outbreak to the present. The data through November show a recovery of oil jobs that adds up to only 18,400 or just 42.2% of the mid-2019 losses, and it leaves Houston at an oil-jobs employment level still well below even the 176,500 pre-pandemic level.
Time to Move Forward?
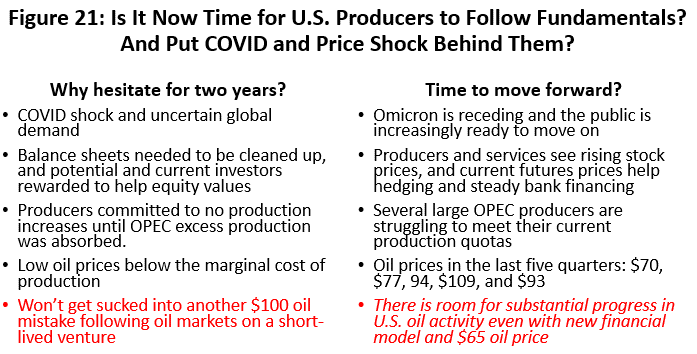
As a high-cost source of oil, fracking needed to completely rethink its financial model, and reconsideration has been underway since mid-2020. Amid the gloom, however, there is reason to think that perhaps the worst is over, and that it is time for U.S oil to respond better to higher oil prices than it has so far. Oil operated below fundamentals through the pandemic for good reason: COVID shock and uncertain global oil demand, the industry’s poor financial position, and because many U.S. producers committed to not increasing production until all OPEC excess reserves were absorbed. Producers were certainly unwilling – and remain unwilling -- to get sucked into another $100 per barrel venture that could lead to one more short-lived mistake and another round of fracking bankruptcy. See Figure 21.
But now much of this damage has been repaired with COVID disappearing, great progress in financial positions, and OPEC struggling to meet production quotas even before the Ukraine invasion. The blue line in Figure 22 is the recent history of the rig count. The red line is where U.S. drilling would be if – apart from the new financial model – there was no structural change in the industry’s ability to take advantage of higher oil prices, and the rig count ramps up to respond to a $65 price target in late 2022 and after. This puts the pandemic shock behind us with a $65 price describing the industry’s new long-term niche in world markets. It is a price (even with the new financial model) that makes sense for long-term capital investments, with remaining cash flow going to fortify finances, for some M&Amp;A, and to investor dividends.
This makes the red line our forecast for drilling. The blue line is the history or actual data up until 2022Q2. The short-term surge in drilling is the ramp up in activity to match $65 oil, and the broken blue line is to describe the still-uncertain path to describe when and where the recent past might meet the future forecast.
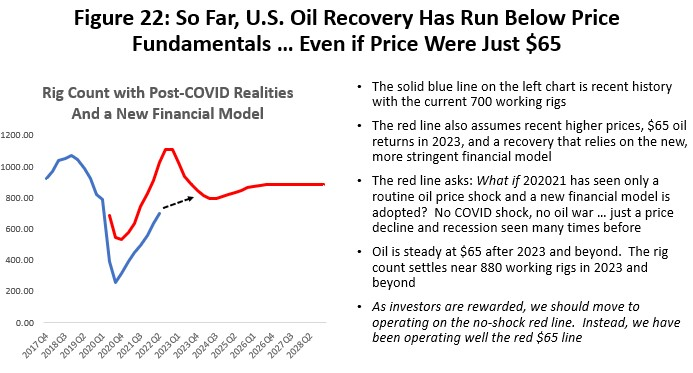
We have seen any forward motion toward filling that gap with a rig count stalled near 760 since 2022Q3. But the potential for improvement is back and is built into our forecast for the rig count and local employment. Our forecast is for the gap to close in mid- to late-2023 as drilling returns to long-run normal growth by late next year. This would be activity consistent with $65 oil prices prevails, with a rig count near 850.
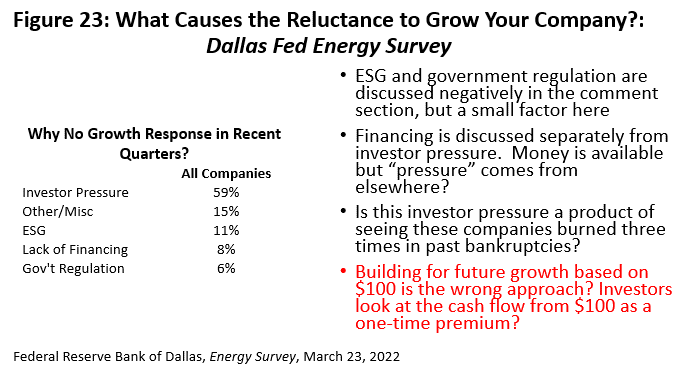
The March Dallas Fed Energy Survey asked why fracking producers have been so slow to respond to higher oil prices given the industry’s better financial and economic position described in Figure 23. Companies gave ESG and government regulation surprisingly little consideration as factors that slowed them down, and lack of financing is no longer a significant issue. The dominant factor is simply continued investor pressure. Perhaps this is interpreted as follows: After watching the industry throw good money after bad in three rounds of bankruptcy, investors are unwilling to even consider investments in $100 oil projects as a profitable way to spend company capital. It is better to steer the cash directly to investors or to fortify the company’s finances.
That said, our forecasts assumes that producers are finally able – and perhaps willing -- to move forward at a rate consistent with oil prices near the long-run cost of producing tight oil or about $65 per barrel. This would push the rig count up to 850 rigs by late 2023, and it would remain at that level as long as a $65 oil price or better prevails. Local oil-related employment should follow, also returning to pre-COVID 2019 peaks by late 2023.
The Business Cycle and the Economic Base
We showed earlier in Figure 8 how the early phase of the COVID recovery was relief from the medical emergency once the vaccines arrived in the spring of 2021. But vaccination also brought quick relief to employment by reducing the fear of close personal contact, bringing less social distancing and fewer public healthcare restrictions.
The economic base is a different but closely related concept that defines the business cycle in Houston and other localities. The base is the set of industries that can sell their goods and services outside the local metropolitan area to the rest of the state, the nation or the world. The most obvious Houston example is oil with upstream and downstream serving a national and global market. But there are many Houston companies that are not oil-related and sell outside the region – AIG, Sysco, Waste Management, etc.
In recent years, there have been as many as 500,000 of these base jobs divided about 50-50 between oil and non-oil employment. The rest of the jobs in Houston are non-basic and or secondary jobs. Once the base industries define a growth path for the metro area by bringing profits and revenues to Houston, these secondary jobs follow in their wake. By definition, these secondary industries do not sell outside the region, but strictly locally with sales from one person to another – from Houstonian to Houstonian. They include much of health care, food service, retail sales, or personal services such as barbers and beauticians.
If this list of secondary industries sounds familiar, it is because of the substantial overlap with the contact-sensitive industries in Figure 3. By definition these were sales made locally, not outside the area, and were just non-basic jobs seen in a pandemic context.
The left side of Figure 24 shows the history Houston’s economic base – its business cycle drivers -- split between oil and non-oil related activities, with about 500,000 jobs in recent years and a rough 50-50 split between oil and the other parts of the base. This 50-50 division has persisted for many years.
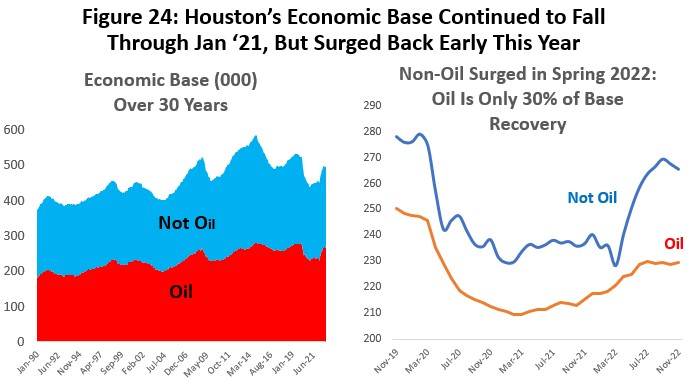
The right side of Figure 24 shows the most recent performance of the base, again split between oil and non-oil. After the oil base slid into the COVID pandemic in February 2020, it lost 36,700 jobs before bottoming oil in March 2021 and making a slow recovery that remains 17,700 jobs short of the COVID beginning point. Non-oil industries, in contrast, saw job losses of 49,800, with no trough reached before March 2022, and they remain 13,600 jobs short of February 2020. Unlike, the oil base with its slow, shallow recovery, non-oil industries stayed flat through 2021 and then rocketed up this year. While the non-oil jobs are on a likely path to recover all losses, oil jobs will remain on a slower path and will not see complete recovery for years – if ever.
What happened to the local economy during the pandemic? We can piece the story together as follows.
- First, the pandemic arrives bringing lockdown shock, fear of close contact, social distancing, and intense public health restrictions. We lose 360,000 jobs in two months, with most of them being in secondary industries that work person to person and are sensitive to close contact.
- If this had been a Houston-based virus only – Houston pox – it would have made little difference to the local economic base and the local business cycle drivers. The base doesn’t depend on local activity but sells outside the region, and the market outside Houston would remain strong despite Houston pox. However, in a widespread pandemic, other cities across the nation and world are similarly locked down, and Houston’s base collapses along with this loss of a much broader external market. We lose 87,000 base jobs.
- Economic recovery begins with the vaccines and the return of secondary contact- sensitive jobs that rebuild a national and global post-pandemic market outside Houston for goods and services as contact sensitivity becomes less relevant. In the pandemic case, the non-basic/secondary jobs become the recovery’s leaders, and the base jobs follow to restore a normal business cycle.
- Oil’s slow progress is a special case in this recovery. Like the non-oil base, the oil jobs were helped along by the vaccines and a non-basic recovery. But, as explained in the previous section, there was much more to the oil story, and oil’s recovery is unlikely to see this part of the base return to previous highs soon.
Houston’s Employment Outlook
We know generally how payroll employment should perform over the next few quarters. We have seen the return of large numbers of COVID/contact-sensitive jobs since March 2021 and they have now surged well beyond pre-COVID levels with the help of stimulus. These jobs are already falling back, and modest decline should continue as stimulus ends and excess savings are exhausted. We also see accelerated growth in the important jobs that drive the local business cycle. Overall, Houston finally returned to pre-COVID total employment in April, and the U.S. followed to match pre-lockdown employment in July. We expect gains in oil-related activity with improved financial health among producers, but drilling remains confined to responding to $65 oil price levels as investors steer the industry away from any capital spending based on oil prices above the long-run marginal cost of production.
To pull the forecast together, we will use a high, medium, and low outlook for planning purposes. We use the oil prices in Figure 25 as a vehicle to spread the outlook from high to low employment levels. For current planning, high oil price over this time period remains near $80 per barrel and the low is $40. The medium or most likely price is $65 per barrel or the long-run marginal cost of oil. In all cases we use the new financial model with 30 percent of oil industry free cash flow diverted to investors. This smaller industry limits our expectations for oil-field expansion and regional growth.
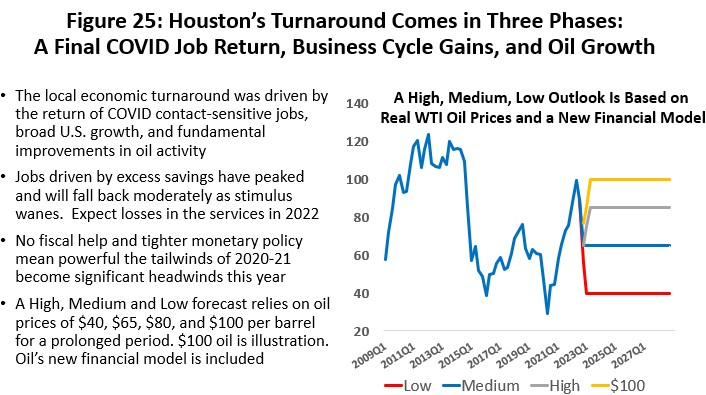
Figure 25 adds to the forecast the impact of $100 oil prices, but only to demonstrate the effect on the local economy if oil prices were to remain at that level for prolonged periods. The $100 oil price will never mean what it once did in Houston. As discussed earlier, the diversion of cash flows and reluctance to engage in high-cost drilling limit the future levels of oil-field activity.
The net effect, however, is that 2023 sees economic fundamentals return to the driver’s seat as oil and the U.S. economy take control, while the hangover from COVID and fiscal/monetary stimulus finally disappears. Unfortunately, these fundamentals now reflect a stringent monetary policy that guarantees a quick cooling off of the U.S. economy in coming quarters.
Figure 26 pulls together the key drivers of local growth in summary form. We follow the lead of the Survey of Professional Forecasters in assuming a slowdown in U.S. growth to a near standstill, but no recession. GDP moves through 2023 at annual rates of less than one percent with quarterly loss of payroll jobs that are near zero or slightly down. After 2023, growth picks up in the US, with a slow recovery to trend through 2024.
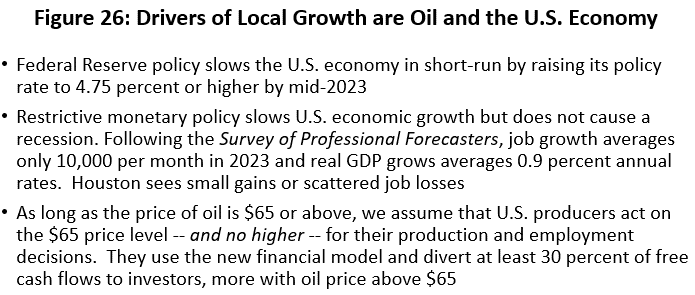
Figure 27 shows how these economic fundamentals play out over the long run for Houston payrolls in the low, medium, high, and $100 cases. This is our forecast of Houston’s future as far as calendar year 2028. We see the COVID lockdowns and recovery to previous employment levels and above, a sharp slowdown in 2023 that skirts zero growth, followed by 2024 as a year spent below-trend, with a return to trend growth in 2025 and beyond.
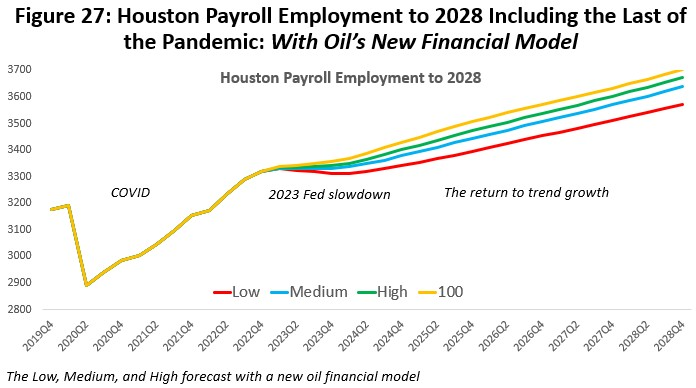
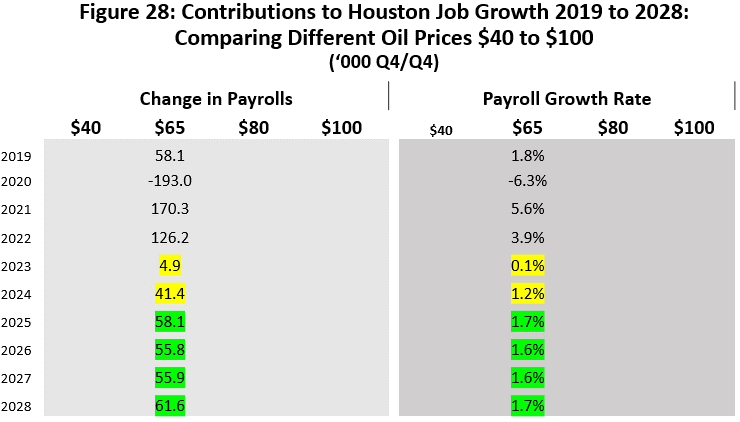
Figure 28 is this same forecast of Houston’s payroll employment to 2028 stated in annual changes that are measured from Q4 to Q4 each year. The focus here is on the medium forecast and $65 oil. We see the loss of 193,000 jobs in the lockdown year of 2020 or a 6.1 percent total decline in payrolls. We see the return in 2021 of 167,600 jobs led primarily by the return of contact-sensitive jobs.
This is followed in 2022 by a very strong 126,200 new jobs, or 3.0 percent. This apparent strength is discussed further below, and despite some downward revisions that we have already made to this number, there may be more revisions to come. Next year sees a major slowdown to near-zero job growth, followed by a return to 41,400 jobs in 2024. This would make 2024 a sub-par year that runs below trend, but 2025 and beyond reflect trend growth of 1.6-1.7%.
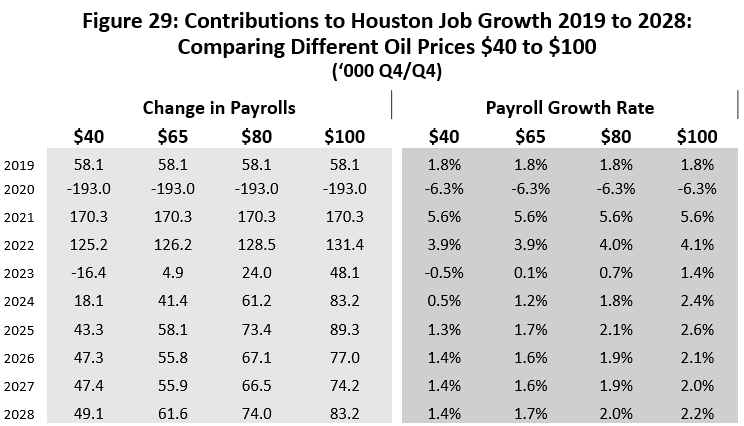
The results for high, low and $100 oil price forecasts are shown in Figure 29. The spread is the result if oil prices ranging for $40 to $100. If these oil prices were to somehow prevail into the long-term future, they would imply growth in jobs ranging from 1.4 to 2.2 percent annually.
Some Important Qualifications
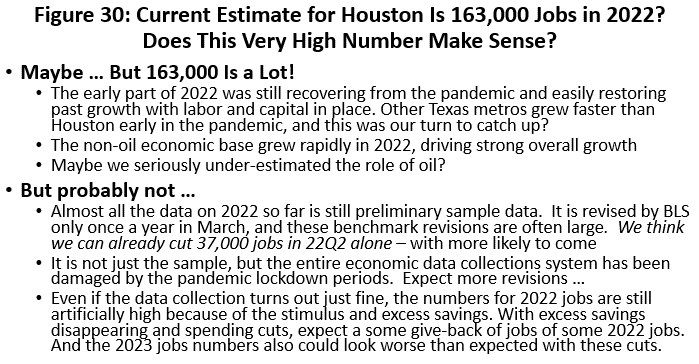
The current estimate from the Texas Workforce Commission for payroll employment in 2022 is more like 163,000 than the 126.2 used in Figure 28 and 29. A strong job-growth number is easy enough to justify with the local economy returning from lockdown losses through April.
Economic recovery is always the easiest and fastest part of the economic cycle because labor and capital are already in place. Further, we also saw strong progress in economic base employment – implying solid growth. But the 163,000 figure is very large and suspicious simply on the face of it.
Initial payroll estimates by the Bureau of Labor Statistics are based on a sample, and for any metro area, even one as large as Houston as large as Houston, it is a relatively thin sample. Administrative records on unemployment insurance eventually fall together to provide a definitive accounting of payrolls, and each year in March the BLS and Workforce Commission stop to revise the data based on the accumulated records. The resulting changes in local payrolls are often large.
A preliminary look at the administrative records for the second quarter of this year just became available and they indicate the sample was about 38,000 jobs too high in that quarter alone, and the 126,300 figure currently used in these tables reflects this early downward revision. The BLS has not make any changes before March and we did yet not change any numbers related to 2022Q3 or Q4, but we suspect that there will be further large downward revisions to come by when official revisions become available. Final revisions perhaps could bring 2022 to 100,000 new jobs or fewer – which would still be a banner year for Houston.
The accumulated excess savings from the pandemic present us with a second problem regarding this job count. It seems sure that the pandemic stimulus will fade and spending fall back sharply, as we already see the beginnings of the decline in the retail spending data.
Current estimated job growth is quite fast, and the part that is growing faster than average during 2022 is the nine service sectors listed in Figure 3, professional and business services, and wholesale trade. Together, these sectors accounted for 75.0 percent of Houston’s job gains to November. Along with spending already falling back, it seems sure these sectors will be caught up in job cuts as well. This is all independent of the Federal Reserve’s actions and other factors slowing the economy.
But in terms of forecasting growth, the loss of jobs to a slowing stimulus has mostly been accounted for in the 2023 projection of only new payroll 4,900 jobs in 2023, even though some meaningful part of it will likely come in 2022. This leaves the both size and timing of the stimulus-driven highly losses uncertain between 2022 and 2023.
By March much of the mystery about data revisions will be solved, and we will better be able to understand the jobs impact of exhausting the excess savings. Meanwhile, this just adds another layer of uncertainly about the path of the U.S. economy next year.
Written by:
Robert W. “Bill” Gilmer, Ph.D.
Director, Institute for Regional Forecasting
December 19, 2022
University of Houston
C. T. Bauer College of Business