Houston Updates
-
Archive
- June 2025
- March 2025
- December 10, 2024
- September 14, 2024
- May 21, 2024
- March 19, 2024
- December 9, 2023
- June 16, 2023
- April 6, 2023
- March 17, 2023
- Dec. 19, 2022
- Sept. 14, 2022
- July 4, 2022
- March 27, 2022
- March 9, 2022
- September 2021
- April 2021
- March 2021
- September 2020
- August 2020
- June 2020
- April 2020
- March 2020
- January 2020
- December 2018
- June 2018
- March 2018
- February 2018
- January 2018
- September 2017
- September 2017 Post-Hurricane
- June 2017
- March 2017
- January 2017
- September 2016
- March 2016
- December 2015
- September 2015
- June 2015
- March 2015
- December 2014
- June 2014
- March 2014
- November 2013
- September 2013
Houston’s Economic Outlook Reshaped by COVID-19 and the Oil Price War: An Update and Extension
April 8, 2020
This article substantially updates and extends a previous report on the outlook for the Houston economy due to COVID-19 1. The main change is the switch in perspective on COVID-19’s economic impacts from an illness and labor-shortage driven event to one given direction by public health mandates to stay home and to close large parts of the U.S. economy. Also, it clear that the winner of the oil war can now be declared, and it was neither Saudis not Russians -- but COVID-19. Global and national recession mean a long period of low oil prices ahead, with no need for look elsewhere for the cause.
New Perspective
As we work our way through the current public health and economic crisis in Houston, the outlook continues to evolve rapidly. Past pandemics have seen public health officials close schools and theaters, for example, but we have never seen the wide-scale intervention in the economy that is currently underway. These measures are necessary to ration health care capacity and save lives, but they also radically change the near-term economic outlook and our understanding of how local economic events will unfold.
Where does the economy go now? We divide the likely post-COVID-19 economy into two parts. First, there is the effect of the disease on the broad U.S. economy as the virus progresses through a six- to nine- month horizon. It brings an underlying trend of mild to moderate U.S. recession that unfolds over several quarters, and Houston will share the national downturn.
Second, there is the emergence within the Houston area of social distancing, including unprecedented stay-at-home orders from public health officials. These orders have forced rapid and chaotic reductions in employment and general economic activity. So far, service sectors like retail, hospitality, entertainment and food service are most heavily affected. As difficult as the orders are for businesses, if social distancing fails significantly we could face the loss of big swaths of the labor force to illness and family caretaking. This would again reduce activity and force business closings via another channel, as well as allow many more deaths.
With the virus still poorly understood and its ultimate spread unknown, we fall back on several illustrative scenarios and their economic outcomes. The results are surprising only compared to where we thought the economy would be just a few weeks ago, but it is now quite clear that we are seeing extraordinary short-term disruptions, in addition to the longer and broader economic downturn ahead.
Adding to the angst for Houston is the recent emergence of an oil-price war between Russia and Saudi Arabia. This has been joined by an extraordinary collapse in the demand for oil as the U.S. and European economies grind to a halt. Current low oil prices sharply raise the likelihood of Houston seeing a significant economic setback. But make no mistake, the virus remains in the economic driver’s seat, even in Houston.
After the illness subsides, public orders and economic disruptions end, and social distancing is no longer needed, where will we find the economy? For both the U.S. and Houston, the likely answer is that by the end of this year it will be in recovery from moderate recession, but otherwise in stable but improving condition.
COVID-19 and Pandemics
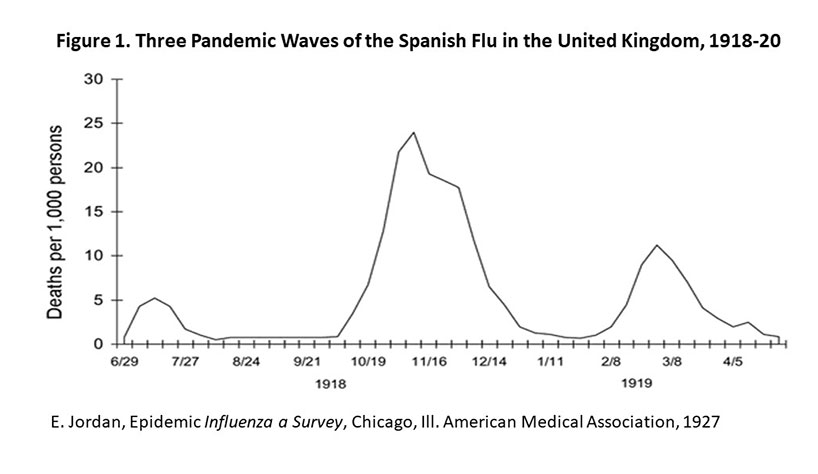
Past viral epidemics and pandemics such as influenza began with a local outbreak of the disease that spreads to other regions, the number of cases reported then grows rapidly, and the virus may remain widespread from three to six months. The number of infections and deaths peak and decline after much of the population develops a natural immunity, with a smaller second wave possible one or two months later. See Figure 1.
Influenza and other viruses bring a sudden and urgent need for medical services as a large share of the population finds itself infected. Figure 2 shows the case inflection rate for four pandemics that have occurred since 1918. For the Asian, Hong Kong, and Swine flus we see 10-30 percent of the population infected, and 0.2 to 0.3 percent of those infected will die. The Spanish flu stands out with its 33 percent infection rate and 2-3 percent fatality rate.
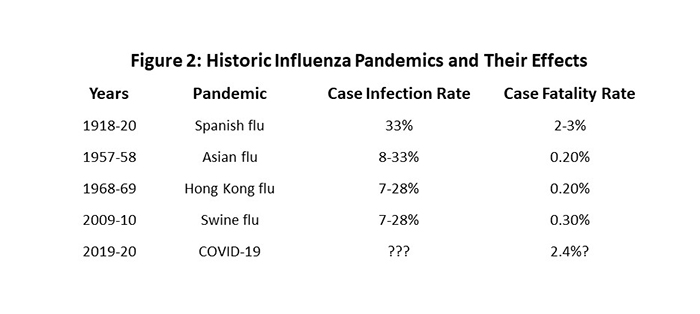
The fatality rate for COVID-19 now stands at 2.4 percent but remains a frightening statistic. We must hope it is just a statement about our current ignorance due to the lack of progress in testing for COVID-19 infections.2 The reported case infection rate has been low because testing for COVID-19 was not widespread, while deaths are counted more accurately. As testing proceeds, and we find out how many people have really contracted the virus, the mortality rate could fall quickly. Some experts say it could fall to levels similar to influenzas in Table 1.3
The number of people who contract the disease provides the beginning point for subsequent economic analysis. There is a surge in the demand for medical care, of course. Local public health ordinances that close schools, theaters, and prevent crowds from forming have long been employed. But as the virus burns its way through the population in past epidemics, the initial threat to the economy was the disruption to the labor force through the loss of workers to illness. Other workers that must stay home and care for the sick add to labor shortages.
The typical absence for COVID-19 is about two weeks or ten workdays. With 3.2 million payroll employees in Houston, a 30 percent infection rate means nearly a million workers could potentially be affected. If we assume the virus is spread evenly over 26 weeks and lasts two weeks, we will have an average of 74,000 ill (2.4% of payrolls) in any given week . But we know from Figure 1 that the number of cases won’t hold steady but rises from a low level to a sharp peak that might remove 8 or 10 percent of workers for a few weeks before falling back.
Any business could have trouble keeping enough workers to operate efficiently as the health situation worsens, perhaps forcing reduced shifts or forcing short-term closures. Then one company’s labor problems become supply chain issues for many others. Transportation links can break down due to labor shortages, or perhaps because lockdowns and shelter-in-place orders close regional or national borders and limit movement of goods and people
Adding to economic disruption, a significant demand shock occurs as the fear of contagion limits social interaction. Urban areas like Houston with a large and dense population will be among areas most affected. The economic sectors most damaged by social distancing are passenger transportation, hotels and accommodation, food and drink, entertainment, retail trade, education, and some professional services.
In this epidemic, the extraordinary measures currently being taken by public health officials to close down much economic activity have replaced labor and material shortages as the initial shock to the economy. Rather than illness from the virus, public health orders to stay home and close all nonessential businesses have become the leading edge of extraordinary and widespread economic disruption.
Impact on the U.S. Economy
Houston’s economy grows from its ability to sell its goods and services (including oil) to the rest of the country. Sometimes called the economic base, those industries that can reach outside the metro area and bring revenue from outside the region are the key drivers of local economic activity. Non-basic, or inherently local activities, such as retail, restaurants, entertainment, laundries and dry cleaners follow in their wake. As the saying goes, we don’t get rich by taking in each other’s laundry.
This is important now because social distancing, labor force reductions to illness, and supply chain disruptions are reducing economic activity across the country and reducing the market for Houston’s goods and services. How far will it reduce national economic activity, and how would that slowdown affect Houston? This section is about what happens to Houston’s economy via a national slowdown. Later we consider what happens in Houston as activity is hurt by local stay-at-home orders, limited social interaction, and worker illness.
We have three scenarios about what might happen to the U.S. economy. They encompass a broad range of economic outcomes and reflect enormous economic uncertainty about the course of both the pandemic and the economy. These scenarios were suggested by a 2006 Congressional Budget Office report on the possible effects of avian flu on the economy.4
Base Case: This is a business-as-usual scenario assuming that the viral outbreak is no worse than the seasonal flu with a 5 to 15 percent case infection rate and any macroeconomic effects are not perceptible. We use the Survey of Professional Forecasters latest report a growth projection and assume that $55 oil prices are still ahead.5 This is not a possible outcome now, but a standard for how much things have changed in just the last few weeks.
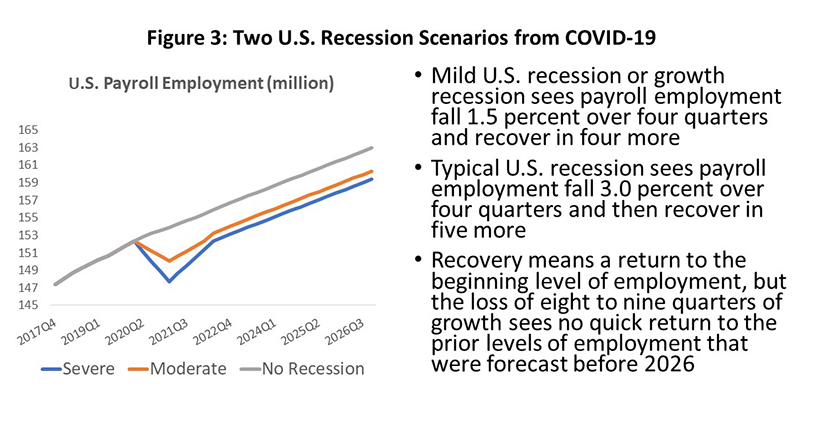
Moderate COVID-19: This CBO model is the Asian flu of 1957-58 with a 25 percent case infection rate. The CBO suggests a serious slowdown in growth or even a very mild recession would result. For our purposes, we assume a 1.5 percent fall in payroll employment over four quarters, with four more quarters needed to recover the jobs lost to recession or slowdown. The setback is assumed to last four quarters and the economy recovers to the beginning point four quarters later.
Severe COVID-19: The model is the Spanish flu of 1918-20 with 30 percent of the population infected and a high fatality rate. Influenza usually has a relatively low mortality rate except among the very young and old, but the high rate of death in the Spanish flu was due to a large and unusual number of fatalities in prime age groups. The CBO assumes this scenario could cause a recession typical of U.S. downturns that have taken place since 1948, or a fall in GDP of about 2.3 percent and a reduction of payroll employment of 3.0 percent. It is a four quarter decline, but with five quarters of recovery.
Figure 3 shows the effect of our assumptions on U.S. payroll employment. Both recessions share the same period of decline beginning in the first quarter, but with one additional quarter of recovery needed for the Severe COVID-19 case. Growth rates return to normal, but the loss of an unanticipated eight or nine quarters of normal growth leaves a considerable gap between the level of employment enjoyed before and after the recession.
Recent estimates from other forecasters such as Moody’s Analytics, Chase, and Goldman Sachs have offered estimates similar to the Severe scenario in term of the depth of the decline, but they assume a flat or declining first quarter, a very sharp drop in Q2, and then a strong bounce back in the second half of the year. Our recession lingers through the year, and is based partly on Figure 1, a model that implies as we enter the second quarter, we just passed the entry-point for widespread infection and mortality. Then, even as the influenza subsides or if we see a second wave, many restrictions on business and social life could remain in place for months if no vaccine is developed. More on this below.
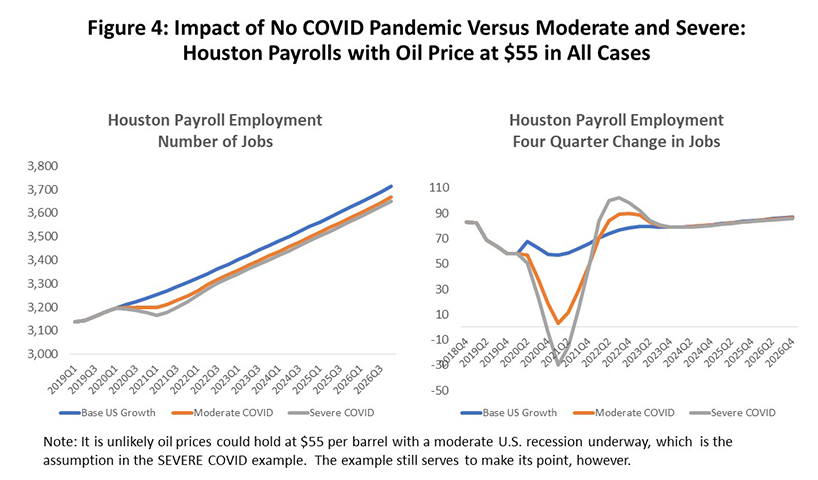
Figure 4 illustrates how Houston is affected by these hypothetical recessions. It shows the performance of Houston payroll jobs through the COVID-19 downturn and assuming that the price of oil is fixed at $55 in all three cases. We will add oil to the simulations later, but the chart tells us a familiar story about how Houston is typically less affected by economic downturns than the rest of the country.
The mild downturn of 1.5 percent in the U.S. sees Houston’s job growth remain positive over four quarters, though with only 8,800 net new jobs in 2020. This compares to 49,000 net new jobs forecast in January. The more serious U.S. recession translates into a Houston downturn that is half as deep as the rest of the country in percentage terms, but still results in recession and the net loss of 29,600 jobs by early 2021.6 Adding the current oil war later worsens the outcomes for Houston.
Flattening the Curve
Social distancing is not a new phenomenon in times of contagion, as fleeing the city to avoid plague and other epidemics is a staple of human history. Similarly, closings of schools, theaters and other crowded places have long been ordered by public health officials. However, the current mass stay-at-home orders are a new effort at controlling contagion through social distancing. We had nine of the ten largest cities in the U.S. under such orders in late March, and recent federal guidelines have extended them through April.
The purpose of these orders is to minimize how often people come within six feet of each other, and to reduce the spread of COVID-19. Referring back to Figure 1, this can flatten that curve of infection and mortality and reduce the peak number of people flooding into hospital systems. It will save many lives and reduce the burden and risk to healthcare workers. However, shaving the peak off of Figure 1 does not end the epidemic; it slows the spread but could allow it to return one or more times, probably forcing repeated rounds of social distancing or public response.
The history in Figures 1 and 2 -- where only limited social distancing norms were employed -- suggests a six-month period of contagion, peaking at the mid-point, and then receding to zero after 20-60 percent of the population has been infected. On this schedule, our first local COVID-19 cases came in early March, would peak in early June, and disappear by October.
Harris County and the City of Houston recently extended local stay-at-home orders to April 30. Harris County had previously been on an aspirational schedule to see COVID-19 cases peak on April 7, and local case infections would halt around May 12. It is now hoped that local case infections will peak by May 2.
In Figure 1, the virus disappeared once herd immunity is achieved. A certain proportion of the population becomes infected, then develops a natural immunity that protects them, and makes it difficult for the virus to spread widely. The share of population required to achieve herd immunity ranges from 30-40 for most influenzas to over 90 percent for the most contagious diseases such as measles or pertussis. The percentage required for COVID-19 is not well understood now, but it is described as highly contagious.
A vaccine would be the magic bullet, but according to most experts it will be 12-18 months before one can be developed. A candidate for a vaccine has already been developed and injected into humans, but animal tests and large-scale trials must be conducted to determine safety, effectiveness, and proper dosages. Experts estimate it won’t be ready before 2021.
Suppose Houston meets the May 2 peak in case infections, and local case infection is stamped out soon after. No local case infection means we stopped the spread of the virus from one Houstonian to another, but as long as herd immunity remains inadequate it takes only one infected visitor to reignite the epidemic. With New York and Seattle already seriously affected and new hot spots developing in Atlanta, Detroit, Chicago, and New Orleans, Houston could soon find itself in another round of restrictions. Continued fear of contagion alone would slow retail sales, hotels, bars, restaurants, barber shops, and movie theaters, and it also raises the possibility of repeated rounds of stay-at-home orders.
This does not mean the public health orders are misplaced, just that expectations of a quick fix for the virus from stay-at-home orders may be disappointed. If the goal is to flatten the curve, it provides enormous benefits by preventing the hospital system from being overwhelmed. One observer claims we should learn to think of these public health orders as turning the virus tap on and off depending on how full our hospitals are. But expect the virus – and its damage to the economy -- to possibly linger for much of this year.
This does not mean the public health orders are misplaced, just that expectations of a quick fix for the virus from stay-at-home orders may be disappointed. If the goal is to flatten the curve, it provides enormous benefits by preventing the hospital system from being overwhelmed. One observer claims we should learn to think of these public health orders as turning the virus tap on and off depending on how full our hospitals are.7 But expect the virus – and its damage to the economy -- to possibly linger for much of this year.
The Oil War – And What Might Have Been
Once again, Houston faces the possibility of a prolonged period of low oil prices. This began as a dispute between Russia and Saudi Arabia over the proper price of oil that perversely turned into a fight over which country can best bear the burden of cheap oil. For Houston it simply adds to the economic damages already inflicted by COVID-19.
Before the arrival of COVID-19, our concern about the oil industry centered on a credit crunch. It seemed certain to lead to a shake-out of the weakest players in the fracking industry and a loss of local oil-related jobs. We had already revised the outlook for Houston down from 57,000 to 49,000 jobs for 2020 based on credit issues.8
Looking forward, we can put most of those credit concerns to one side. They still matter, of course, but they have been replaced by a drop in oil prices that has a similar effect on producer balance sheets, except it spreads the credit crunch from the weak to everyone. The quality of the balance sheet still matters, and low prices speed up the loss of weak companies, but every producer is now facing serious cash-flow problems.
In recent years OPEC and the Saudis learned some difficult lessons about oil prices and U.S. fracking. If they set the price much above $55 per barrel, U.S. producers quickly expanded production and stole OPEC’s market share. OPEC cannot set prices too low because they have national budget constraints. Even for the Saudis, a fall to $35 oil prices would create a 2020 budget deficit of perhaps 15-20 percent. The $55 range is comfortable for them.
The Russians in contrast wanted to repeat the oil-price experiment of 2015-16 when OPEC/Saudi withdrew as swing producer with a stated goal of damaging U.S fracking. The Russians see the Americans as vulnerable and want a prolonged period of oil priced at $40-$45 per barrel. Having failed badly in 2015-16, OPEC wants to avoid an expensive repeat of that experiment. The Russians claimed to be able to hold out for 10 years with oil at $25-30 per barrel, and the Saudis called their bluff. They raised exports to near 10 million barrels per day and have committed 12 million per day, if needed to keep oil prices near or below $30.
Just a couple of weeks ago, we had three scenarios. One was continued business as usual. Like the U.S. base economic forecast, it is no longer going to happen, but it can still serve as a marker for the extent of damage being done to the Houston economy by this turn of events. We simply assume oil stays at $55 per barrel going forward.
The best feasible outcome we called the Saudi Plan, and it assumed a quick end to the dispute at the June OPEC meeting. The cost of this oil war was high for all parties, but the Saudi’s seemed determined to make their point. The Russian Plan assumed eight quarters of oil priced at $40 per barrel designed to break the back of American fracking. Oil prices then recover to $60 per barrel.
But now, the Saudis and the Russians have been rendered irrelevant as the U.S. and European economies sink into a COVID-19-induced recession, and weak oil demand replaces any Saudi or Russian efforts to pull it down. The stay-home orders issued in numerous countries have simply made a bad situation worse. The world normally consumes 100 million barrels of oil per day, and it is thought that the current rate of oil consumption is about 75 million barrels. It is creating a tremendous short-term glut as storage fills, and the on-going recession extends low prices well into the future.
As this is written, there is talk of an emergency OPEC meeting to be held soon, but it seems unlikely that it can do more that raise oil prices off of a floor near $20 created by the Saudis and Russians. The most likely path forward looks like the Russian Plan – a long period of low oil prices -- but now with no need for Russian help. I have simply rebranded the Russian Plan as a Global Recession with the bottom line still being eight quarters of oil at $40 per barrel. Among our original three scenarios, this is the option that remains.
What do these low prices mean for Houston’s oil sector? Even though this drop in oil prices sounds like a rerun of 2015-16, it will lead to different outcomes for both American oil and Houston. Last time, an oil-price bubble burst and oil prices fell from $100 to $30 per barrel, the rig count fell from near 2000 to 404, and Houston lost 74,300 oil-related jobs. (See Figure 5.)
This time the industry is leaner. Of the 74,300 jobs lost to the last downturn only 20,300 or 27 percent returned after 2016. Oil prices will fall from $55 to $30 or$40; the rig count had already fallen in 2019 to 800 rigs because of the credit crunch; and Houston will stand to lose far fewer oil jobs at 10-12,000.
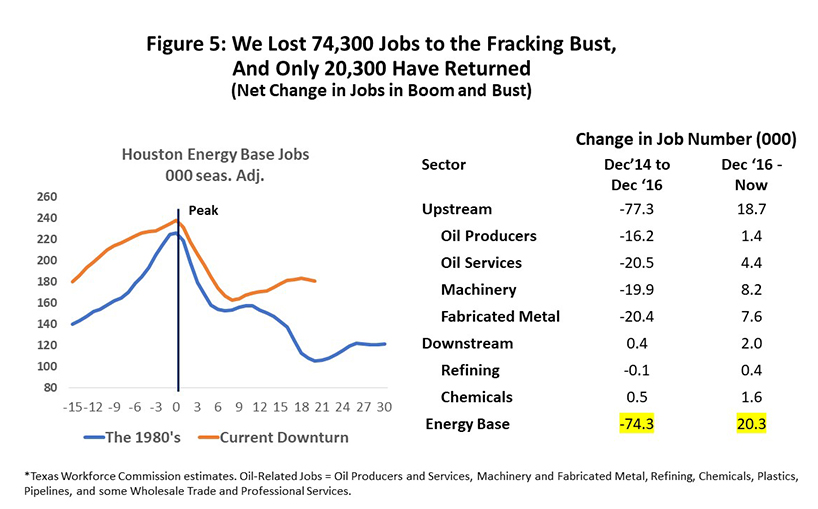
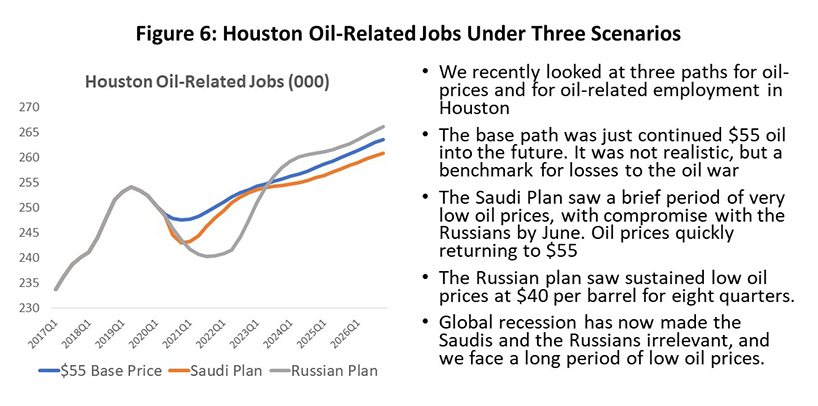
Figure 6 compares the path of local oil-related employment under three oil price scenarios. The Base Scenario would have entailed only modest continued oil losses in the wake of on-going credit problems. The short-term recovery envisioned by the Saudis was assumed to push the oil price back up to $55 by mid-year, allowing Houston to recover 10,600 oil-related jobs. The Saudi plan is also lost to COVID-19 and global recession. The Russian Plan/Global Recession forces 12,600 job cuts, and though it is not much deeper than the Saudi Plan, it is longer lasting. The Russian Plan/Global Recession also brings a big positive bounce in employment after the eight quarters of low prices have passed. This assumes that neither Russia nor the Global Recession are successful in irreparably damaging American fracking.
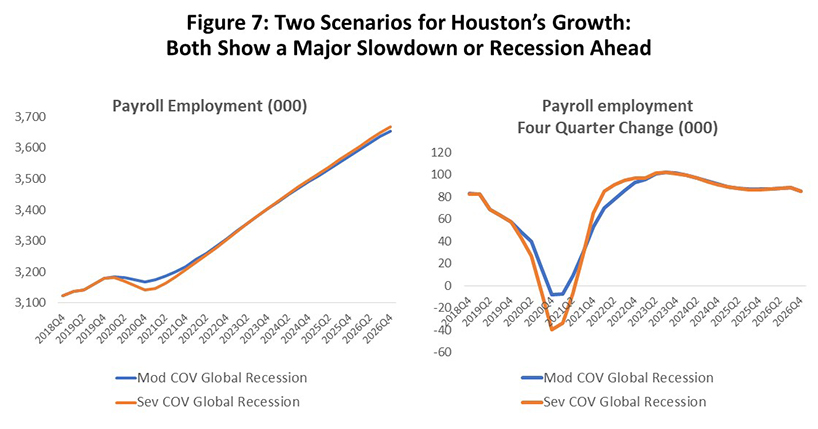
A month ago, we had nine scenarios for the near-term outlook that were quickly reduced to five,9 and now we have only two: the two CBO scenarios for the U.S. economy that describe a mild versus typical U.S. recession, with each combined with eight quarters of oil priced at $40 per barrel. The mild recession is reserved for our high forecast in the unlikely event the COVID-driven downturn proves milder than we expect.
But the basic outlook – our best guess – is for a typical U.S. recession and prolonged low oil prices. Even a moderate downturn in the U.S. economy in Figure 7 brings no growth to Houston in 2020 (a loss of -7,800 jobs), and a more serious U.S. recession means heavier losses (-39,100). And these business cycle and oil market losses are only a small part of the layoffs currently underway.
Social Distancing and Stay-Home Orders
We have accounted for how the COVID-19 virus affects the U.S. economy and oil markets, and how that in turn affects Houston. Key Houston industries rely on sales outside the region to grow – its economic base -- and falling activity throughout the rest of the country has brought the economic slowdown or reversal. Oil losses also are captured here.
However, there are specific disruptions to the local area that won’t get counted based only on events happening elsewhere. This damage mostly occurs in the non-basic or secondary parts of the economy like retail trade, bars and restaurants, hotels and accommodation, personal services, and entertainment. These sectors are dominated by small businesses with limited cash resources, and employee layoffs come quickly.
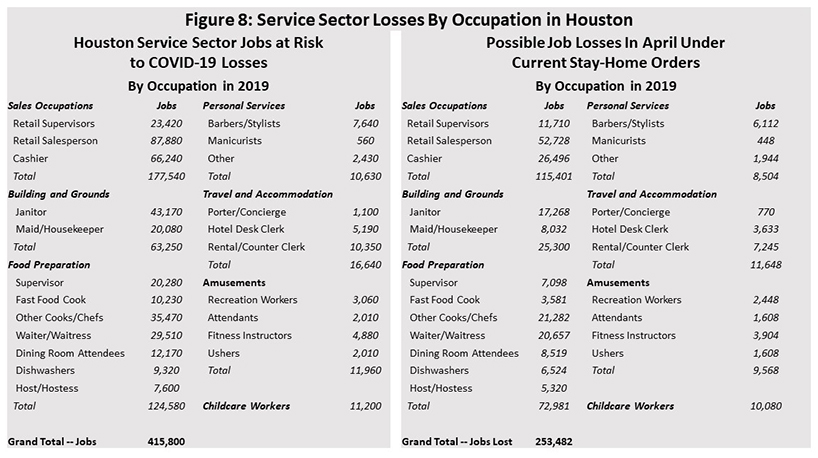
The current damage being done to the local economy is focused in services. Figure 8 shows Houston’s metro employment in categories selected as most at risk to COVID-19 layoffs. based on occupational groups such as retail salesperson, waiter or waitress, dishwasher, hair stylist, usher, etc. The left side of the table shows the number of jobs at risk in each category, with a grand total of 415,400 workers that could be affected by stay-at-home orders and social distancing.
How many actual job losses occur? Before I offer a rough and conservative guess, please understand that I don’t know. I applied to each category what seemed to me a conservative guess at what might happen in April: 40% of janitors are not working in April as many buildings are empty or see much less activity; 40 percent of maids and housekeepers are laid off; 60% of retail salespersons; 40 percent of cashiers even after allowing for service stations, grocery stores, and other essential retail still being open; and so on down the list. Losses are probably an even greater share of food service, recreation, and personal services. My guess is that losses might equal 253,000 across these at-risk categories or 61.0 percent.
These jobs include payroll jobs (most jobs in retail or food service, for example) and the self-employed (barbers and personal trainers), and together they make up about 4.0 million jobs in Houston. Our selected list of possible April service sector losses is about 6.3 percent of Houston’s total employment. No doubt there will be thousands of others affected that are not on this particular list.
We have discussed the possibility of continued public stay-at-home orders that might come-and-go throughout 2020. If there should be an unexpected magic bullet to cure or prevent the virus, we would see these massive job losses quickly disappear. The reality is likely to be slow and partial recovery as the virus recedes, with the public remaining quite wary of public interaction even if stay-home orders are lifted. The job situation will remain on a similar come-and-go basis until the virus is behind us and public confidence is restored.
These non-basic job losses in secondary sector simply add to the losses we have already calculated as damage done by the national recession. Unlike the base sectors that drive the economy, these service industries have few multipliers and losses do not spread far through the rest of the economy.
What happens from here forward? These job losses result from public health decisions made in response to a virus and as an effort to contain it. They are not driven by fundamental economic conditions. Let’s use a fictional story about what might happen in coming months to illustrate the size and timing of job losses. It also makes clear why we can’t know what the near-tern future holds.10
The U.S. economy falls into a typical U.S. recession in 2020, and additional heavy oil losses result in 39,100 local jobs lost in 2020. We also know that Houston will see stay-at-home orders in place through April, and we further suppose they remain through the first ten days of May. They are then lifted, but the public is still wary of retail shopping, restaurants, gyms, and only 60 percent of the 253,000 jobs lost in April are called back to work. The stay-at-home orders return to Houston for the last time at the end of June and early July before again being lifted. But a wary public continues social distancing with only 60 percent of the lost service jobs restored in August, slowly rising each month to 70, 80, 90 and 100 percent from September to December.
The implications of this example for employment are shown in Figure 9. Job losses are on a quarterly basis with the figure on the left showing changes in total payroll employment. The blue line counts only losses to national recession and the red line combines losses to recession, stay-home mandates and social distancing. The figure on the right shows four-quarter changes in employment after accounting for all sources of job loss.
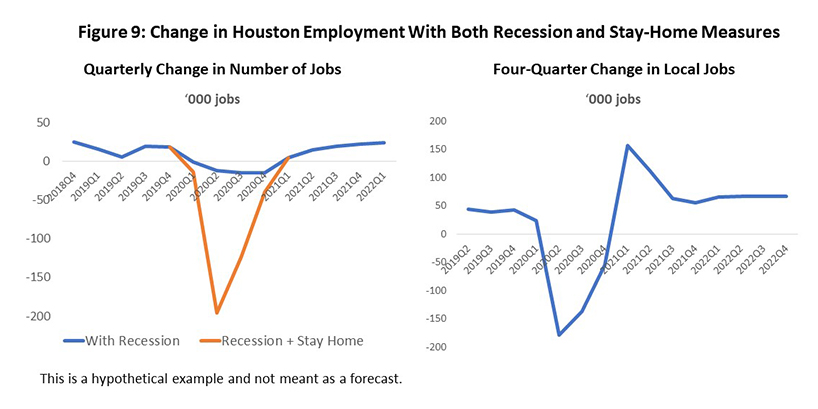
Losses are at their worst in the second quarter with -196,000 jobs, followed by -124,000 in the third and -40,000 in the fourth. All losses to recession, stay-home, and social distancing are gone by 2020Q1. The four-quarter changes illustrate the big bounce back in the second half of this year. On an annual basis for 2020, the four-quarter change is -64,100, with -39,100 being recession and 25,000 caused by social distancing that is slowly fading by that time.
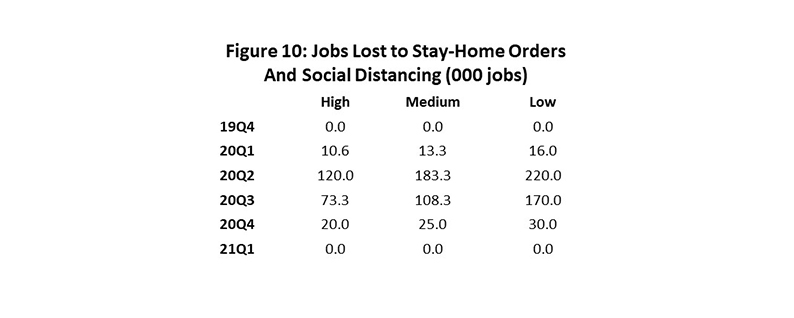
Figure 10 gives us some idea of the sensitivity of the assumptions, showing the losses to stay-home orders and social distancing under different conditions. The medium scenario is based on the assumptions we made above. The high scenario assumes that only 200,000 jobs are lost in the service sector, and that stay-home requirements are only enforced in late March and April. In the low case, 300,000 service sector jobs are lost, and the late June/early July stay-home requirement is extended to all of July. The same social distancing pattern is used in all cases. The heaviest job losses come in the second quarter in each case, although the low scenario shows a third quarter that does not lag far behind. All examples see these service sector losses rapidly fade in 2020Q4 and disappear by early 2021.
Labor Losses and Supply Disruptions
In past epidemics, widespread illness and labor shortages have been the leading edge of any economic setback. We discussed earlier in the report how a 30 percent case infection rate would remove an average of 74,000 workers from the labor force each week or 2.4 percent of the workforce each week and across the six months of the epidemic, but in peak weeks that might become two or three times higher.
Just as flattening the curve slows and reduces the number of patients flowing through the hospital system, it should also make these labor shortages more manageable. The high economic cost of containment through stay-home orders is paid back to some extent through reduced peak labor losses. However, the potential remains for such losses to be significant. The Chinese efforts to contain COVID-19 greatly disrupted their manufacturing and jolted supply chains around the world. The March manufacturing report from the Institute for Supply Management foreshadows potential disruption in the U.S.11
About 75 percent of Americans have some form of leave to carry them through this kind of illness, meaning they won’t necessarily lose their jobs. Even for if the worst happens in terms of case infections, and there were roughly 18,500 weekly infections that are not covered by insurance, everyone will not fall off the payroll. Some could be counted as having reduced hours on a monthly time sheet, and many employers may be willing to help carry good employees through a short-term illness. But if you must guess, at worst we might be adding another steady 5-10,000 job losses to the monthly total.
Summary and Conclusions on the Economy
Our story is one of moderate recession in Houston that will feel much worse as we pass through it. With the public health officials directing efforts to protect the community from illness and death, we will see large, unpredictable short-term swings in employment and general business activity. Despite falling into a moderate recession in 2020, Houston’s job losses will be dominated in some months by stay-home orders and social distancing. Losses will conservatively exceed 250,000 in April, for example, with these losses slowly fall back through this year as stay-home orders as public wariness about the virus keep unemployment high.
By the fourth quarter, we will mostly be seeing the hangover from the virus as the recession bottoms out and as both social distancing and labor force losses to illness slowly fade away. Based on our illustrative examples, the fourth quarter of 2020 compared to the fourth quarter of 2019 means the loss of perhaps 71,600 jobs, with 39,100 to recession, 25,000 to social distancing, and 7,500 to illness. The numbers are of course much higher in the second and third quarter.
These job losses are not a forecast, but an example of what we might expect and why they may be very big. It is the virus and public health mandates to contain it that drive the timing and magnitude of the largest job losses, with economic fundamentals largely left irrelevant through much of 2020. We simply still cannot know how the crisis unfolds in the coming few months.
As the virus recedes, we assume all of this turns around by early 2021. There are no more workers out sick and fear of the virus ends. Economic damage from COVID-19 has been reversed by year-end, and the economy is roaring back by late 2020 or early 2021. But we are talking about recovery that comes after months of limited, on-and-off activity by thousands of small businesses that rely heavily on cash flow to pay rent and survive. There are estimates that a quarter of Houston’s restaurants could permanently close, for example. The trickle-down effect on landlords, building owners, and financial institutions is already creating significant concerns.
COVID-19 provides probably the best case in history for helicopter money from the Federal Reserve and Congress. Survival of many of these small service businesses and their employees may depend heavily on the effectiveness of the $2 trillion federal relief package. The dollar value in payments and loans is roughly equal to two months of GDP, a good start in terms of recognizing the size of the problem we face. But can it be timely enough in implementation?
Written by:
Robert W. Gilmer, Ph.D.
Institute for Regional Forecasting
April 8, 2020
Notes
1The previous report was R.W. Gilmer, “Houston’s Economic Outlook Reshaped by COVID-19 and the Oil Price War,” Institute for Regional Forecasting, University of Houston, March 22,2020
2The U.S. mortality rate was 2.7 percent on April according to the World Health Organization, Current Situation Report 77.
3“Why Are COVID-19 Death Rates So Hard to Calculate? Experts Weigh In,” Medical News Today, March 5, 2020 https://www.bauer.uh.edu/centers/irf/houston-updates.php
4Congressional Budget Office, A Potential Influenza Epidemic: Possible Macroeconomic Effects and Policy Issues, revised report July 22, 2006. https://www.cbo.gov/sites/default/files/109th-congress-2005-2006/reports/12-08-birdflu.pdf; also see Jon-Wha Lee and Warwick J. McKibbin, “Globalization and Disease: The Case of SARS,” Brookings Discussion Papers on International Economics, No. 156, February 2004 and Alexandra A. Sidorenko and Warwick J. McKibbin, “A Potential Influenza Epidemic: Possible Macroeconomic Effects and Policy Issues,” Centre for Applied macroeconomic Analysis, Australian National University, February 2006.
5Federal Reserve Bank of Philadelphia, Survey of Professional Forecasters, February 14, 2020.
6The picture is not as sanguine once lower oil prices are added, and the current OPEC/Russia dispute aside, the price of oil almost always falls with a national or global recession. Houston typically gets a double-blow from the national downturn and the price of oil Despite this, even counting the oil price fall, Houston’s recessions are typically milder. We grow faster than elsewhere, drawing on lower home prices, lower taxes, and less regulation.
7Letter to the Editor, “Should You Get COVID-19,” Wall Street Journal, April 1, 2020.
8The reference in note 1 contains a long discussion on the oil-industry’s recent credit problems.
9See the reference in note 1 above for the nine scenarios.
10To simplify matters each month had three 10-day periods, we ignored the niceties of whether we count payroll jobs or the self-employed, we ignore the monthly timing of statistical surveys, and put aside many similar details.
11Institute for Supply Management, Report on Business, March, 2020 https://www.instituteforsupplymanagement.org/ISMReport/MfgROB.cfm?SSO=1