Houston Updates
-
Archive
- June 2025
- March 2025
- December 10, 2024
- September 14, 2024
- May 21, 2024
- March 19, 2024
- December 9, 2023
- June 16, 2023
- April 6, 2023
- March 17, 2023
- Dec. 19, 2022
- Sept. 14, 2022
- July 4, 2022
- March 27, 2022
- March 9, 2022
- September 2021
- April 2021
- March 2021
- September 2020
- August 2020
- June 2020
- April 2020
- March 2020
- January 2020
- December 2018
- June 2018
- March 2018
- February 2018
- January 2018
- September 2017
- September 2017 Post-Hurricane
- June 2017
- March 2017
- January 2017
- September 2016
- March 2016
- December 2015
- September 2015
- June 2015
- March 2015
- December 2014
- June 2014
- March 2014
- November 2013
- September 2013
Houston Returns to Normal Growth With the Pandemic Behind Us
July 4, 2022
The broad economic picture is changing in Houston and elsewhere. An Omicron variant that proved highly contagious but milder and less deadly than earlier strains has left the public weary of pandemic news. Economic concerns have shifted from the pandemic recovery and are increasingly dominated by sharply rising inflation. Rising prices were led first COVID restrictions combined with an over-heated economy that brought supply chain shortages and delivery bottlenecks, and then further fed this year by the war in Ukraine and sharply higher fuel and food prices.
The outbreak of inflation saw consumer prices surge 6.9 percent in 2021 and continue to higher levels near eight percent this year. Inflation is, at least partly the outcome of the massive stimulus that arrived just as the vaccines became effective, allowing the public to engage in normal economic activities again. Further, the global economy – where only two-thirds of the population is vaccinated – is still subject to COVID-driven labor and material shortages that worked to raise the availability and prices of goods. Witness the recent lockdowns in China, for example.
Economic growth will slow this year as the Houston metro area adds 71,500 payroll jobs, a significant slowdown from the 167,600 added in 2021. A variety of factors contribute this slowdown, but job current growth remains healthy and above historical trends.
- In April, Houston finally returned all of the 361,500 jobs lost to the COVID outbreak/lockdown period of early 2020. Recovery from recession is by far the easiest part of the growth cycle as labor and capital are in already place and can quickly return to work. As we now return to the 2020 starting point for a normal expansion, economic growth inevitably slows and becomes more difficult.
- As pandemic concerns end, so does the need for fiscal stimulus. COVID fiscal stimulus is now depleted and substantially behind us. Retail and other spending remains robust, however, as perhaps $2.3 trillion in stimulus-driven excess savings remains in place to support the consumer. However, inflation and rising interest rates are rapidly eating into this reserve, and this excess should disappear by year-end or soon after.
- Past stimulus and excess savings have left some local service sectors living at levels of activity that exceed normal growth – retail sales, health care, and food service, for example – and their employment growth will slow and even modestly reverse in the months of ahead. In contrast to these inherently local activities just mentioned, Houston’s growth in 2022 will be led by a robust business cycle and by Houston’s ability to sell its goods and services to the rest of the state and the world. Oil still plays a big role, but so do many other local sectors that sell goods and services outside the region.
- The Federal Reserve is rapidly moving to raise interest rates. Having arrived late to the inflation problem, the Fed is now working quickly and forcefully to slow inflation to its normal two-percent target range. The central bank freely admits that it will risk recession before allowing price expectations to become unanchored from that two-percent target. Meanwhile, growth in 2022-23 is inevitably slowed by higher interest rates, even if recession can be successfully avoided.
- Oil should make a solid contribution to local payrolls this year, although any excitement about $100 oil should be quickly set aside. After a decade of bad investments and repeated bankruptcy, investors will not allow the fracking industry to again chase projects and production based on unsustainably high oil prices. The $100 oil revenues will be used for projects and production that make sense at perhaps $65/barrel, and to fortify industry balance sheets or reward investors through dividends.
The Consumer Was Central to the COVID Economy
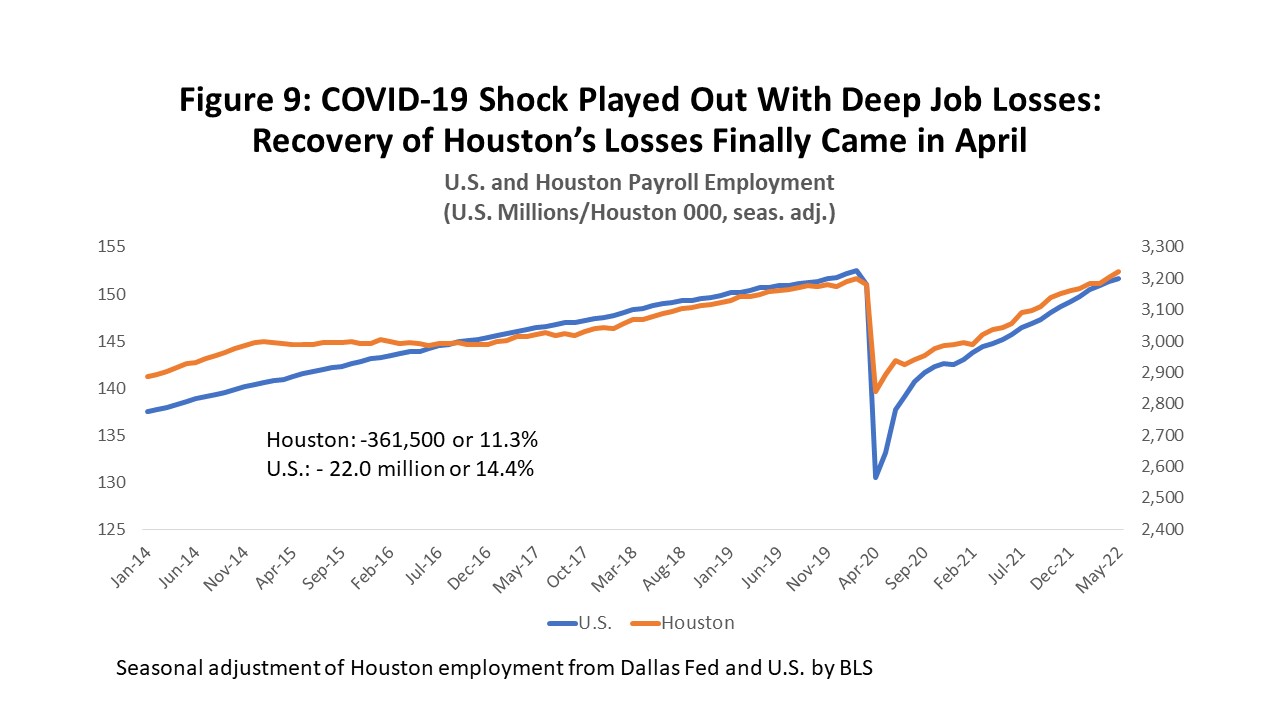
The COVID outbreak, the resulting consumer fear, and the additional restrictions imposed by public health authorities all combined to generate a massive negative shock to the economy. In March and April of early 2020, Houston lost 361,500 jobs or 11.3 percent of payroll employment.
This was almost immediately matched by Congress with a huge positive shock: $2.5 trillion in stimulus comprised mostly of direct economic impact payment, paycheck protection loans, and expanded unemployment compensation. Most of this was designed to provide financial aid to the individual household, and it was repeated with another $2.5 trillion in late 2020 and early 2021.
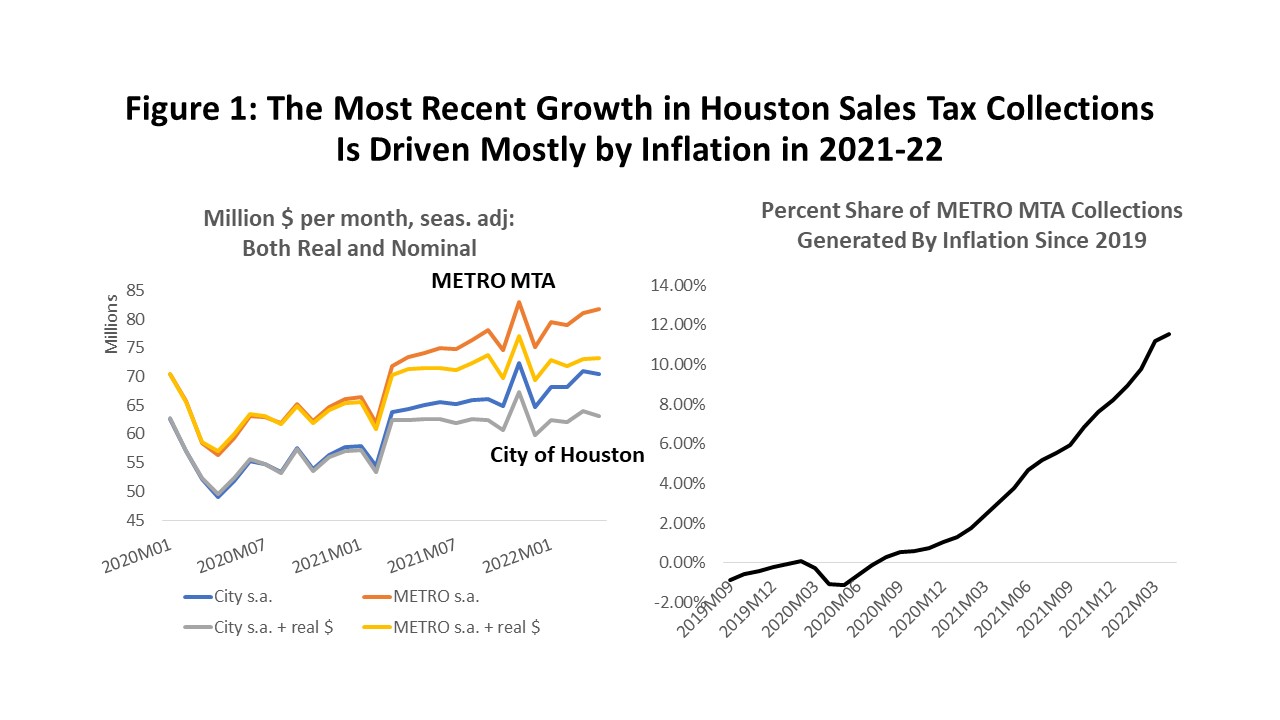
As the pandemic ends and payroll employment returns to pre-COVID levels, we are left watching how this pair of negative/positive shocks will finally play out in the local economy, and consumer spending has become central to this end-game. For example, in Figure 1 high levels of sales tax collections continue in the most recent METRO MTA and City of Houston revenues, as each entity piggybacked on the state sales tax with its additional one-percent tax rate.
This post-COVID history of sales tax collections in Figure 1 is shown in both current and inflation-adjusted dollars. They are based on the date of the sale or economic event that triggered the tax.1 Before COVID, METRO collections in 2019 had been trending upward at nearly $66 million per month, only to fall back to $56 million in the April lockdown.
Collections then stabilized and improved, but significant recovery does not come until March 2021, as fundamental factors took control of the outlook: vaccines became widely available that spring, Texas dropped many public health restrictions such as its statewide mask mandate and occupancy restrictions, and a second and third round of fiscal stimulus provided the public with a much-enhanced capacity to spend.
After March 2021, inflation-adjusted collections earned by METRO jumped by $5.1 million per month or 7.6 Percent above 2019 Pre-COVID levels, and they remain near those highs through the most recent data. This is despite the fact that Houston’s economy continued to struggle until this past April to return to 2020 pre-COVID levels of employment. This high level of local spending must at least partly reflects the effect of the second and third round of stimulus payments in late 2020 and early 2021.
How do spending and collections stay high with the stimulus now largely depleted? Households still hold as much of $2.3 trillion in liquid savings, investments in stock and real estate, and other assets generated by the stimulus that continue to prop up spending figures, although rising inflation, a slowing economy, and continued spending are now set to rapidly pull down this cash surplus. Expect a return of inflation-adjusted collections to normal trend growth in coming months.
The End of COVID Stimulus
Fiscal stimulus was an enormous injection of cash into the economy that is now mostly ended, and it must soon be replaced by local economic growth. The stimulus came in two waves of about $2.5 trillion dollars each, first in early 2020 during the lockdown period, then followed by two more rounds in late 2020 and early 2021 that again totaled $2.5 trillion. Two and a half trillion dollars was about $16,800 per U.S. household in 2020, and each round saw about half of this cash flow directly or indirectly -- but quickly -- into the bank accounts of individuals and businesses through economic impact payments, the paycheck protection program, and enhanced unemployment checks.
In Figure 2 the blue line shows the pandemic-period track of total personal income (including stimulus) and the red line is the wages, salaries, and income of the self-employed (no stimulus). Each point compares these measures to pre-pandemic levels in February 2020. The initial round of stimulus came against a backdrop of consumer shock and lockdowns, and a ten percent drop in early wages and salaries that was immediately matched by ten percent jump in personal income via stimulus. These cash payments appeared to quickly right the economic ship by mid-year by offsetting wage losses and delivering record levels of income. Pre-pandemic levels of wages and salaries were fully restored by November 2020.
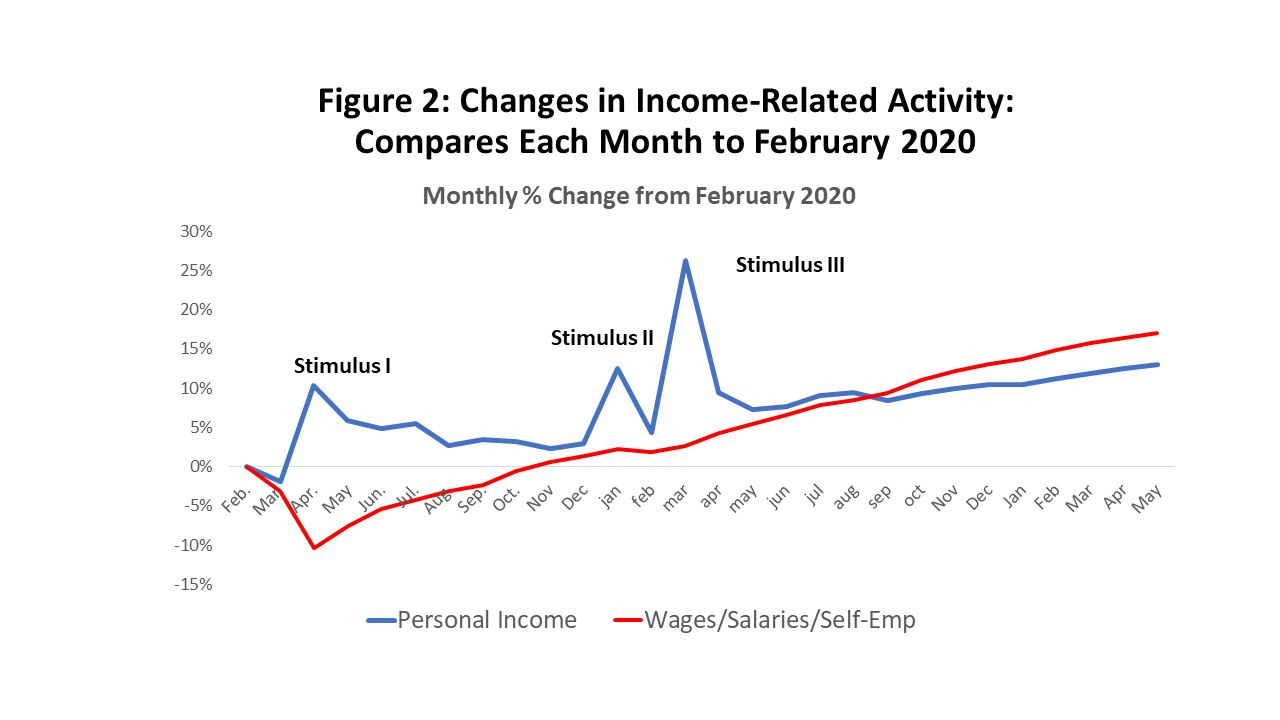
The lockdown month of March 2020 was the only month that U.S. personal income fell below pre-pandemic levels, telling us that consumers have had the wherewithal to spend if they chose to do so. In fact, collectively at least, Americans were never before been so well off financially as during the pandemic.
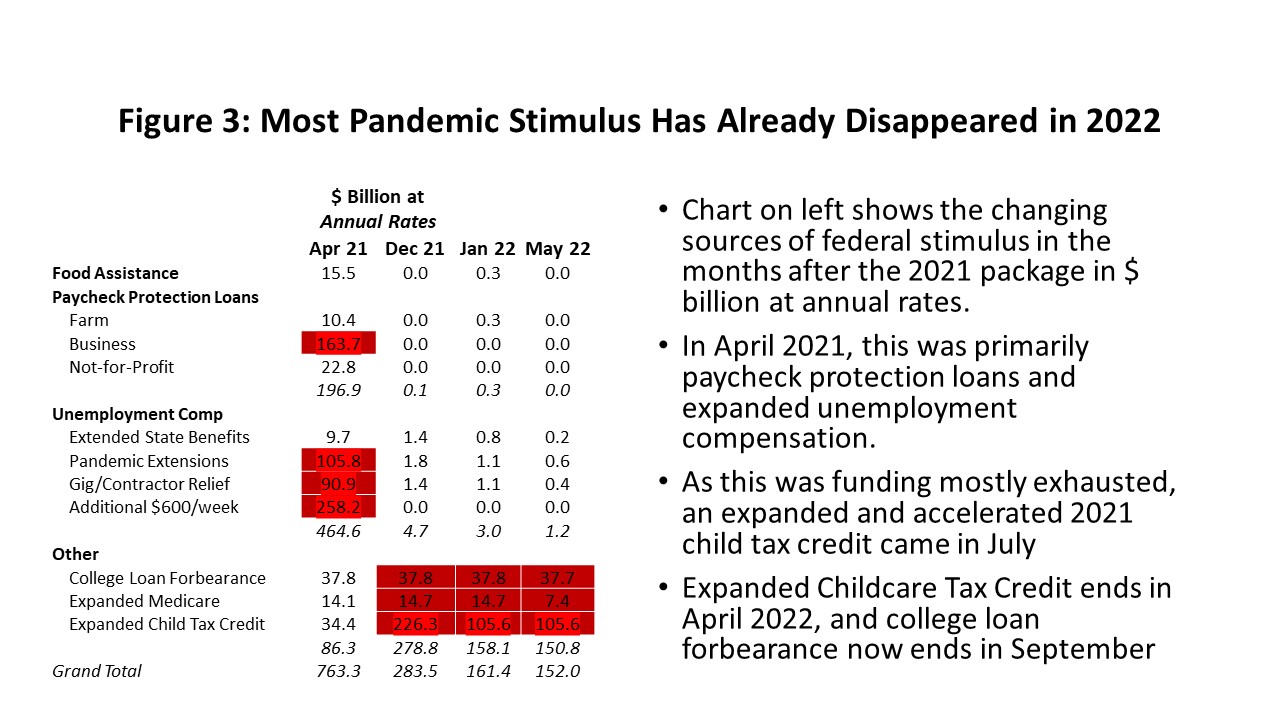
Figure 3 shows how the stimulus has slowly disappeared over the last year. The first column for April 2021 is just after the final round of stimulus and impact payments, and it shows that the paycheck protection program and enhanced unemployment compensation programs dominated spending, running at a monthly $763.3 billion measured at annual rates. Almost all of these programs ended last fall, and by May fiscal spending was only $152.0 billion at annual rates, mostly via expanded Medicare, college loan forbearance, and a new enhanced child tax credit that came in July 2021. The tax credit should rapidly disappear as income taxes are filed this year, and the other programs close this fall.
How will the Houston and U.S. and Economy Replace the Stimulus?
The stimulus payments had a big impact on spending in Houston and the U.S. Figure 4 shows the obvious timing of a jump in U.S. retail sales following each round of fiscal help; first, returning retail activity to pre-pandemic levels by June 2020, followed by the sharp pick up in spending that comes in March 2021 and continued through this year.
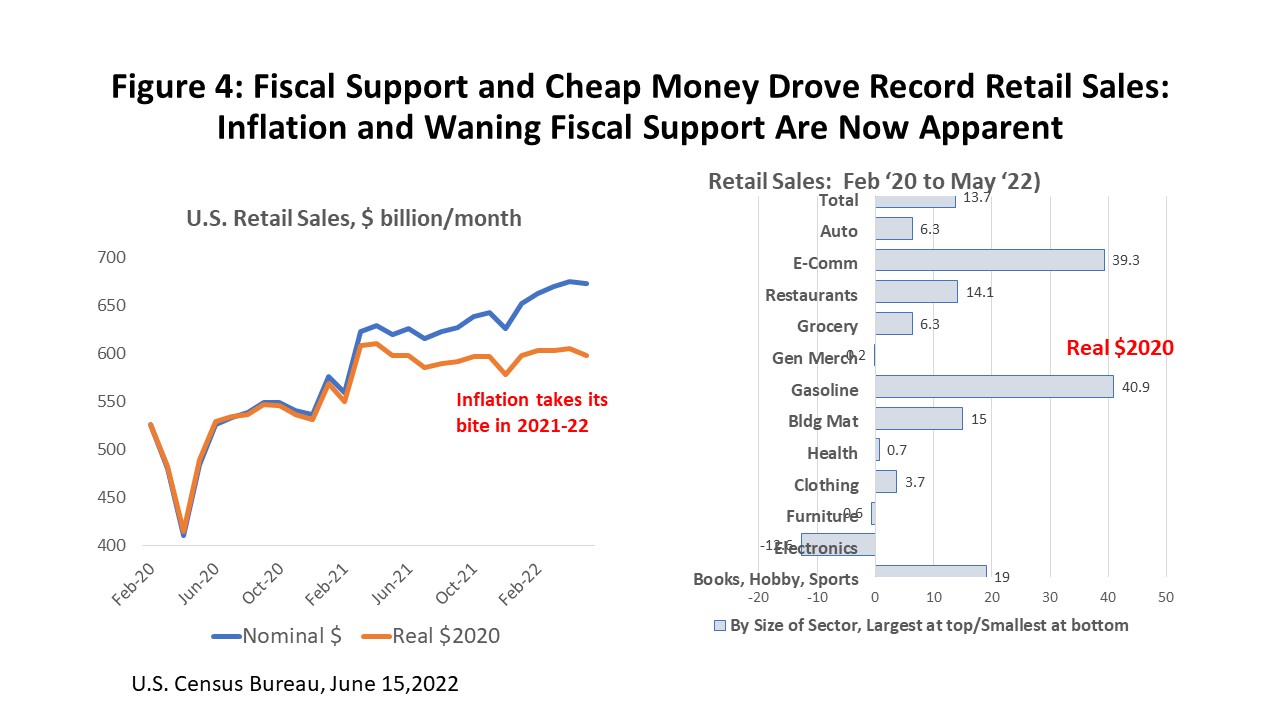
If we were to look back to the peak of the pandemic by individual retail sector, the right side of Figure 4 would have shown a distinctive COVID-related pattern marked by large declines in food service, clothing, and gasoline, along with large historic gains in e-commerce as social distancing prevailed. The gains in remote purchases have continued, but otherwise a more normal pattern of spending by sector is seen today that has been restored by vaccination and the retreat of the COVID virus.
Figure 2 also illustrates how the economy is now expanding on its own. The red line for wages and salaries has been growing rapidly since late 2020 and now stands 17.0 percent above pre-COVID levels. The blue personal income line has been steadily slowing as the stimulus recedes, although it is still being carried nicely by wages and salary growth and remains 13.0 percent above pre-COVID levels.
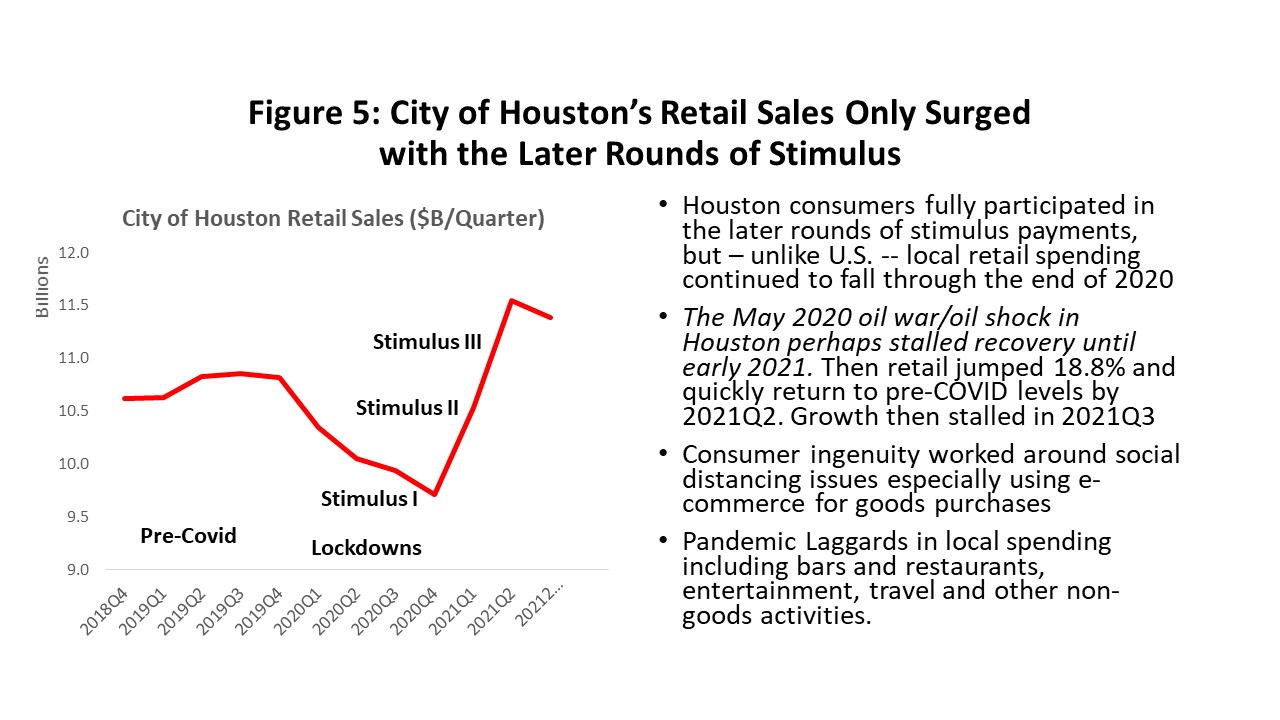
There is no reason why Houston should not have participated fully in the federal stimulus payments, and participation is fully reflected in local retail sales. The taxable retail sales data in Figure 5 (as opposed to reported sales tax collections) comes from the Texas Comptroller with a substantial delay and is currently available only through 2021Q3. This data (like the tax collections) shows Houston’s retail sector recovered later and more slowly than the U.S., and it took until 2021Q2 before it surged back to pre-COVID levels and well beyond. The delayed recovery in Houston was likely collateral damage from Saudi-Russia Oil War in May 2020.
Local big-ticket items strongly benefitted. Auto and truck sales closely tracked the COVID pattern of lockdown decline followed by two rounds of stimulus-driven spending, and sales currently are below pre-COVID levels but only because of a shortage of chips and other parts to manufacture autos. Also, the price of the typical truck and auto in Houston has risen to near $50,000 per unit.
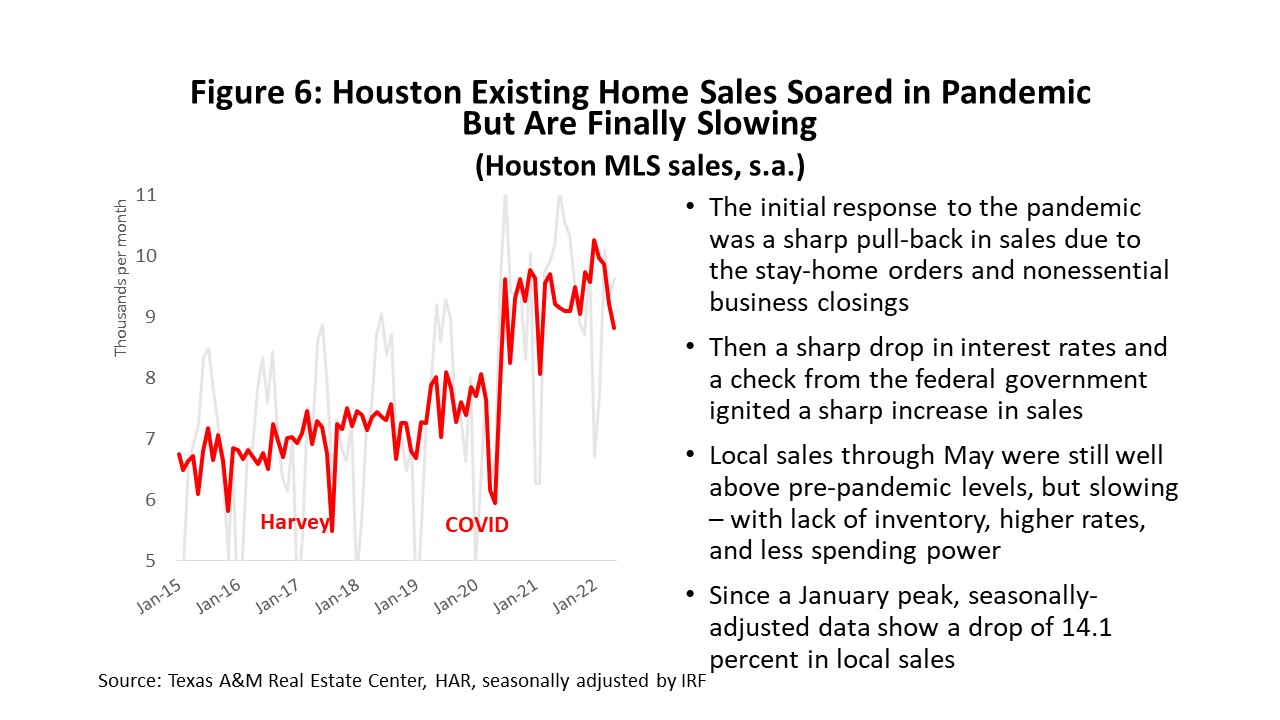
Houston existing home sales followed the COVID pattern and post-lockdown sales have remained at a steady 20 percent or more above pre-pandemic levels. (Figure 6) This was driven by fiscal help on a down payment, low interest rates, and a need for more room in the house as families work and learn from home. The median price of a typical existing home has soared past $300,000.
Seasonally-adjusted data since last January show emerging weakness in housing, as sales have dropped 14.1 percent from post-pandemic highs. Sales remain strong but reflect recent economic uncertainty and sharply rising mortgage rates.
The End of Excess Savings and the Near-Term Future of Consumer Spending
Consumer spending is artificially high. Today’s U.S. retail sales are 28.0 percent above pre-pandemic levels in current dollars and 13.7 percent above in inflation-adjusted dollars. Real retail spending in Houston is running 6.8 percent above pre-pandemic levels. This is at a time when both Houston and U.S. payroll employment were struggling to return to pre-pandemic highs.
With stimulus largely gone, it is accumulated savings that now prop spending up at high levels, but these savings are likely to soon be depleted. The definition of saving in the national income accounts is simply after-tax income minus outlays for goods and services. This accumulation of funds can be used to pay down debt, pad highly liquid checking, savings, and money market funds, invest in securities like stocks and bonds, or to invest in real estate. Particularly high levels of the most liquid funds were held during the early phases of the pandemic because of uncertain financial markets and zero interest rates that offer few safe alternatives. Much saving remains highly liquid.2
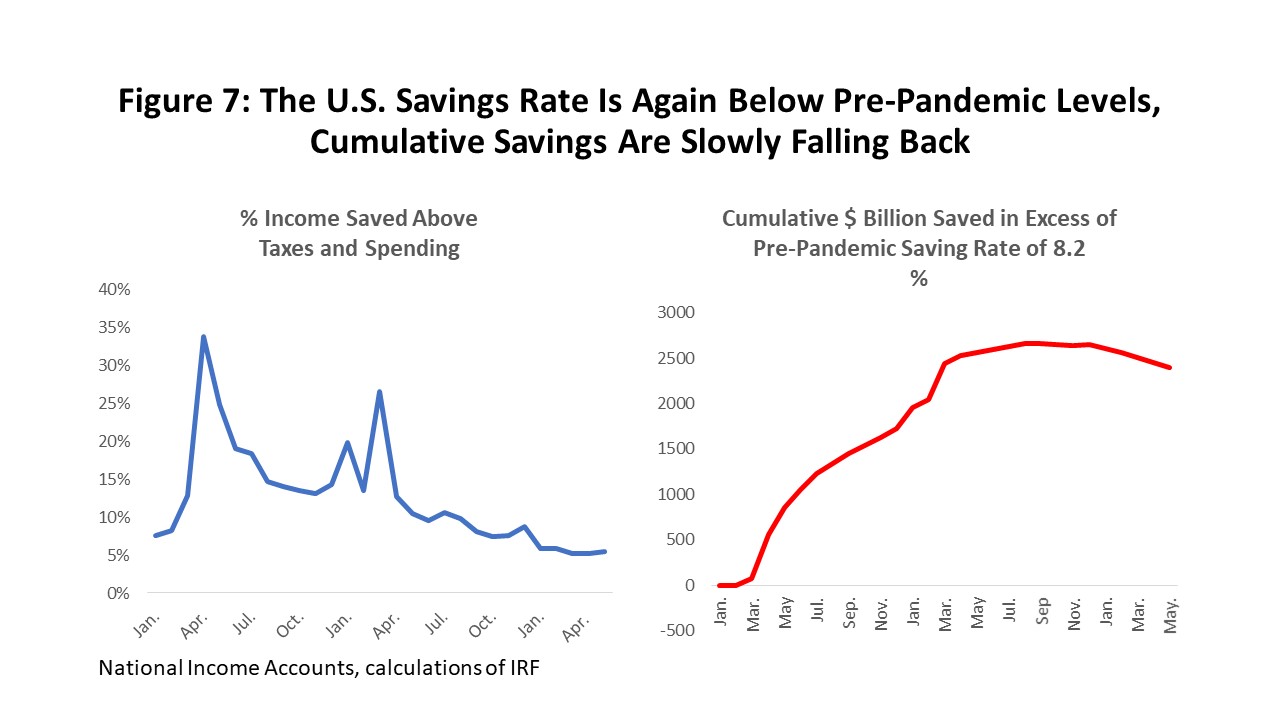
Figure 7 shows the accumulation of funds during the pandemic that exceed a relatively high pre-pandemic rate savings rate of 8.2 percent. The accumulation of excess savings reached nearly $2.6 trillion in the fall of last year and has begun to decline slowly. The rate of decline is expected to accelerate rapidly because inflation is running faster than paychecks, monthly payments like gasoline, grocery bills, and utilities increasingly must be met out of savings, and rising interest rates force credit card and mortgage payments higher. The current savings rate has already fallen to 5.4 percent or below the pre-pandemic 8.2 percent.
The advice of one recent Wells Fargo report is for consumers to enjoy the surplus while they can – but to know that gravity always wins.3 When will the surplus be exhausted? How fast does the decline happen? We don’t know. There is no precedent, the division of liquid and illiquid consumer savings is not clear, and we don’t how affluent consumers react versus the bottom of the income scale.
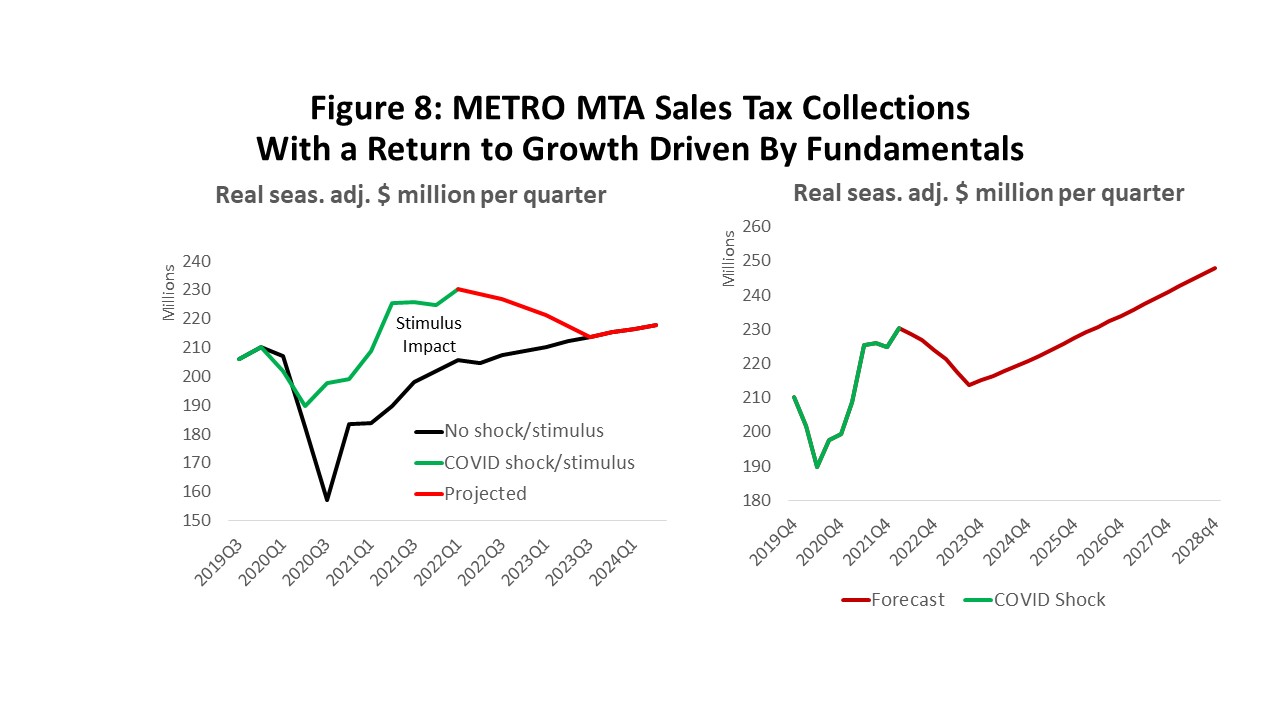
Figure 8 shows the assumptions we have made about this coming loss of support from savings and the resulting correction – for example -- to METRO MTA sales tax collections. The green line is a history of METRO’s pandemic-elevated collections in real dollars through 2022Q1. The black line is a “what-if” description of how Houston would have behaved since 2020 if there had been no pandemic, no economic shock, and no stimulus payments – but only a moderate to serious U.S. recession and a short setback in oil markets. The difference between the lines is the net impact of pandemic plus stimulus on local sales tax.
How do these two lines meet up once the pandemic is over and growth fundamentals once more rule the economic outlook? Once COVID shock and stimulus have disappeared from the forecast, we return to the red line that is a steady U.S. economic recovery from a combined moderate recession and oil price decline. Importantly, this is something we know how to forecast. In this moderate forecast, where we also assume $65 oil for the foreseeable future, the result is that inflation-adjusted collections fall back steadily until the middle of 2023. They ultimately fall by $17.0 million over five quarters or 7.4% before turning up again, finally driven by growth that again reflects Houston’s underlying economic fundamentals.
Much of this near-term decline in METRO’s inflation-adjusted revenues will be disguised by the nominal figures we will see reported by the Comptroller, but the high levels of inflation that deliver these bigger numbers make the outlook no less painful.
The Houston Economy in the Pandemic
Houston’s COVID recovery brings very good news, although it accompanied by significant on-going and some new economic concerns. Certainly, the good news is that in April of this year the Houston metro area added back all of the jobs lost to COVID since the April 2020 lockdowns. U.S. payrolls still trail the lockdown period, however, but have now added back 96.3 percent of job losses. The recovery in both cases gained momentum in spring 2021 as vaccines became widely available, as many COVID restrictions were dropped, and with the extra spending induced by the second and third round of stimulus.
The COVID emergency has become less pressing, but some economic hangover lingers. Although Texas has led the nation in job gains, Houston’s recovery leaves it as a serious laggard among the state’s major metro areas. This can be mostly attributed to poor performance by the oil sector, even with oil priced at $120 per barrel.
Houston’s payroll employment losses and recoveries are shown in Figure 9, with a lockdown decline of 361,500 jobs or 11.3 percent. This compares to 22.0 million U.S. jobs lost or 14.4 percent. Houston’s decline was smaller thanks to a less restrictive lockdown policy in Texas, and the stronger initial U.S. recovery was a strong bounce back as heavier COVID sanctions were lifted. By this April, recently re-benchmarked and revised employment data showed that Houston has added back all of the lockdown losses, and now stands at 106.3%, i.e., all of the jobs are back plus 6.3%. The U.S. has added back 20.8 million or 96.3%.
The differing stringency of lockdown periods complicates comparisons of the U.S. and Houston recovery, as the U.S. has brought jobs back at a faster rate but from a lower level. Comparison to other Texas metros is much clearer in the sense that we had the same public health and lockdown rules imposed across the state. Figure 10 shows COVID lockdown period losses and recoveries through this May for other major Texas metro areas. Austin has recovered 163.2% of losses or all the losses plus 63.2% more. Dallas stands at 168.0% of jobs returned, Fort Worth at 119.1%, and San Antonio at 108.3%. The statewide recoveries are at 126.5%.
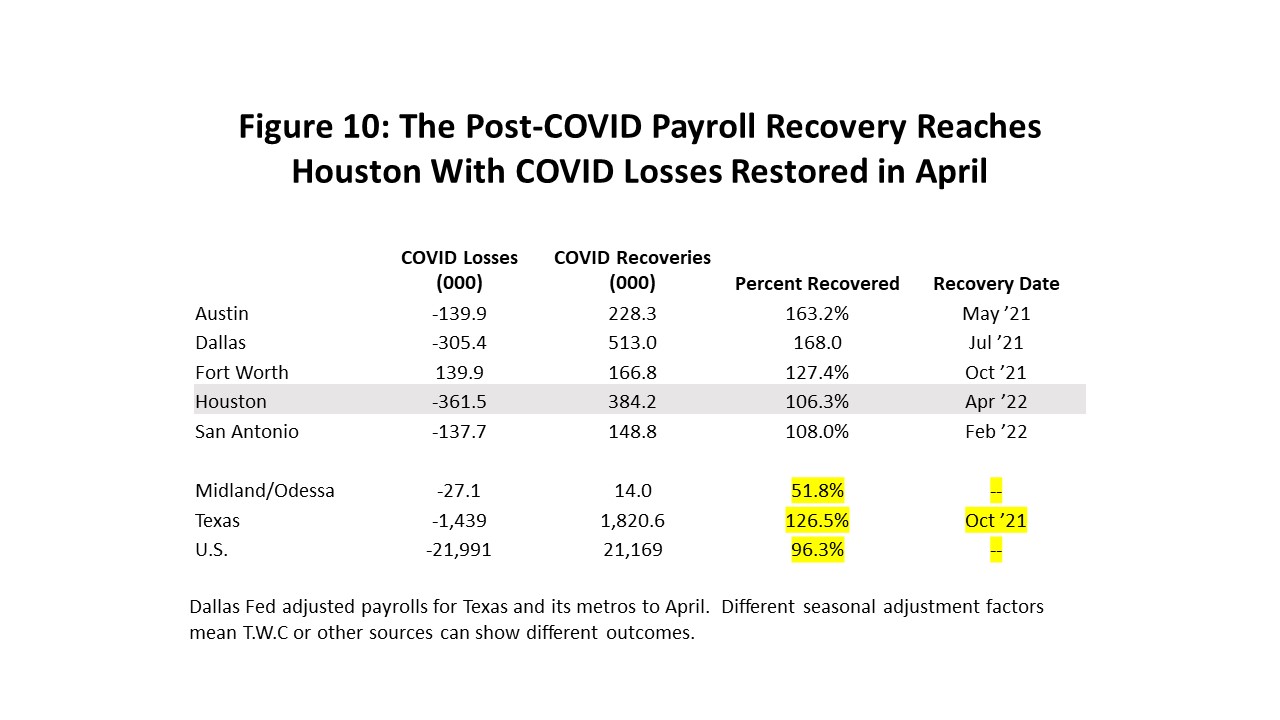
Note that Midland/Odessa have added back only 14,000 jobs since the lockdown or 51.8 percent. This is the heart of the state’s oil production region, and these cities -- like Houston – are highly dependent on oil-related jobs. This strongly infers that Houston’s relatively slow performance is centered in its large oil sector.
How did the vaccine play into the broader economy? The immediate, huge job loss to lockdowns was led by jobs in sectors sensitive to close contact, social distancing, or heavily affected by COVID public health regulation. Nine local sectors are listed in Figure 11 that are sensitive to such contact (bars and restaurants, health care, retail sales, etc.), and which together made up 41.9 percent of all Houston employment in 2019. They are important because they also collectively accounted for 67.2% of the lockdown-period job losses.
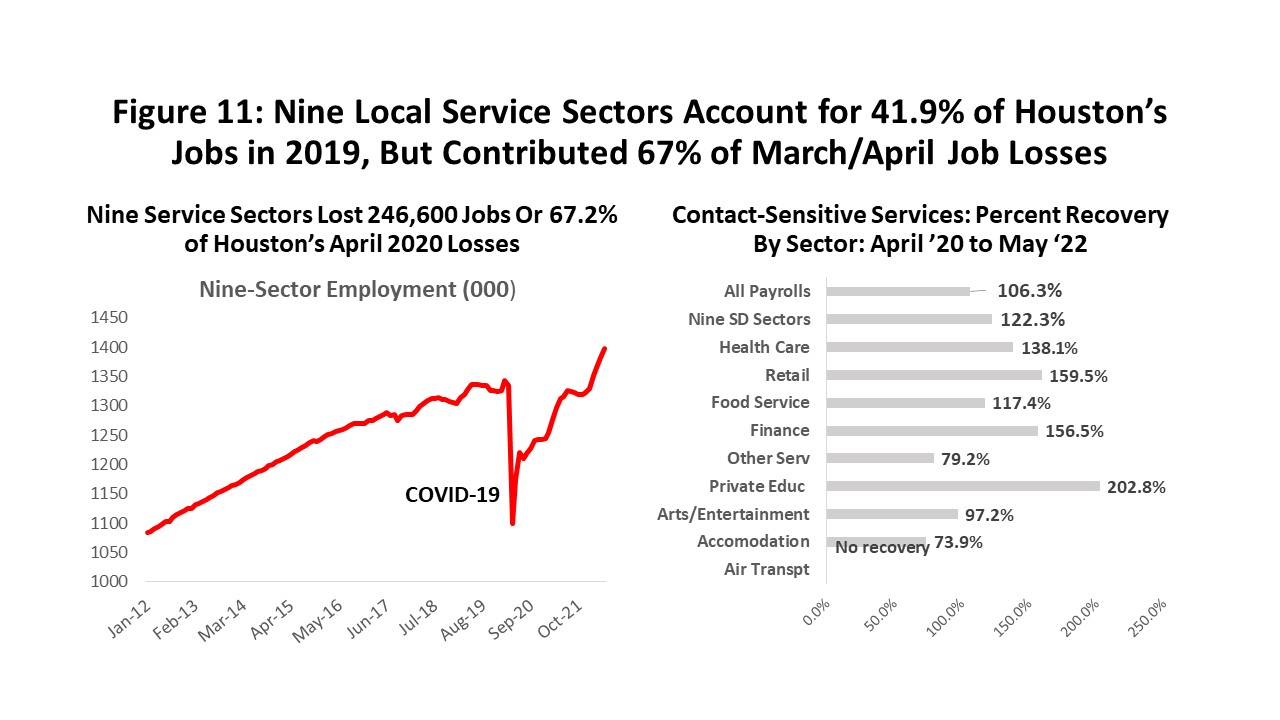
The key point about the vaccines is that they led a strong surge in contact-sensitive jobs as the public became more comfortable with public settings. We see that by this May, all of the lockdown losses in these nine COVID-sensitive sectors were restored plus another 22.3%. Compared this to 106.3 percent of total Houston payrolls. COVID damages tied immediately to the virus and many public health regulations have been reversed by vaccines on a sector-by-sector basis. The three largest of these sectors – health care, retail, and food service – also have high recovery rates at 138.1, 159.5, and 117.4 percent.
A second factor in the timing of is this surge in contact-sensitive jobs was the spring 2021 release of the later rounds of stimulus. Just as retail sales surged well beyond economic fundamentals because of this stimulus spending, so has employment in these COVID-sensitive sectors. Our forecast anticipates a turnaround in these jobs in 2022 with the loss of about 16,000 this year or 1.1 percent.
What About the Business Cycle?
What do we mean by the business cycle in this context? To find the key drivers of expansion and contraction in a local economy, economists often look at a select group of sectors called the economic base.4 Basic industries are those that export their goods and services to the rest of the state, nation, or world. Exports bring fresh revenue and income into the metro area, drive local expansion, and create growth opportunities among secondary, inherently local activities like bars, restaurants, retail, dry cleaners, barbers, or most of health care.
When COVID struck, we saw in Figure 12 how most of the impact of social distancing fell on secondary industries with little ability to affect regional growth. The base, meanwhile, was little concerned with Houston’s lockdown. After all, base customers were not local but scattered across the state or around the world. But when the lockdown restrictions turned national and global, affecting every U.S. and many global cities, Houston’s economic base suddenly was included in the COVID damages.
Both the base and the contact-sensitive jobs fell hard and at almost the same time, but they did not recover at the same time or same pace. Vaccines began to return contact-sensitive activity in February 2021, and 122.3 percent of employment is back in the 9 COVID-sensitive sectors. But the base has been less fortunate. While progress on vaccination is moving forward rapidly in the U.S. and Europe, there is less progress in the global recovery. Similarly, while there is solid progress in Houston’s secondary sectors like bars and retail, we see far less momentum in the key base jobs.
Figure 12 shows that historically about half of Houston’s economic base has stemmed from oil and gas, while the other half is export-oriented industries that depend on the national business cycle. The right side of the figure shows how the total base – oil plus the non-oil base – has moved through a 2018-19 oil-industry credit crunch and then the pandemic. During the COVID collapse -- between February 2020 and January 2021 – 87,400 of these important cyclical drivers were lost.
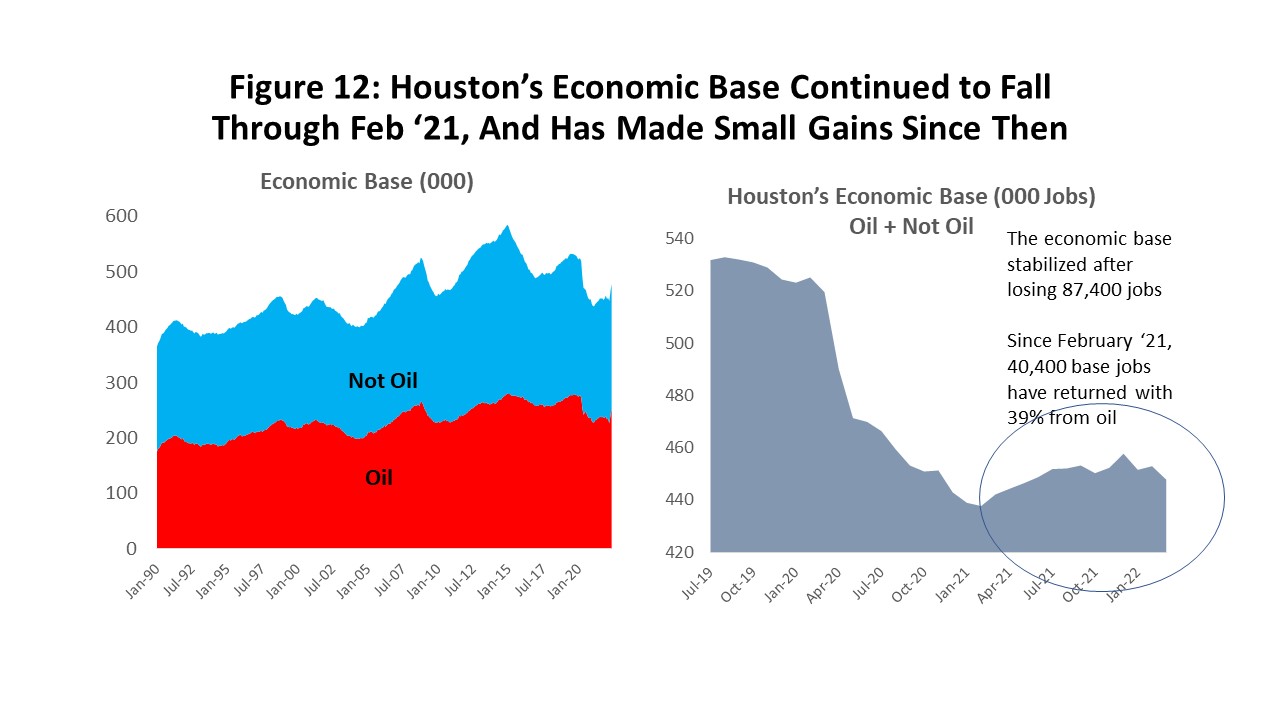
Most of the pain from base losses was concentrated in non-oil industries that sell to the rest of the nation or world accounting for 49,600 lost jobs, while the oil base fell by 37,700. Instead of quickly finding their footing after the lockdown ended, the base losses – oil and non-oil -- simply continued to mount through February 2021. Losses then stabilized, but by this May only 40,400 base jobs were back (15,600 in oil), with still accounted for only 39.0 percent of the overall base losses.
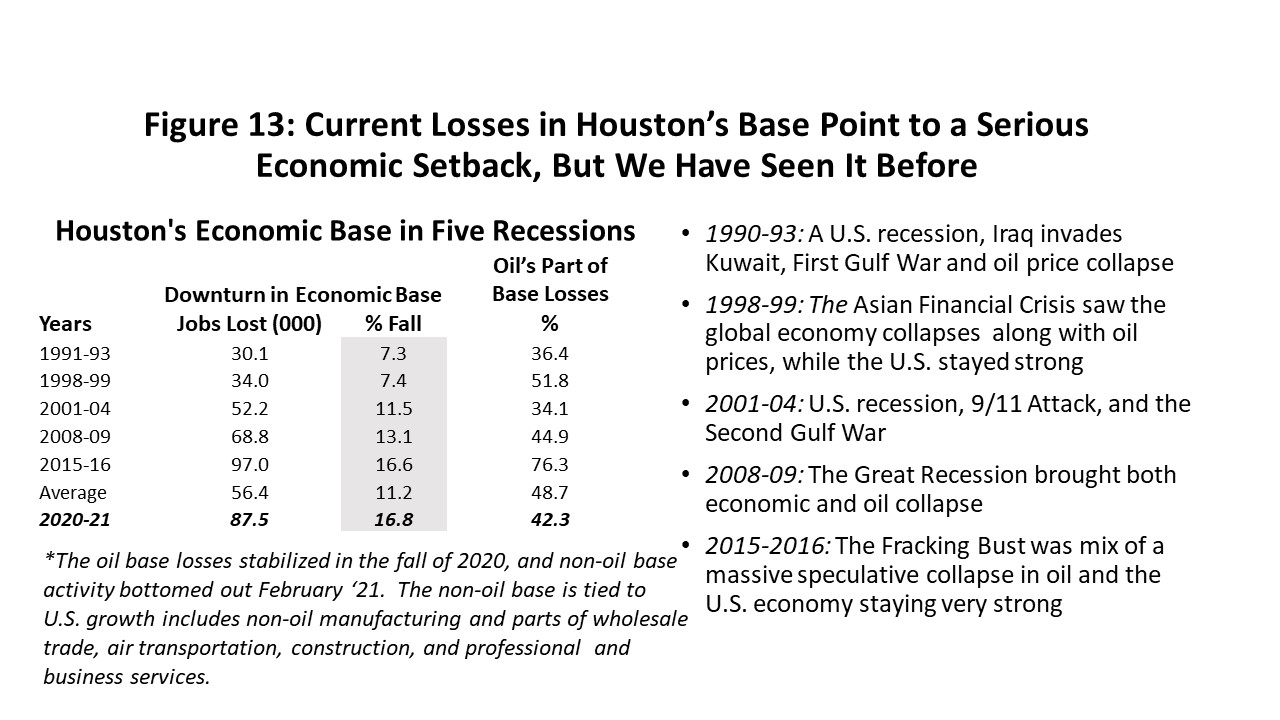
These losses to Houston’s economic base indicate a serious local recession took place, with its drivers being a moderate to serious U.S. recession combined with damage from an oil downturn. (See Figure 13.) Oil-related damage to Houston’s economy is an inherent part of the local business cycle and has come in every Houston downturn since 1990. For the five cyclical setbacks since 1990 the average loss in Houston’s base was 56,400 jobs, and at the worst moments of the COVID downturn base losses totaled 87,400 or 16.7 percent. This would rank among Houston’s worst setbacks: the 2014-16 Fracking Bust lost 16.6 percent of base jobs and the Great Recession lost 13.1 percent. By this measure, the COVID downturn was unprecedented in its causes and its path of destruction, but it settles out as a serious but not unprecedented cyclical event.
Inflation Changes the Outlook
Inflation is often described as too much money chasing too few goods. The current outbreak of inflation is significant and almost certainly results from both too few goods (a partial COVID recovery exemplified by China lockdowns, ongoing supply chain issues) and too much money (a massive 2021 stimulus that arrived after it was needed). The Federal Reserve also gets its share of blame for reacting too slowly to the inflation threat and arriving late with aggressive policy measures.
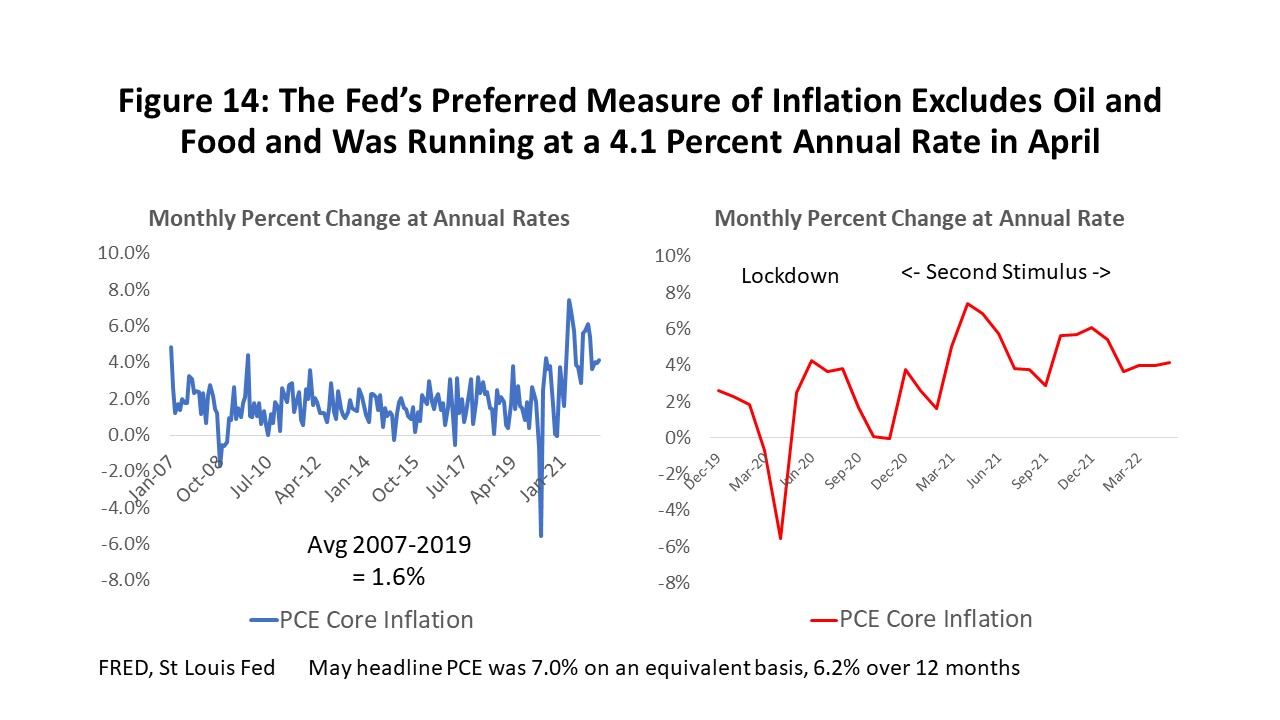
The Federal Reserve’s preferred measure of inflation is the Personal Consumption Expenditure (PCE) deflator excluding oil and food prices. Food, oil, and other energy products are excluded from the remaining core of goods because they are volatile and often dependent on noneconomic factors like war, embargoes, or crop failure. By this measure, Figure 14 shows that inflation peaked at 6.1 percent last December and has since trended down to 4.1 percent.
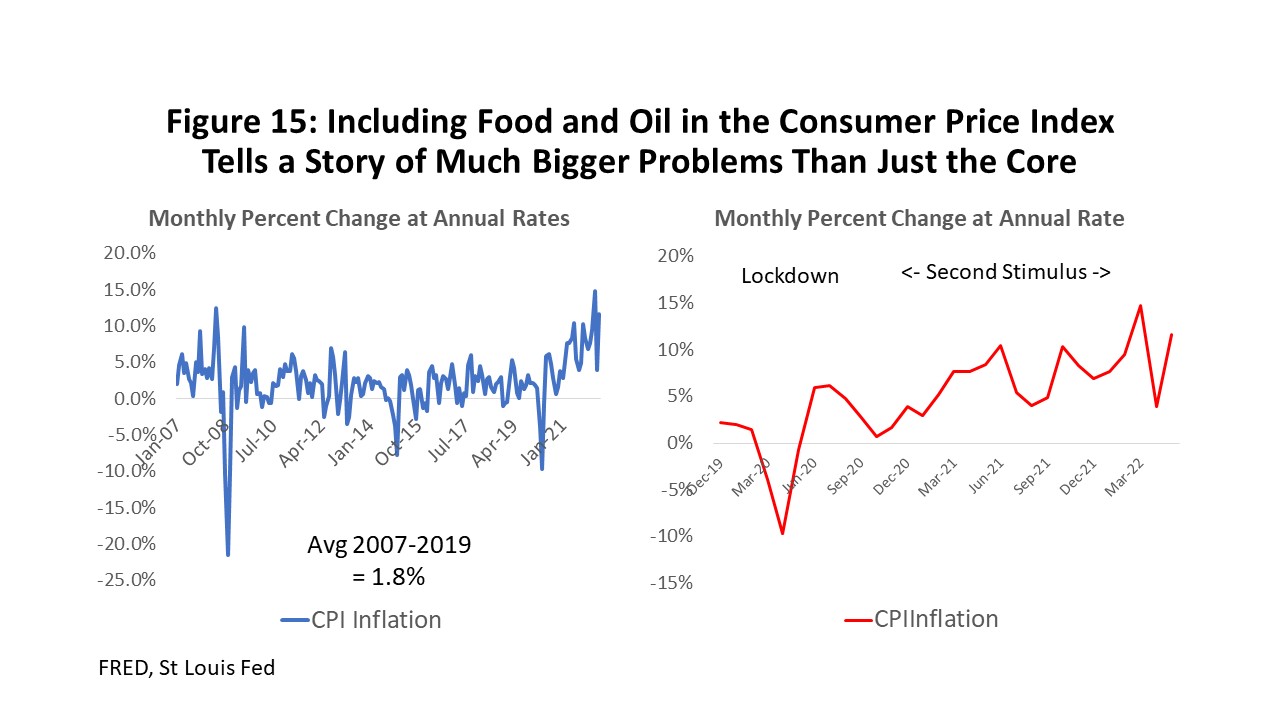
This optimistic picture of progress on inflation disappears once the Ukraine/Russia conflict enters the equation. Embargoes of Russian oil have seen prices soar to $125 per barrel and Ukraine – the Breadbasket of Europe – cannot plant or move many of its crops to market. If we shift the previous chart to a more familiar Consumer Price Index, and include energy and food, then monthly inflation in May was running at 11.6% annual rates. Measured over the previous twelve months CPI inflation was still 8.2%, and there is no sign that inflation is slowing. See Figure 15.
The Fed has to recognize that war in Ukraine and Russia is exactly the kind of noneconomic conflict that falls outside its influence. Their distinction between core and noncore goods brings no consolation to the consumer and it carries important political ramifications. However, the Federal Reserve can do little but focus on its own limited scope of control.
Where is inflation Headed?
Where does inflation go from here? (See Figure 16.) Consumer expectations as measured by the University of Michigan’s widely-followed survey say prices will rise 5.4 percent over the next twelve months and 3.3 percent annually over five years. Consumer expectations for inflation have a long history of being too gloomy. Alternatively, if we look at the Survey of Professional Forecasters assembled by the Philadelphia Fed we see 6.1 percent inflation for this year, but it is followed by a relatively optimistic 2.4 percent in 2023 and 2.6 percent in 2024.
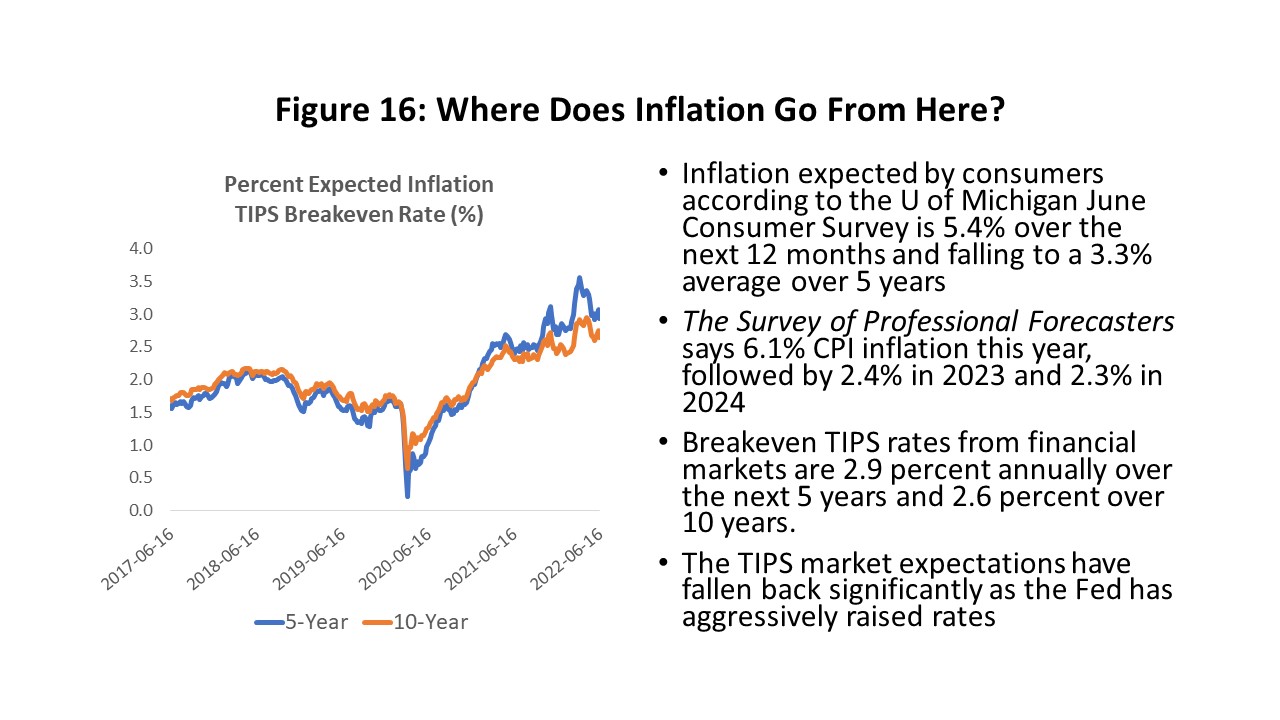
Financial markets – based on the breakeven inflation rate implied by Treasury Inflation-Protected Securities (TIPS) – indicate 2.9 percent inflation annually over five years and 2.6 percent over 10 years. These rates have fallen back under three percent in recent weeks as the Fed has become more aggressive in raising rates. These price increases – like all the inflation estimates listed in Figure 16 – include food and energy.
The Federal Reserve’s latest economic projections issued after their June meeting assume the headline PCE inflation projections for this year are 5.0-5.3 percent, followed by 2.4-3.0 next year, and 2.0 to 2.5 percent in 2024. Except for this year, the core and headline estimates are very similar. This year the core PCE inflation falls between 4.2 and 4.5 percent, but in each of the next two years the core and headline rates are on the same track. This works if we simply assume that food and energy prices have peaked this year and will no longer be adding to future inflation, i.e., to increasing prices.
These Fed inflation projections imply their monetary policy will work. What is required? The Federal Reserve has already implemented three recent rate increases of 0.25, .50, and .75 percent, and federal funds now stand at 1.75 percent. See Figure 17. The June projections show fed funds near 3.75 percent by next year. One rule of thumb – based on the fed funds rate and 2.75 percent inflation -- would imply a 10-year Treasury note yielding 7.25 percent next year. The 10-year note is widely used as a key rate for mortgage determination and many other important financial decisions.
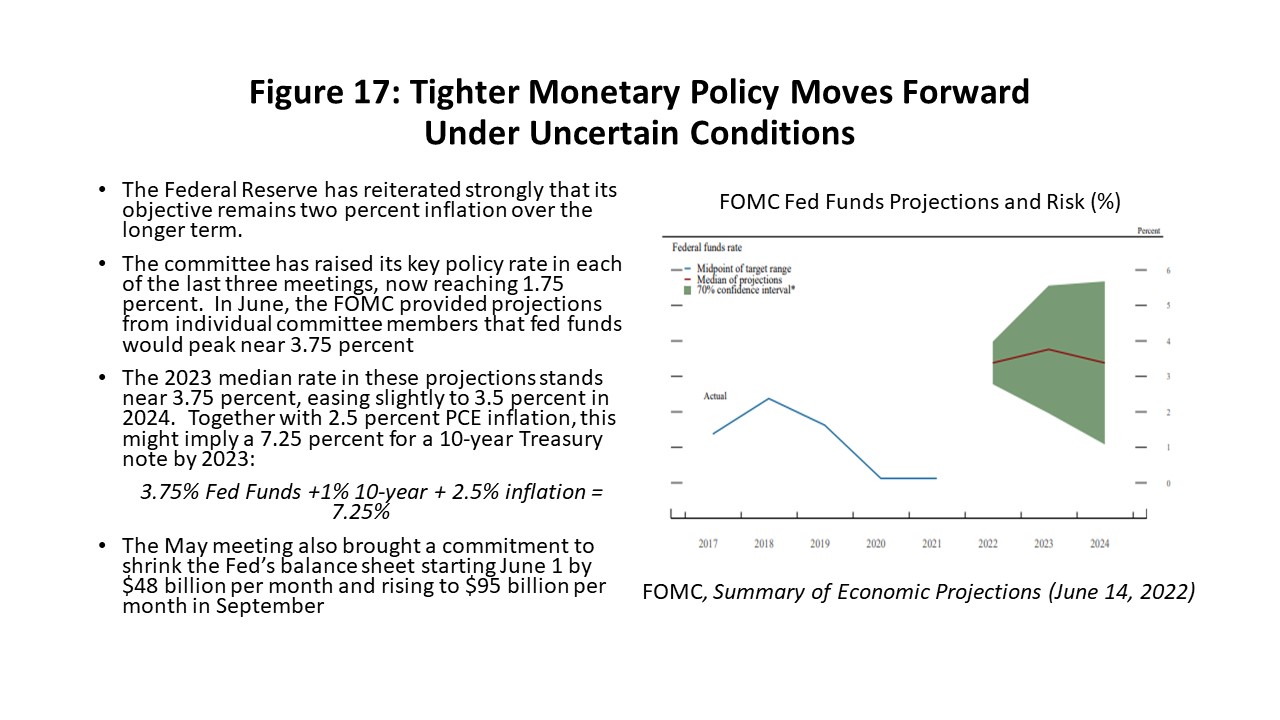
The current 10-year note is near 3.3 percent and the coming rate increases will slow consumer spending and home purchases as credit card and mortgage rates rise; they mean less investment by business, slower general construction, and falling capital spending for machinery and equipment. Higher interest rates typically hurt the stock market and bring capital losses for equities, and they reduce the value of existing fixed rate securities.
This is all happening quickly as the Fed tries to make up for falling behind in its efforts to slow inflation, and a modest recession in 2023 has become a realistic possibility. This marks a considerable contrast to economic expectations from just a few months ago, which were for the end of the COVID pandemic and a smooth transition back to normal growth.
What $100 Oil Means for Houston’s Economy in 2022
The Russian invasion of Ukraine that began in late February continues as a hot war, and it has brought a massive disruption of markets for oil, natural gas, and many other global commodities. When oil gas prices have soared in the past, they have typically brought long and enduring oil booms with rising rig counts and growing production. So far, the American oil industry has been extremely reluctant to chase higher oil prices at all, much less buy into a sustained multi-year commitment to oil prices at $100. Indeed, it is unlikely that $100 oil will ever again mean what it once did to the American fracking industry -- or to Houston’s economy.
We need to start with a high-level perspective on the current state of the U.S. fracking industry.5 This is not the same industry that responded to the high oil prices of 2007 to 2014 with 2,000 working rigs. Fracking’s recent history is one of an industry that has been seriously damaged by a series of reckless investment decisions in the run-up to the 2014 fracking bust, by its continued bad investments after 2016 as it became clear that fracking is a high-cost source of oil, and by repeated punishing price cuts from OPEC+ that have forced this high-cost reality on them.
- Growth of tight oil and natural gas exploded in the early 2000s, and it has since been boom and bust for American fracking. U.S. oil production boomed at 24.6 percent annual rates from 2004-2014 as a result of OPEC driving $100 oil prices, zero interest rates from the Federal Reserve after 2008, and speculative excesses by both the U.S. fracking industry and those who financed it. It was an oil boom that rivaled the 1980s.
- The fracking bubble burst in 2015-16 when OPEC slashed oil prices, but it took until 2018 and rising interest rates from the Federal Reserve before the last avenue of growth was cut off from this capital-intensive industry. With oil prices hovering at $50-$55 in 2018, the industry could neither improve equity values nor earn profits.
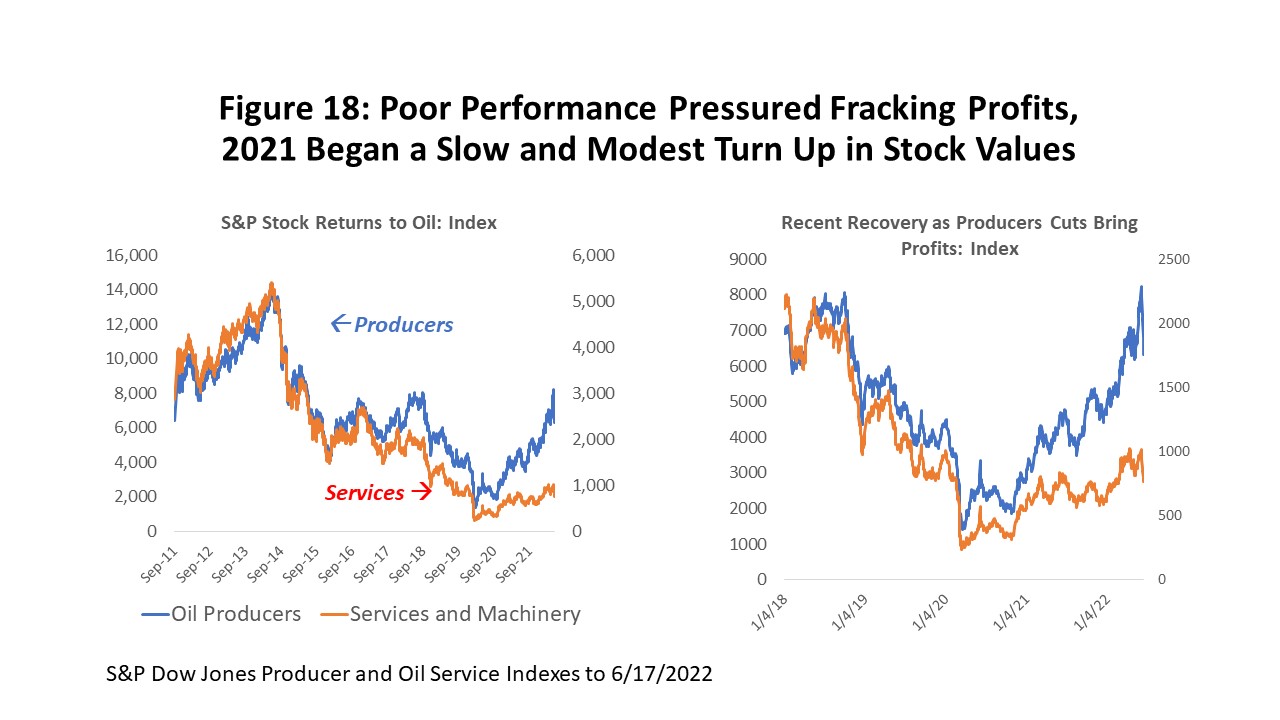
- In 2018-19 the fracking industry saw a severe industrywide credit crunch as Wall Street and the investor community turned its back on the fracking business. The S&P Producer Stock Index was over 14,000 in September 2014, but it had fallen to near 2,400 by August 2020. Even with the current support of $120 oil, producer stock prices have only returned to 2019 pre-pandemic levels. Oil services and machinery suffered even worse losses and with far less recovery. (Figure 18)
- COVID lockdowns and the Saudi-Russian oil war in May 2020 marked the low point for fracking – and posed a near-death experience for many companies. The rig count briefly fell as low as 267 working rigs, down from near 2000 in 2014, and has only recovered to 730 in 2022Q1 compared to over 1000 rigs working in 2019.
- Before 2014 the fracking industry – with the support of $100 oil – was a high-flying growth stock. All its free cashflow could be directed to the oil fields and new production. However, the 2014, 2018-19, and 2020 reversals took $300 billion in oil producer, oil service, and machinery assets through the bankruptcy courts. Today a smaller and chastised industry is a value stock that can attract investors only by committing 30% or more of it free cashflow to potential investors through dividends or by rebuilding its balance sheet. This means a smaller and more slowly growing industry, and that any given oil price brings a smaller impact in the oil fields than in the past.
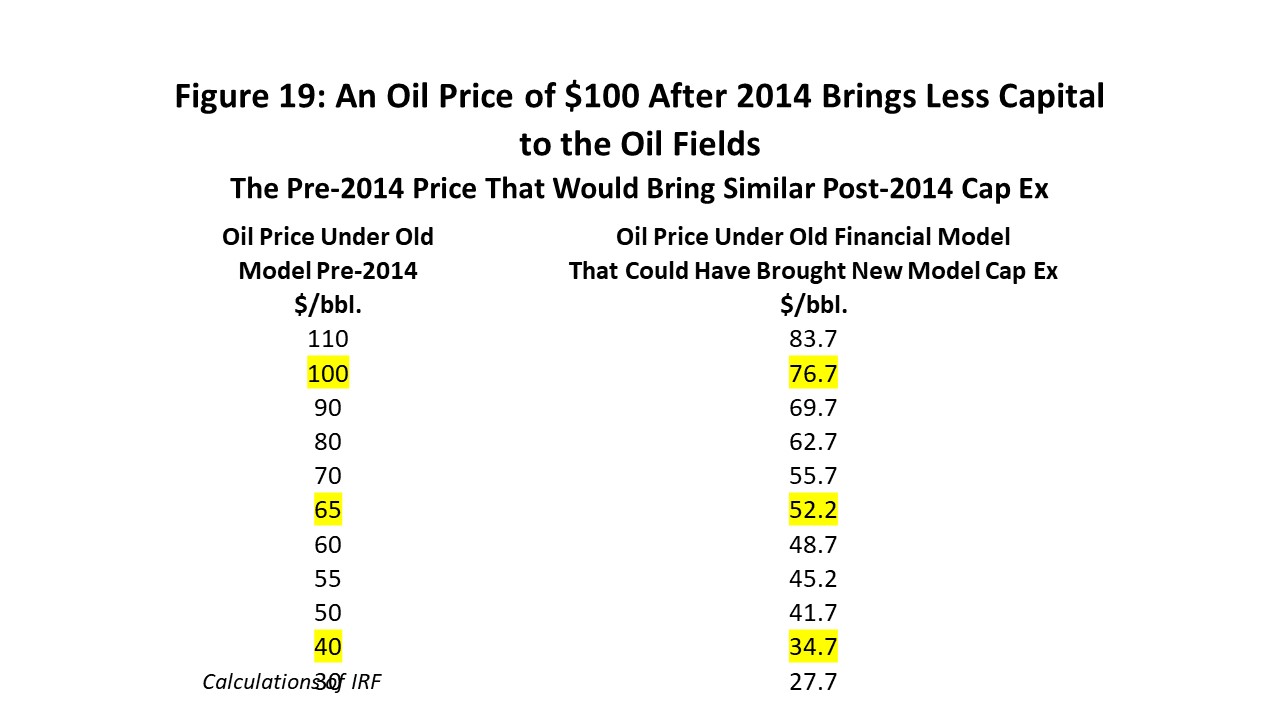
- How much smaller? Given the new financial model, how would the industry respond today to a WTI market price $100 oil? We know that the capital diverted to the oil fields under the new financial model will be less than before. Let’s ask the following “what if” question: Once we see the new lower capital spending level, what if we had been working under the old free-spending model? Back in 2014, what oil price could have delivered this new lower level of capital? The answer is in Figure 19, and we interpret it as saying that what $100 oil prices deliver today as oilfield spending could have been bought for $76.67 under the old financial rules. For $65 oil, think of it today having the same impact on drilling as $52.70 would have in the boom days.
Time for Houston’s Oil Sector to Make Some Gains?
Putting current $100 oil prices aside, there is plenty of room for fracking to make some substantial gains in 2022-23. This was true well before the Russian invasion of Ukraine, and our forecasts from last year already included meaningful increases in oil-field activity and local oil employment in 2022-23 based on financially responsible gains by the fracking industry as its economic health improved.
Until recently, producers were very reluctant to react to improved oil prices as long as their financial position remained weak. Recent higher oil prices and stronger balance sheets, however, have offered producers the opportunity to respond with more drilling activity and production, although so far with limited results.
Even before Ukraine, oil prices had been over $70 per barrel for the previous six months (Figure 20), but we just learned from Figure 19 that $70 now has the same impact as $55.70 would have had a couple of years ago. But the producer response – based on the rig count or local oil employment -- has been weaker than even $56 would suggest.
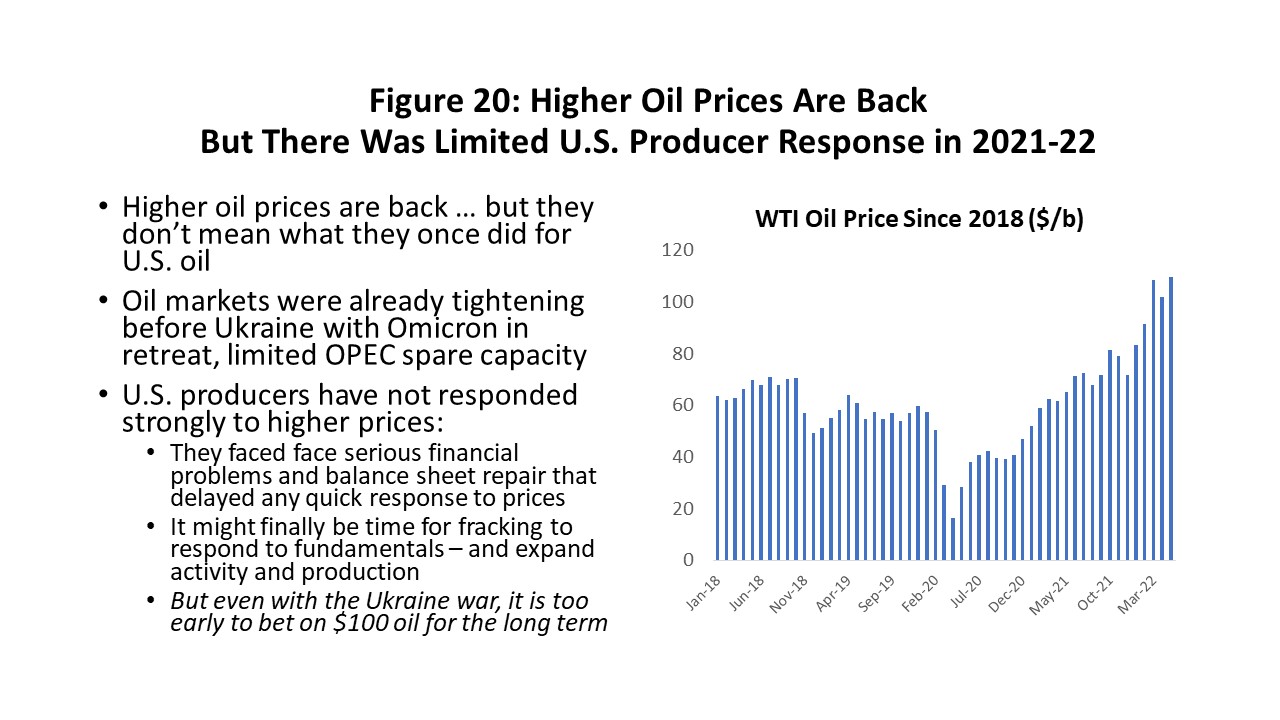
Caution is justified. As discussed, U.S. producers have been forced to make deep cuts in capital spending to appease current investors and attract new ones. Further, many had committed to holding the line on the expansion of production until world growth stabilizes after the pandemic and OPEC spare capacity has been absorbed. This was a formula for higher oil prices – but not for increases in capital spending, rig counts, or new oil jobs.
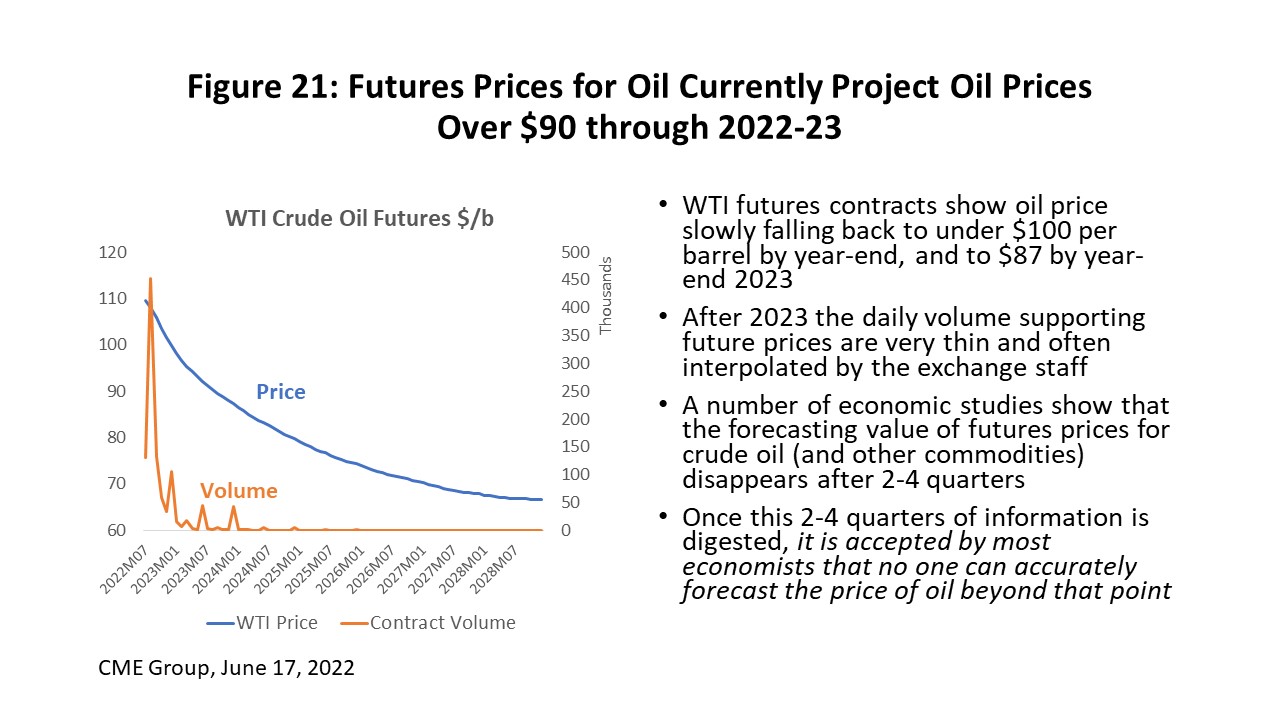
Caution is also justified in producer skepticism about the current level of $100 per barrel. How long will it last? Figure 21 shows that recent futures prices project prices to hold at $90 per barrel through the end of next year. But the daily volume of contracts on which the futures prices are based become exceedingly thin past 2022. Further, study after study of many commodity markets conclude that there is virtually no information about the future in these forward prices past three to six months. Despite the industry of consultants that has grown up to forecast the price of oil, studies repeatedly confirm that no one can predict the price of oil effectively past that 3-6 month point. Oil markets are too complex, missing too much basic information, and repeatedly subject to one-time, unforeseeable events like pandemics and European wars.
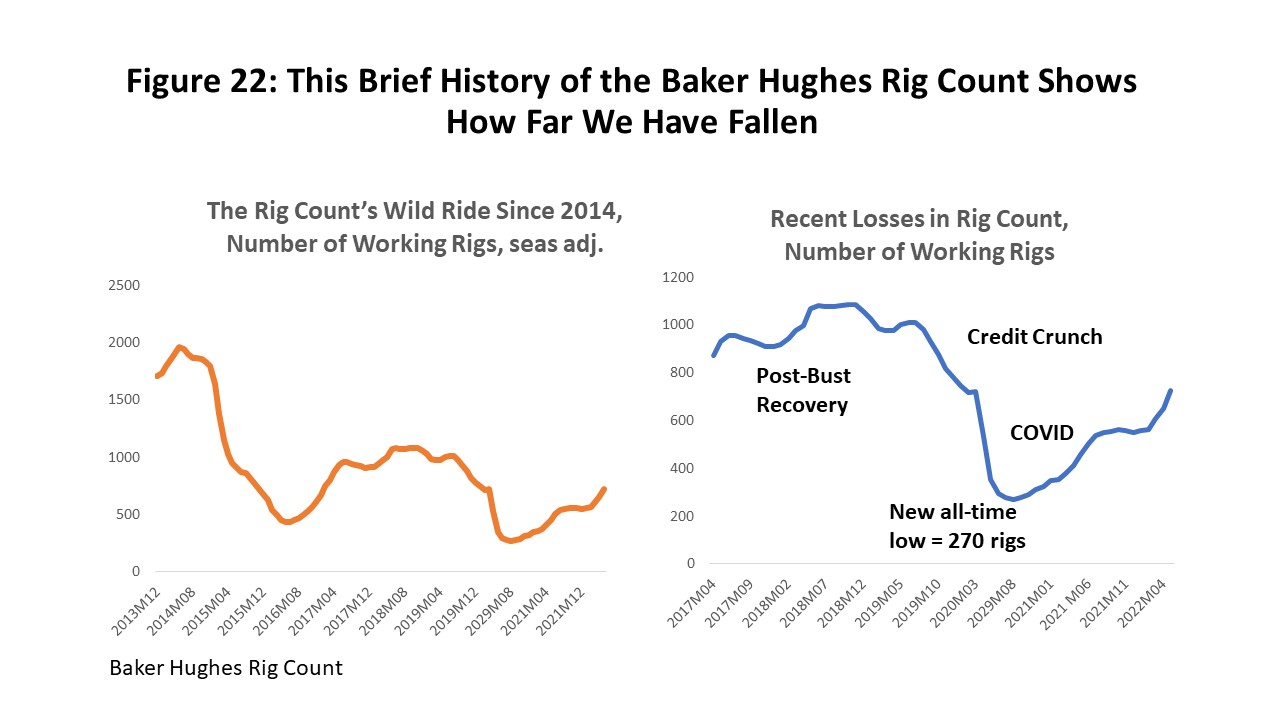
Slow and methodical recovery in the oil fields since 2020 is seen in Figure 22 and in the latest data on the rig count. Working rigs have made only limited progress over the past year. In 2016 the rig count fell from near 2000 rigs in 2014 to a seasonally adjusted all-time low of 433. The pandemic then crushed that record in August 2020 with a fall to 267 rigs. The rig count still shows a return to only 723 rigs through May, well short of the 1000 level that held in 2019. We see some acceleration in the number of rigs early this year, although it is natural gas and not oil that seems to be leading these gains.6
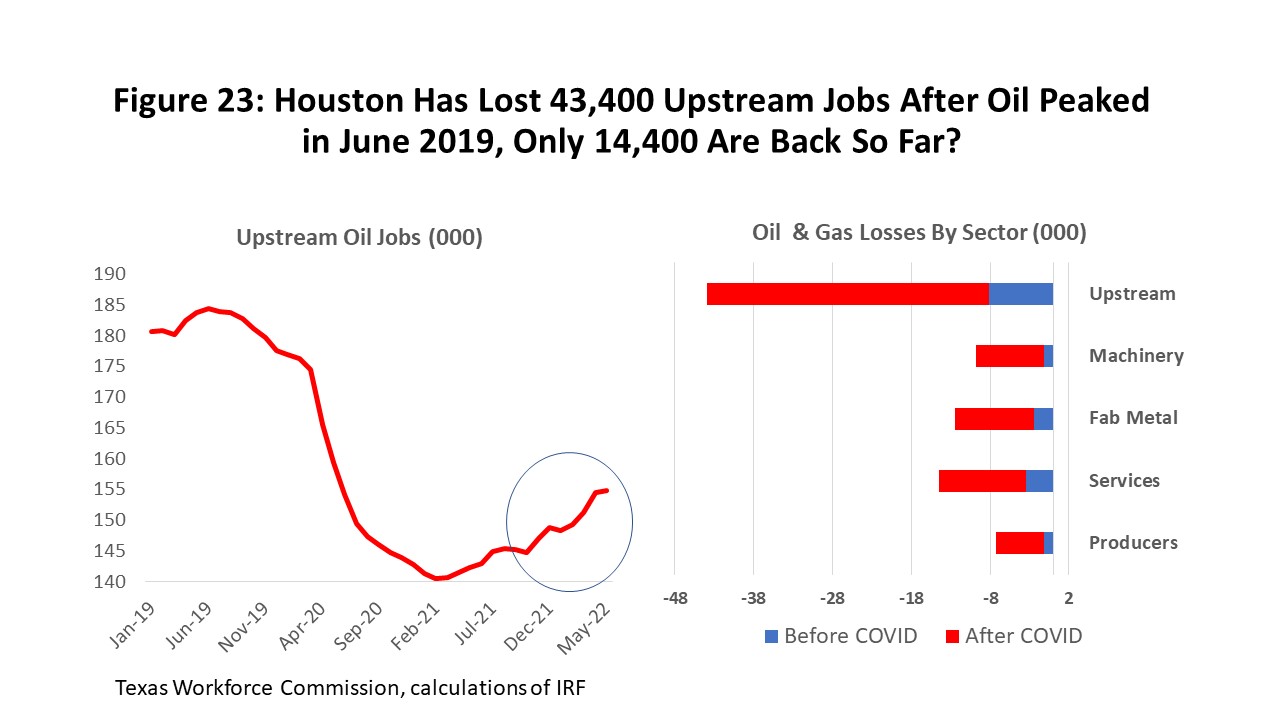
The recent trough in local oil-related employment came in September 2020 after Houston had lost 43,800 upstream jobs measured from the June 2019 peak. These are large losses but only half of the 77,200 oil-related jobs lost during the 2015-16 Fracking Bust. The 2015-16 collapse in Houston jobs resulted from a bubble that burst in U.S. fracking after oil prices fell hard in late 2014. Oil jobs hung on much better this time because the local job market already had been substantially rightsized by early 2020.
Many of the oil jobs lost currently will return – but not quickly or soon. Figure 23 shows changes in upstream oil jobs: producers, services, machinery, and fabricated metal. They are measured from (1) the beginning of the 2018-19 credit crunch and before COVID, and (2) after the COVID-19 outbreak to the present. The data through May show a recovery of oil jobs that still adds up to only 14,400 or one-third of losses.
Time to Move Forward?
The oil downturn began before COVID-19 because of a serious industrywide credit crunch in the fracking industry. In terms of the number of losses, the COVID period was by far the most serious part of the downturn, but the on-going slow and partial recovery in rigs, well completions, and oil-related jobs has much more to do with pre-COVID credit problems than with COVID. The need to completely rethink the financial model for the fracking industry has been underway since mid-2020.
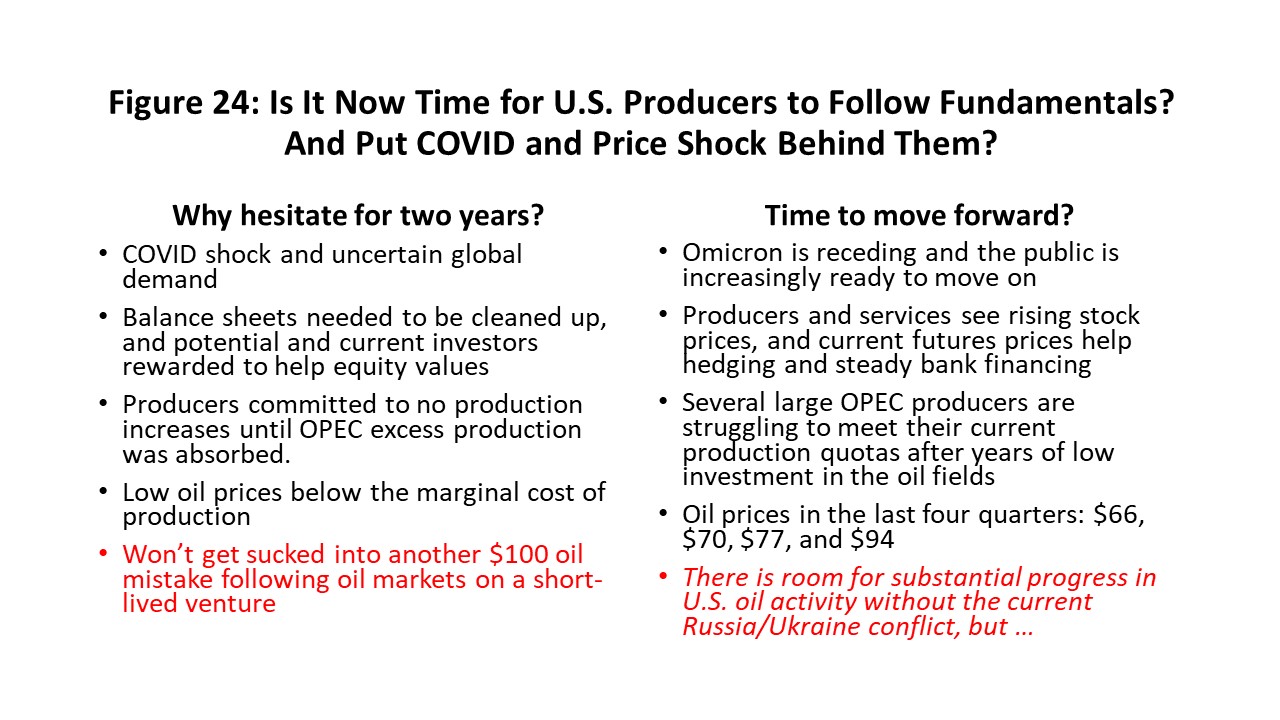
Amid the gloom, there is reason to think that perhaps the worst is over, and that is time for U.S oil to respond better than it has so far. Oil had been operating below fundamentals for good reason: COVID shock and uncertain global oil demand, the industry’s poor financial position, and because many U.S. producers committed to not increasing production until all OPEC excess reserves had been absorbed. They were certainly unwilling – and remain unwilling -- to get sucked into another $100 per barrel oil venture that could lead to yet another short-lived mistake and another round of fracking bankruptcy. (Figure 24.)
But much of this has been fixed now with COVID disappearing, great progress in financial repair, and OPEC struggling to meet quotas even before the Ukraine invasion. The blue line in Figure 25 is the recent history of the rig count. The red line is where U.S. drilling would be if a $65 price prevailed, if the new financial model were imposed, and in place of a pandemic and Saudi-Russian Oil War, we had simply seen a moderate to serious U.S. recession and a run-of-the-mill period of $40 oil prices for two quarters. We then return to the world as we knew it in pre-pandemic 2019 – all shocks now behind us -- and with the $65 price describing the industry’s new long-term niche in world markets.
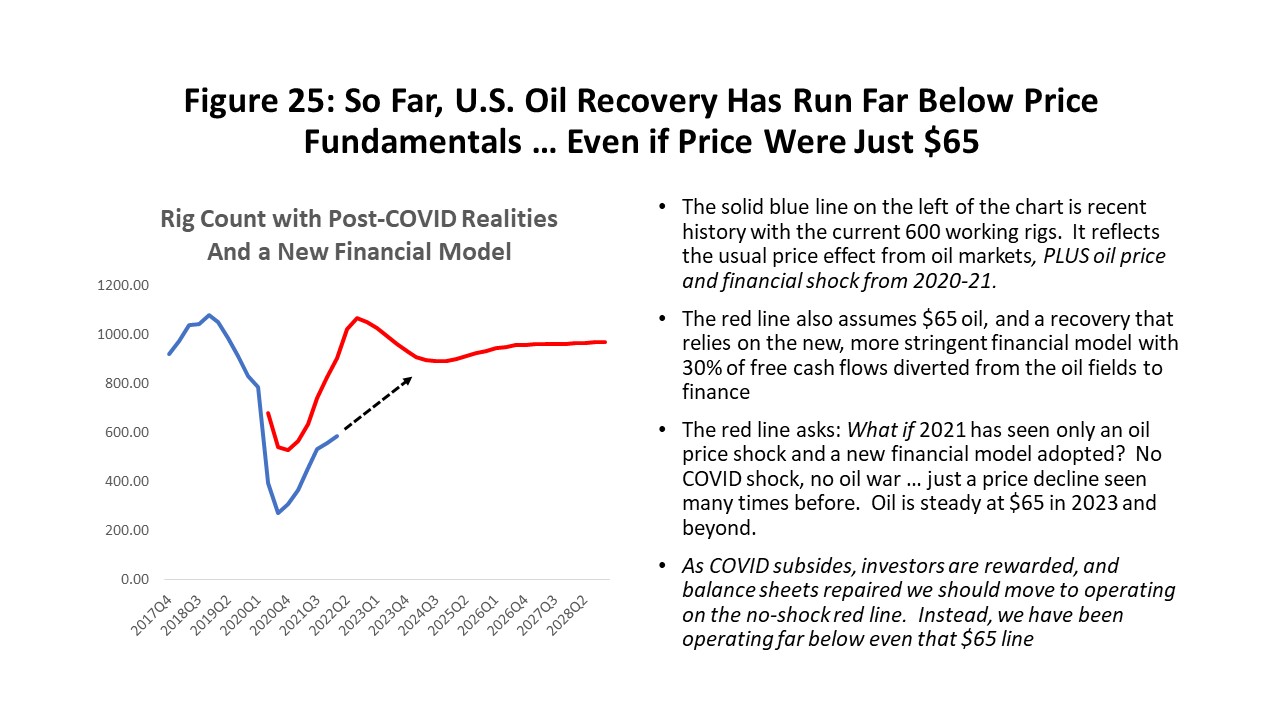
With Omicron in retreat and normal or better oil prices, we should be capable of moving back into this pre-COVID world and onto the higher “pre-shock” lines. At $65 oil, for example, we could move back to a long-term rig count near 900 instead of the actual 600 in 2022Q1. We would move back along the broken black line. How fast this happens and how far we really move is open to debate and no statistical analysis can tell us how this unfolds. But the potential for improvement has returned and is built into our forecast for the rig count and local employment. And this is without the Ukraine invasion or $100 oil even being considered.
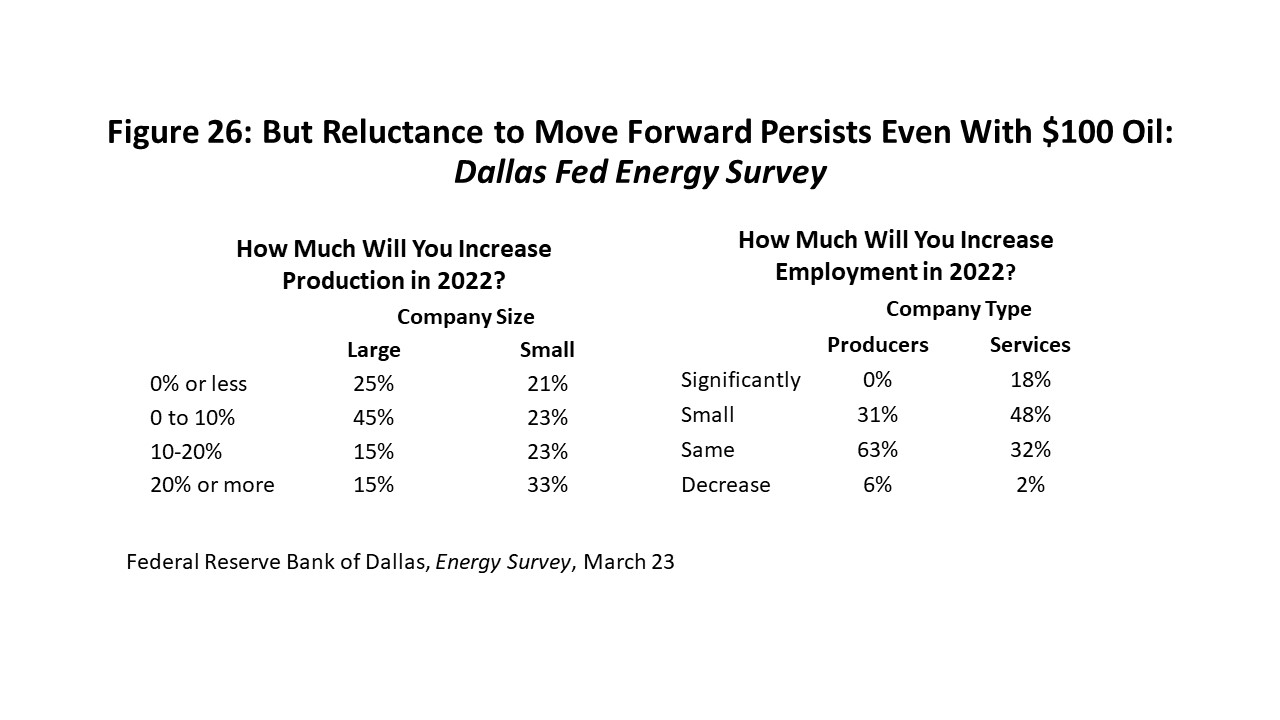
The March Dallas Fed Energy Survey asked why fracking producers have been so slow to respond to higher oil prices given the industry’s better financial and economic position described in Figure 24. They asked first what the industry’s plans were for production and oil-related employment this year and followed by asking why oil companies remained reluctant to move ahead with any vigor.
Figure 26 shows that 70% of large companies would increase production by 10% or less this year, while only 15% would entertain increases of 20% or more. Small companies – more often private – said 33% that would be willing to consider larger production increases. And for employment, no producer was willing to consider more than a small increase in job, although the badly beaten-down service industry said 66% of companies would consider a small or significant increase in jobs.
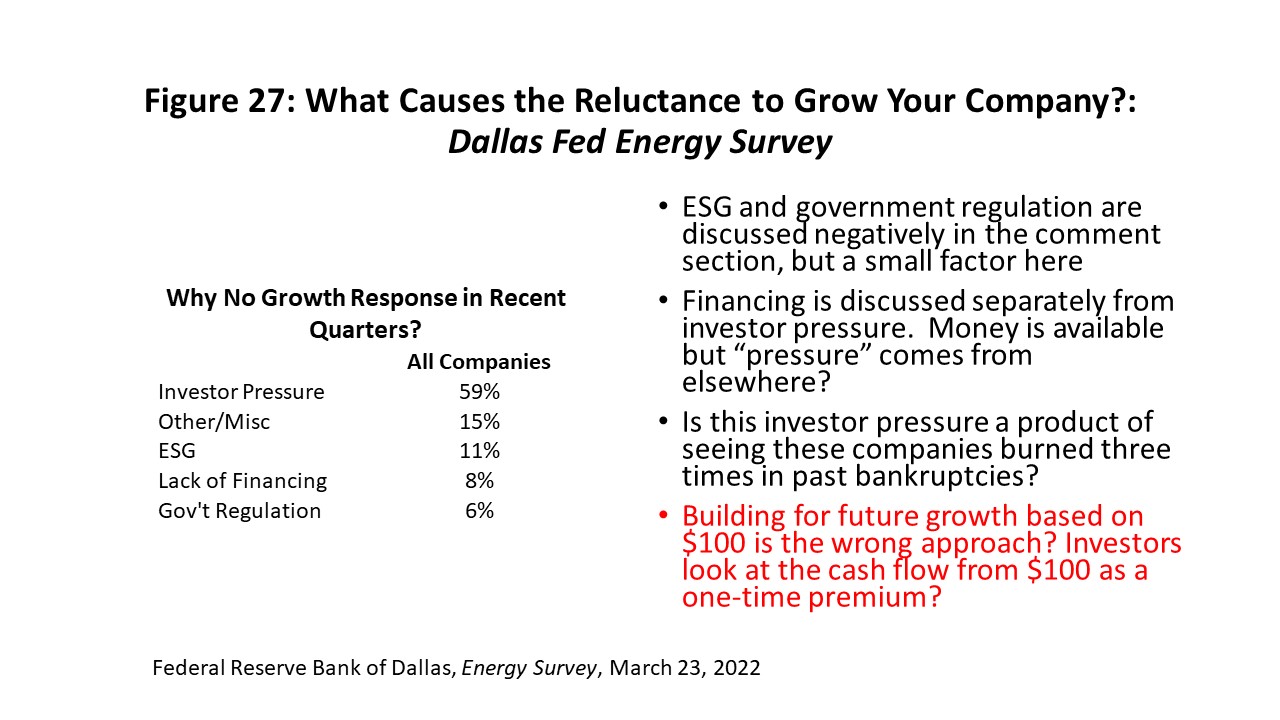
When companies were asked why they were not moving forward more rapidly, ESG and government regulation were given surprisingly little consideration as factors that slowed them down, and lack of financing was no longer a significant issue. (Figure 27) The dominant factor is simply investor pressure. Perhaps this is interpreted as follows: After watching the industry throw good money after bad in three round rounds of bankruptcy, investors are unwilling to even consider chasing investments in $100 oil projects as a profitable way to spend company capital. It is better to steer the cash directly to investors, or perhaps indirectly by fortifying the firm’s finances.
Our forecast assumes that companies are finally able – and perhaps willing -- to move forward at a rate consistent with oil prices near the long-run cost of producing tight oil at $65 per barrel. This could push the rig count up to 850-900 rigs by the second half of next year, and it would remain at that level as long as a $65 oil price prevailed. Local oil-related employment should follow, also returning to pre-COVID 2019 peaks by late next year. These are moderate increases in activity based on a reasonable investor’s view of effective long-term capital spending.
Houston’s Employment Outlook
We know generally how payroll employment should perform over the next few quarters. We have seen the return of most COVID/contact-sensitive jobs since March 2021 and they have now surged well beyond pre-COVID levels with the help of stimulus payments. These jobs will fall back modestly this year as stimulus ends, while we see accelerated growth in the important local base jobs that drive the business cycle. Houston has finally returned to pre-COVID total employment, and the U.S. also should match pre-COVID levels by mid-2022. We expect gains in oil-related activity in response to improved financial health among producers, but drilling remains confined to a response to $65 oil as investors steer the industry away from any capital spending based on higher oil prices.
As we pull our forecast together, we will use a high, medium, and low outlook for planning purposes. We use the oil prices in Figure 28 as a vehicle to spread the outlook from high to low employment levels. For current planning, based on the limited response of the industry to actual oil prices, high oil price over this time period remain near $80 per barrel and the low is $40. The medium or most likely price is $65 per barrel, a price widely accepted as the long-run marginal cost of oil. In all cases we use the new financial model with 30 percent of oil industry free cash flow diverted to investors. This smaller industry limits our expectations for oil-field expansion and regional growth.
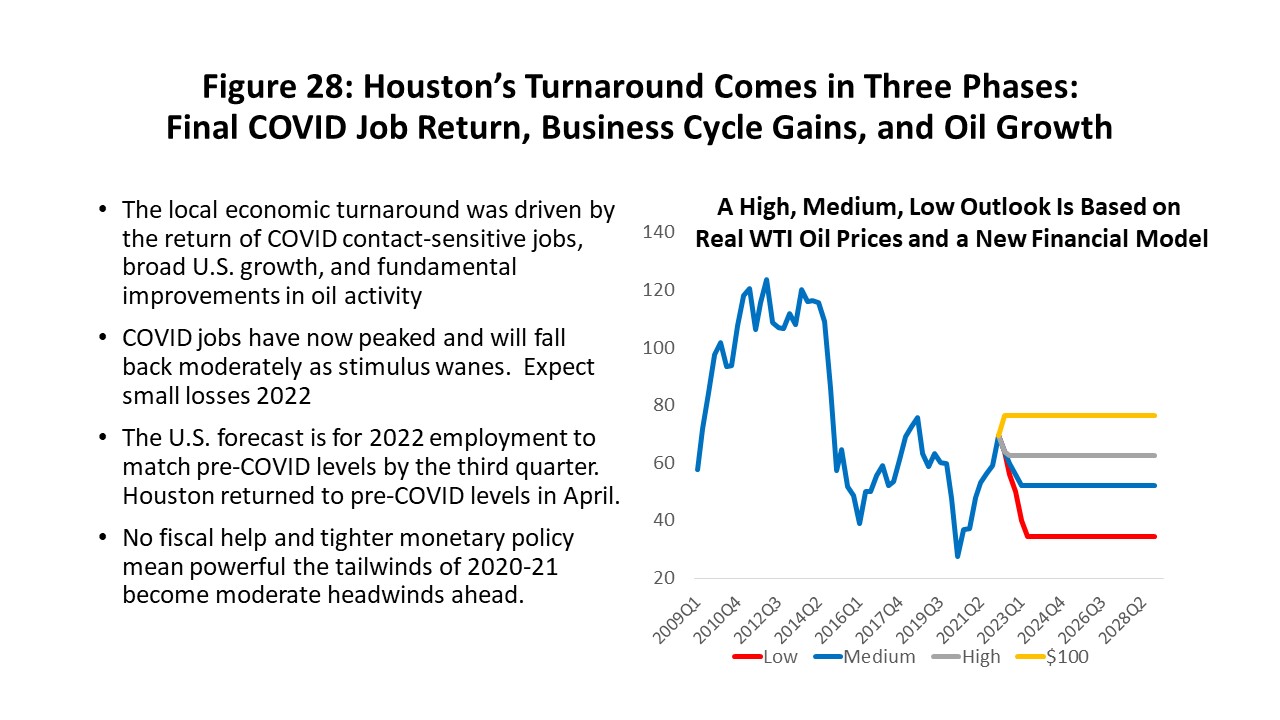
We have added the impact of $100 oil prices in Figure 28 only to demonstrate their effect on the local economy if oil prices were to remain at that level for at least a year or more. As discussed in the previous section of the report, we do not think producers will respond to $100, not matter how long they last. Even if producers did move forward, it can take up to nine months for the rig count to fully respond to price gains and up to two years for local oil jobs to complete these gains.
In the first quarter of this year we saw a return of almost all the jobs lost to COVID lockdowns, and April finally closed the gap. We still have some further adjustments to be made with COVID contact-sensitive jobs falling back this year by 16,000 as the stimulus disappears, and a sharp improvement upward through 2022 in the base jobs that drive growth. The net effect, however, is that 2022 sees economic fundamentals returning to the driver’s seat – oil and the U.S. economy take control while COVID and fiscal/monetary stimulus disappear. Monetary policy moves rapidly to a noninflationary stance.
Figure 29 shows how these economic fundamentals play out over the long-run for Houston payrolls and in the low, medium, high, and $100 cases. This is our forecast of Houston’s future as far as 2028.
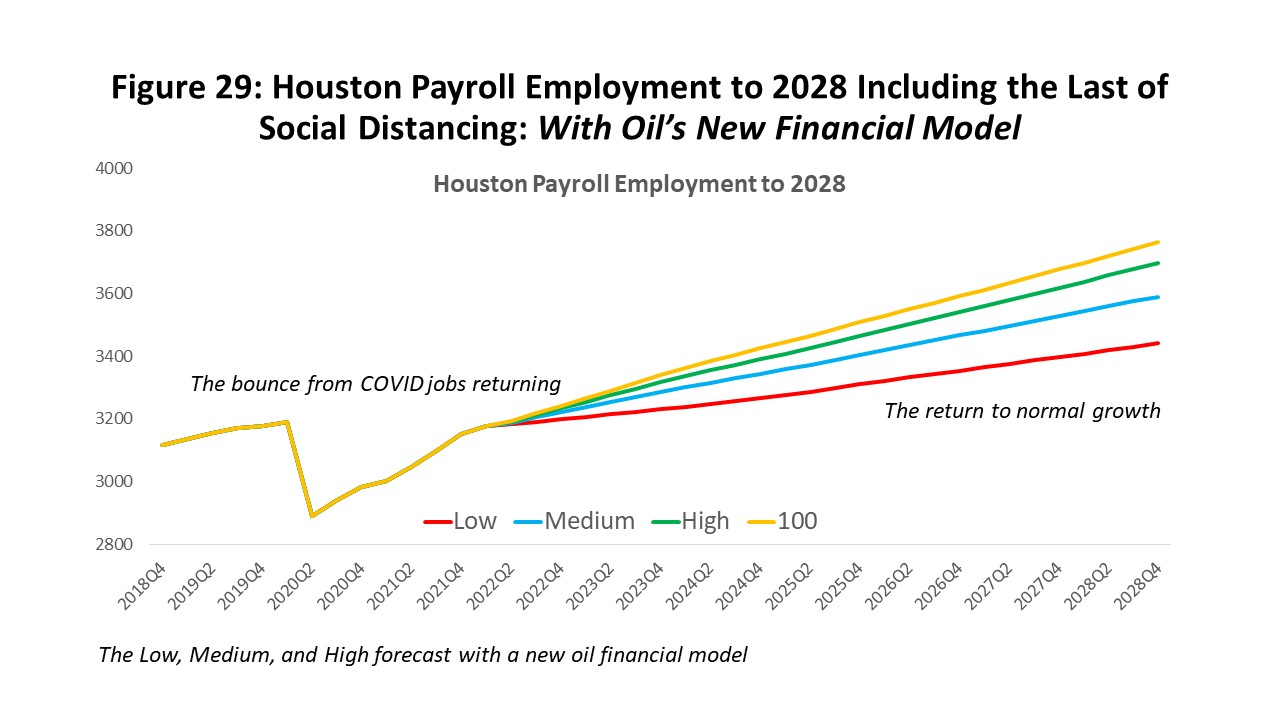
Figure 30 is this same forecast of Houston’s payroll employment to 2027 stated in annual changes that are measured from Q4 to Q4. The focus is on the medium forecast and $65 oil prices. We see the loss of 193,000 jobs in the lockdown year of 2020, divided into 145,00 jobs lost due to social distancing and another 48,000 cyclical jobs from base losses. This was a 6.1 percent decline in payrolls. We see a return in 2021 of 167,600 jobs led by 160,900 contact-sensitive jobs joined by only 6,700 from cyclical or basic gains.
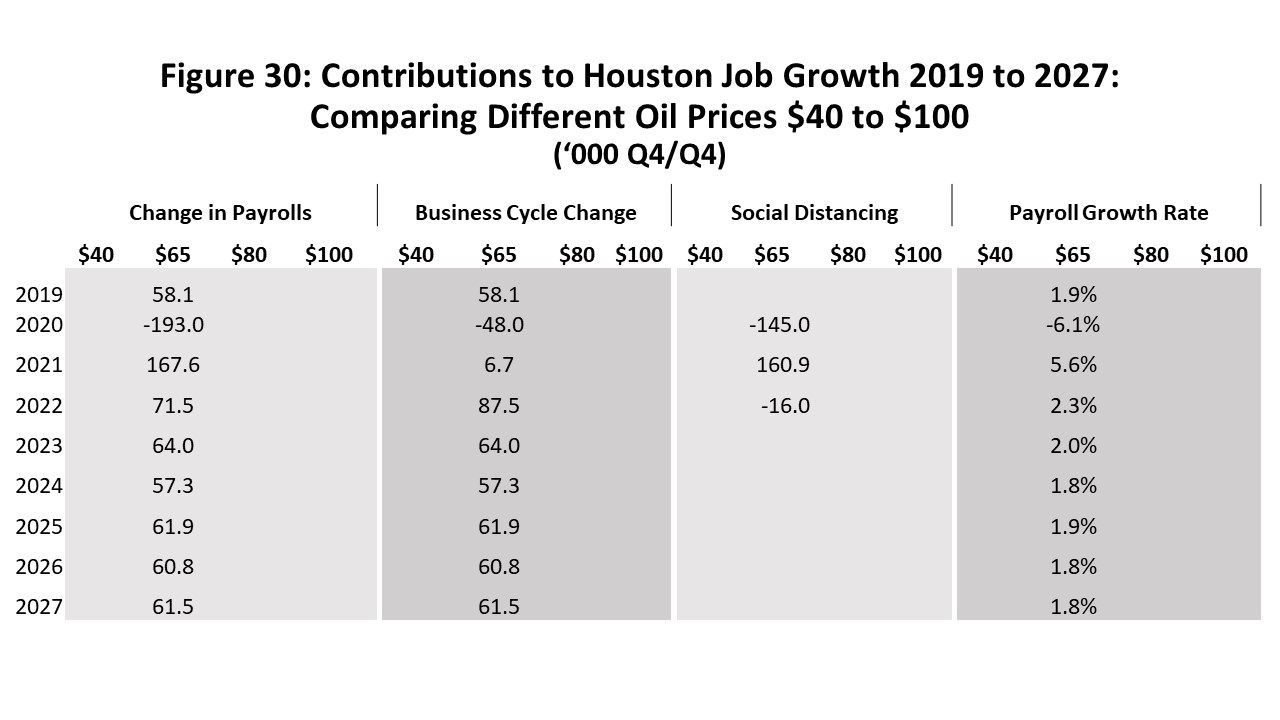
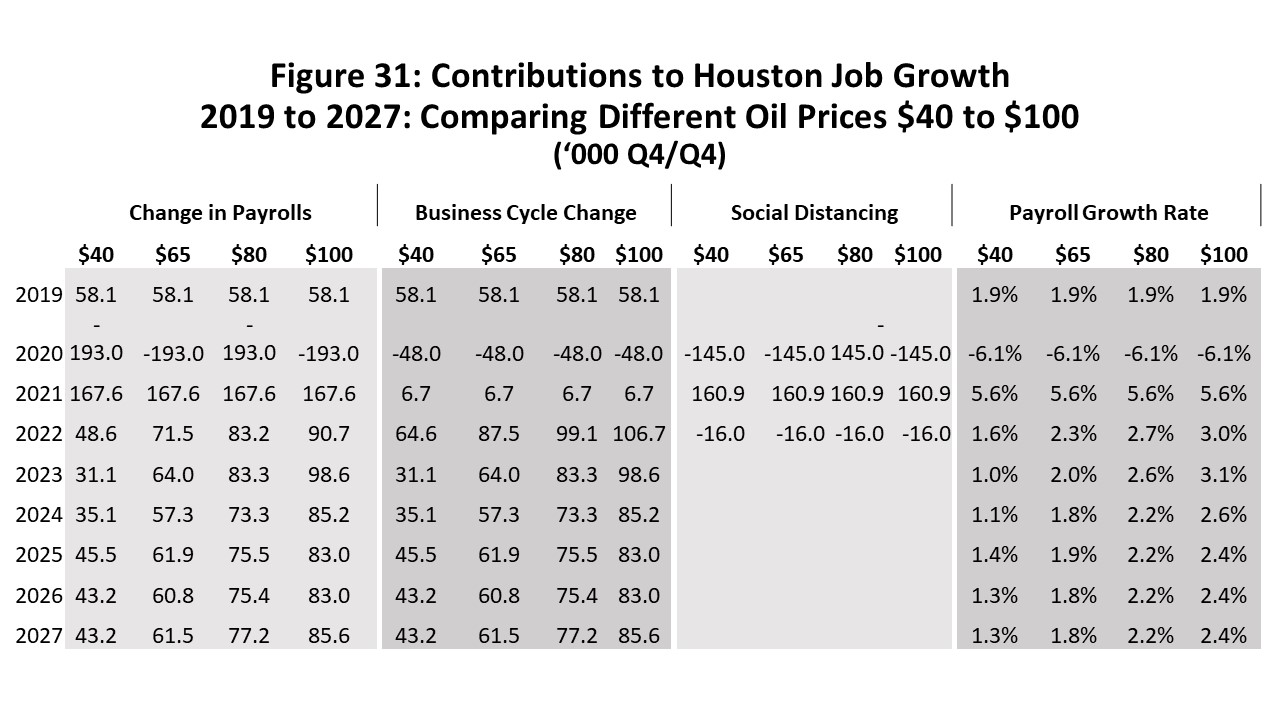
This is followed in 2022 by 71,500 new jobs, a combined 87,500 from cyclical gains and 16,000 COVID/stimulus-sensitive jobs lost in sectors like retail and food service. Oil jobs will contribute to growth in late 2022 and 2023 and keep cyclical growth running above trend. By 2024 we see payroll growth finally settle back to long-term trends at 1.7-1.8 percent annual growth rates. The results for high, low and $100 oil price forecasts are shown in Figure 31.
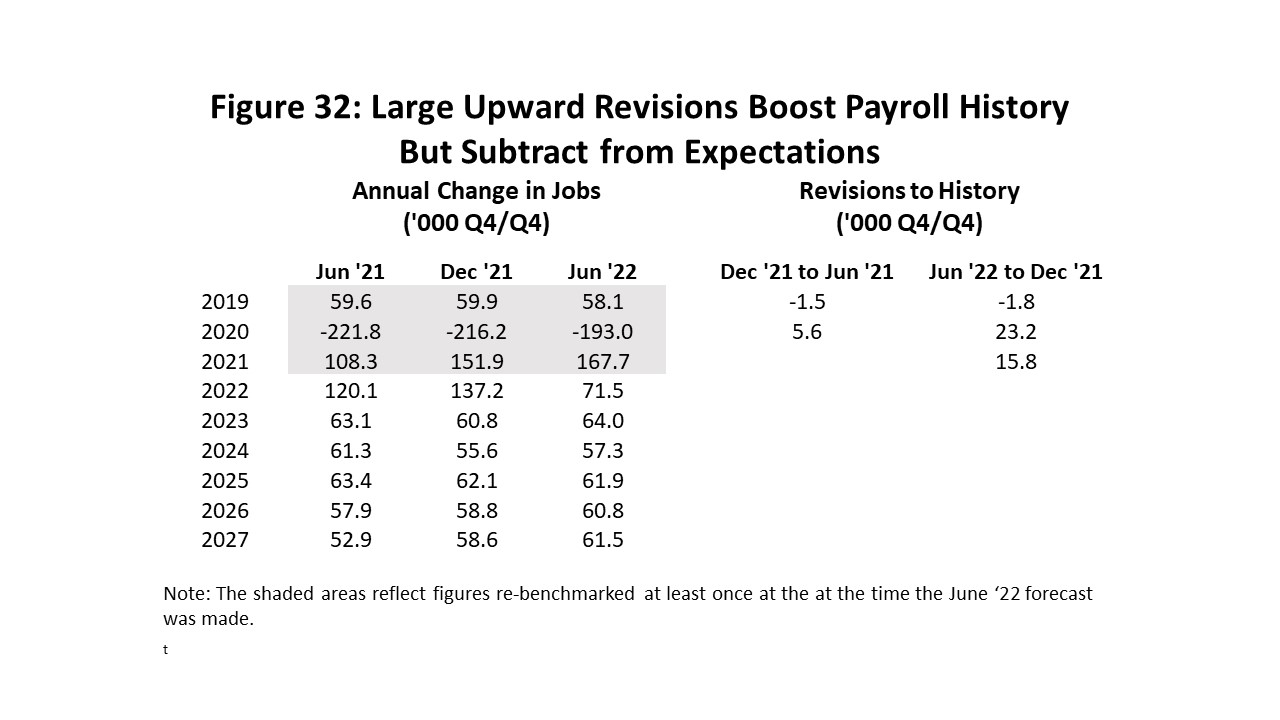
The current 71,500 jobs forecast for 2022 is a substantial change from the previous 137,700 jobs that was forecast last December. However, 37,200 of this change reflects annual benchmark revisions made to 2020 and 2021 that now show a downturn in 2020 that turned out to be 23,200 jobs milder than expected, and upward revisions to 2021 data by 15,800 jobs. See Figure 32.
Upward revisions are good news, of course, working to get Houston out of recession more quickly and back on its historical growth path. However, a recovery period typically sees jobs return easily from recent recession with workers and capital readily available and able to quickly return to work. With economic recovery ending earlier than previously thought, the new forecast also reflects a downshift in any growth expectations for 2022 as slower and more fundamental growth takes control.
Also, another 16,000 jobs in 2022 were lost to COVID contact-sensitive jobs like food service, retail, and healthcare. These sectors pushed well above trend in 2021 with stimulus, and this year will see them return to normal trend levels.
It is important to recognize that the number of returning jobs is exciting with 167,600 jobs last year and perhaps 71,500 jobs this year. But April 2022 only saw the return of the payroll jobs lost to the pandemic, following on two-plus years of growth lost to recession and recovery. As fiscal stimulus and zero interest rates disappear, those two years lost to recession and no growth since 2020 will be increasingly exposed.
No matter what happens to oil prices in the near term, the new financial model for oil means that through many years to come local economic expansion will be handicapped compared to the past. The response of oil will be relatively lackluster. The good news about oil is that the new financial model should make it a much more stable industry. The wild gyrations since 2014 – and its unpredictable economic impacts on Houston economy – could be behind us for a while.
Written by:
Robert W. “Bill” Gilmer, Ph.D.
Director, Institute for Regional Forecasting
July 4, 2022
University of Houston
C. T. Bauer College of Business
1 What we call collections here are termed “allocations” by the state comptroller. All state and local sales taxes are collected by the Texas Comptroller and allocated two months later to local entities like METRO and the City. Figure 1 is by the date that the initial tax liability was incurred, not the date of the allocation.
2 Mitchell Burnes, Wendy Edelberg, Sara Estep, and Moriah Macklin, “Bolstering Balance Sheets: Assessing Household Balance Sheets Since 2019,” Brookings Institution, March 2022; Andrew Castro, Michelle Cavallo, and Rebecca Zarutskie, “Understanding Bank Deposit Growth During the COVID-19 Pandemic,” Board of Governors, Federal Reserve System, June 3, 2022.
3 Tim Quinlan, Shannon Seery, and Sara Cotsakis, “What Explains the Staying Power of Consumers?” Well Fargo Economics, May 24, 2022.
4 Houston’s economic base contains upstream oil (producers, services, machinery, and fabricated metals) and downstream oil (refining, chemicals, and plastics). There are also pipelines, non-oil manufacturing, and selected sectors in construction, professional and business services, wholesale trade and air transportation. Calculations use location quotients for excess employment as drawn from a typical textbook. Also see Scott J. Brown, N. Edward Coulson, and Robert F. Engle, “On the Determination of the Regional Base and Regional Multipliers,” Regional Science and Urban Economics,” (1992), vol. 22, pp. 619-635.
5 We have produced several earlier reports and presentations with detailed discussion of the recent problems and dilemmas now faced by the U.S. fracking industry, including “Oil Picks Up the Pieces After Economic Shock: Recovery Now Begins for Oil Markets and Houston, Institute for Regional Forecasting, September 2020; and Adriana Fernandez and R.W. Gilmer, “Houston and the Future of American Fracking, March 2021
6 Natural gas rigs are another avenue for U.S. oil-related growth as its price has more than doubled to $8 per thousand cubic feet. The U.S. has become one of the world’s three largest exporters of liquified natural gas (LNG) along with Qatar and Australia. Europe is now working to reduce what has been substantial dependence on Russian natural gas, and these three large LNG-exporting countries are all striving to move into the European market with new LNG production. There is probably room for at least three more large LNG projects in the U.S. that can enter the market by 2024 and each will require long-term commitments by U.S. producers to supply the natural gas. A large new U.S LNG project has only recently come online and may be part of this current surge in the number of gas-directed rigs. Or it may simply be for new electric power or heating supplies as the pandemic ends. But the LNG provides a stable, investor-friendly environment for U.S. fracking. LNG will face ferocious ESG and environmental opposition, however.