Houston Updates
-
Archive
- June 2025
- March 2025
- December 10, 2024
- September 14, 2024
- May 21, 2024
- March 19, 2024
- December 9, 2023
- June 16, 2023
- April 6, 2023
- March 17, 2023
- Dec. 19, 2022
- Sept. 14, 2022
- July 4, 2022
- March 27, 2022
- March 9, 2022
- September 2021
- April 2021
- March 2021
- September 2020
- August 2020
- June 2020
- April 2020
- March 2020
- January 2020
- December 2018
- June 2018
- March 2018
- February 2018
- January 2018
- September 2017
- September 2017 Post-Hurricane
- June 2017
- March 2017
- January 2017
- September 2016
- March 2016
- December 2015
- September 2015
- June 2015
- March 2015
- December 2014
- June 2014
- March 2014
- November 2013
- September 2013
Houston and Low Oil Prices: An Update on the Economic Outlook
March 18, 2015
A high level of uncertainty continues regarding Houston’s economic outlook. There is uncertainty regarding the path of oil prices, about the ultimate extent of the ongoing decline in exploration and drilling (E&P), and even about the future of the U.S. fracking industry. Meanwhile, on the east side of the City -- and at the opposite end of the oil industry -- Houston is benefitting from an unprecedented level of petrochemical and other heavy construction along the Ship Channel, a building boom that is largely built on low natural gas prices. Combining the bad news in drilling with the good news in petrochemical expansion averages out so that Houston avoids the mild recession that current low oil prices would otherwise bring. At worst, we probably face several years of subpar growth.
An acceleration of local economic activity in 2014 was partly related to a high level of construction that was meant to catch up with past growth, especially the building of new homes, apartments, retail, and office space. Over the last two years, Houston moved onto every list of the best and strongest national real estate markets, and investment capital poured into the local metro area from around the world. Needless to say, the caution flags are now up, and the flow of capital for new commercial real estate projects has slowed to a trickle, especially for high-end apartments and office buildings. Many projects that started in the last few quarters will continue construction into the near future, adding to near-term growth through strong momentum. But the free rent signs are already up on many apartment and office buildings along Houston’s freeways, telling us that momentum will quickly peter out as the months wear on.
The economic acceleration in 2014 was also partly due to growth in drilling and fracking, with plans made for even greater exploration and production to take in place for the coming 12 months. Drilling picked up because of high revenues earned by natural gas producers during the polar vortex of the previous winter, and preparations were in place for the fracking industry to return to the oil fields in a big way in 2015. Even as the price of oil fell last autumn, the U.S. fracking fleet was already completely sold out for this year, with 2015 expected to be the biggest year ever for drilling and fracking. However, with the domestic rig count already down 34 percent in early March, it is clear that near-term stimulus to Houston’s E&P has moved from full speed ahead to full reverse.
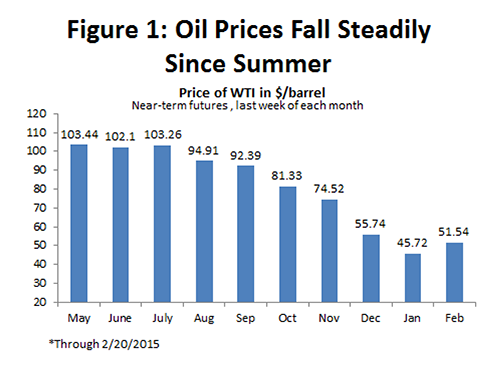
The economic outlook and low oil prices
The fall in the price of oil in recent months leaves Houston with highly uncertain economic prospects. (Figure 1) How far prices will price fall? How long will they be low? And what lasting damage will they bring to the domestic oil industry? Last December, with the price of oil near $60 and falling, we offered three possible scenarios as a means of illustrating how this oil price decline might ultimately affect the Houston economy. This article is an update of the December report, focused largely on the fact that there is now much more certainty of a steep decline in oil prices and the rig count. In the earlier report, we also speculated briefly on how current events will divide Houston’s economy between the industrial east and the white-collar west, with the east booming while the west feels much of the near-term pain. This article returns to that hypothesis, and better defines the extent and timing of this east/west division.
In all cases, our three energy-based scenarios assume that the U.S. economy remains strong from 2015 to 2018. This optimism about the U.S. economy stems from strong signals that it has at last put the aftermath of the U.S. financial crisis behind it. The consumer has deleveraged, working off a large debt load that was carried out of the financial crisis; housing is moving back on track; and state and local governments have seen their sales and property tax revenues largely restored to normal levels. With the exception of the first quarter of 2014, which was adversely affected by winter weather, GDP growth has been strong for 6 quarters, and 2014 turned out to be the best year for job growth since 1999. This assumption of strong U.S. growth is important to Houston, as a one percent increase in U.S. employment brings about 33,000 jobs to Houston. The 1.7 percent job growth assumed here means that – other things equal -- Houston starts each year with a base of about 50,000 new jobs.
The December scenarios considered two different levels of decline in drilling, depending on how far the price of oil would fall. The optimistic scenario was a 20 percent decline in exploration and production (E&P) spending in 2015, with cuts continuing through 2015, and restored by mid-2016. This would probably correspond to a very quick recovery in oil prices above $65 per barrel, and no more than a 30 percent drop in the rig count. It is still early in 2015, but a correction in oil markets would have to come quickly for this scenario to work, and is simply not anticipated at the present time. The optimistic scenario now has to be assigned a very low probability. The pessimistic scenario for drilling is a 33 percent cut in E&P capital spending that corresponds more closely to events that are currently playing out – corresponding roughly to $50 per barrel oil and a 50 percent cut in the rig count. Both scenarios assume that capital spending for E&P falls steadily over the first two quarters of 2015, stays down through the fourth quarter, but recovers to pre-bust levels by mid-2016.
The optimistic scenario assumes that fracking and E&P spending grow at 8 percent annually after drilling returns to 2014 levels, and the pessimistic scenario puts this growth at only 5 percent. Again, the pessimistic scenario seems to better fit the emerging reality. It is now apparent that part of the Saudi strategy in letting the price of oil fall is to push Texas and North Dakota fracking into the role of swing producer. For the past 40 years, every time a surplus of oil emerged in world oil markets, the Saudis assumed the swing producer role -- absorbing the surplus and stabilizing oil prices. Whether the surplus arose from economic recession, financial crisis, or OPEC cheating, the Saudis stepped forward. Now the North American oil producer is assigned the task of curtailing production and cleaning up the glut. For the Saudis, curtailing production might be as simple as turning a valve and loading a few less tankers. In Texas and North Dakota, it will be a far messier process, as dozens of American oil producers scramble to get the size of their company in line with cash flows that have been reduced by low oil prices – cutting capital spending, reducing drilling, and slashing employment. As a result, it is likely that American fracking emerges from the current downturn as a more cyclical and slowly-growing industry, facing a correction every time world oil markets are over-supplied.
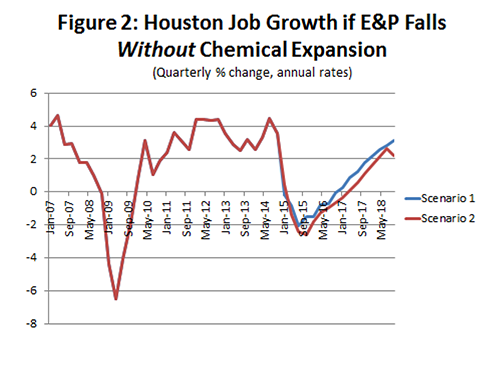
The consequences of low oil prices for Houston are illustrated in Figure 2. Even with help from a strong U.S. economy, either of these scenarios could bring a mild recession to Houston. Scenario 1 would mean 8 quarters of job loss in Houston, totaling 65,000 jobs or 2.2 percent of total employment; Scenario 2 brings a loss of 78,000 jobs or 2.8 percent. During downturn of the 2008-2009, Houston lost about 100,000 jobs, forced by a combination of financial crisis, brutal recession, and low oil prices. But in 2009 oil prices stayed below $65 for only about 6 months, while this time they are likely to be down for a year or more.
Good news from cheap energy
This is not the end of the story about important energy-related events that are currently affecting the Houston economy. On the east side of Houston, and as explained at length in the December report, a major construction boom is under way that is built on cheap energy – specifically built on cheap natural gas and natural gas liquids. We can now be more certain that many of these multi-billion dollar projects will continue, especially the large ethylene crackers in Houston and along the Texas Gulf Coast. Large companies with deep pockets, like Dow, ExxonMobil, and ChevronPhillips, will continue to build petrochemical projects right through the current period of low oil prices, working off the premise that the plants will begin production just as the price of oil rises, and the extraordinary petrochemical profit margins of recent years are restored. A further incentive to push ahead on these projects is that the drilling downturn will make available skilled labor and machine shop capacity that otherwise would have been in very short supply, thus reducing the cost and accelerating the construction of these plants. Many workers otherwise employed in the Permian Basin or the Eagle Ford are now likely headed to the Gulf Coast.
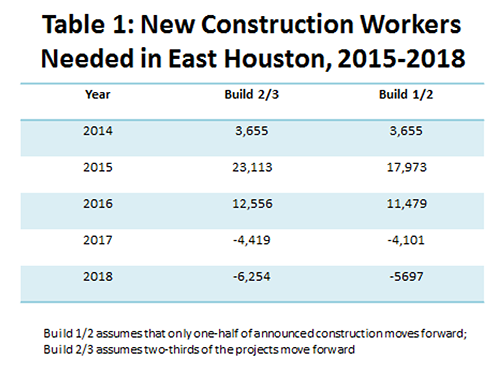
Projects will be lost to this period of low oil prices. One large ethylene project in Lake Charles has been delayed, for example. Planned export facilities for natural gas liquids like butane, propane, or ethane could be delayed or cancelled until the long-term future of North American fracking becomes clearer. Also, the current weakness in the global economy could raise questions about the wisdom of permitting more natural gas export facilities. Our December report made allowance for cancellations by assuming that 2/3 of projects continued in the high case, and only one half continued in the low case. Table 1 shows the current estimate of the number of workers required to meet these needs. A combined Scenario 1 – just as we built it in December -- includes a high level of drilling (a 20 percent cut) and a high level of construction going forward (2/3 of projects completed) while Scenario 2 is a 33 percent cut and only half the projects are finished.
Current conditions, however, are now strongly pointing to an intermediate scenario -- with heavy cuts in exploration and production combined with a high level of petrochemical and other large construction projects. If Scenario 1 is a high outlook and Scenario 2 is low, we will call this intermediate combination the Mix or Likely Scenario.
Scenarios and Job Growth
Table 2 summarizes the energy assumptions that go into the forecast for Houston employment, and it also shows how the economic impacts of these energy-related events change over time. The loss of jobs among oil producers and drillers is offset by an influx of construction workers in 2015-16. But as oil prices recover and upstream jobs begin to be restored in 2017-18, the petrochemical construction winds down. The construction work is temporary, offsetting upstream layoffs during the drilling downturn, but later – as the projects end – it dampens the recovery in oil producer and service jobs. The result is a moderation of job growth that extends through the end of 2018, allowing Houston to miss a boom and bust cycle, but also bringing a prolonged period of moderate job growth.
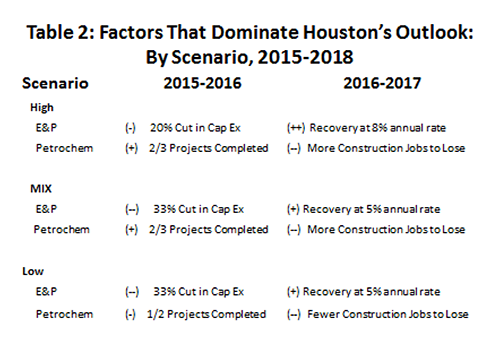
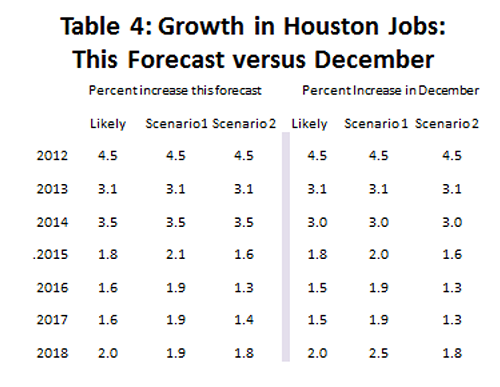
Table 3 summarizes the current outlook for job growth in Houston from 2015-2018 based in these three scenarios. They are calculated both as the four quarter change (Q4/Q4) and as the change in the average of four quarters (year-over-year). The numbers are slightly stronger for 2015 and 2016 than last December, and that is because of economic strength late in 2014 that carried forward into 2015. (Table 4) Also, there is a greater certainty that petrochemical construction moves forward, and that projects can be accelerated with more skilled labor and machine shop capacity available. The greatest difference between now and last December is that we can focus with much more certainty on the Likely or intermediate scenario – a combination of deep drilling cuts and high levels of east-side construction.
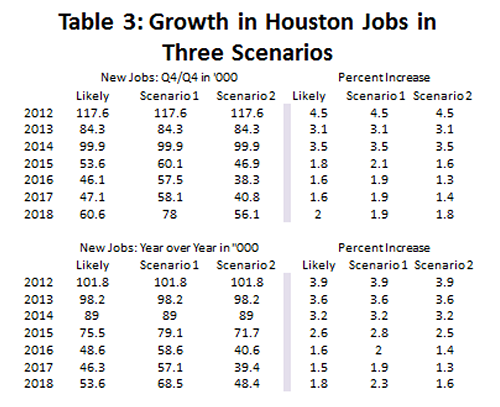
The employment numbers forecast for Houston are disappointing if they are compared to the last three years, which taken together delivered 300,000 new jobs. Growth from 2012 to 2014 nearly doubled Houston’s long-term average of 2.0 percent per year, while the forecast for 2016 and beyond moves all years below the long-term trend. At the same time, keep in mind the praise we earlier heaped on the U.S. economy for finally returning to a historically strong 1.7 percent employment growth rate. Over the forecast years, Houston’s average growth rate lags the US – but not by much.
The coming year will see Houston exit the freeway, where we have been driving 95 miles per hour for a long time, and the 40 mile per hour speed limit on the access road is going to seem very slow indeed. But so far, the facts do not add up to time spent in the breakdown lane.
Uncertainty in the Outlook
Imagine that you run a business carrying a heavy load across the river every day in your wagon. Because sink holes can form in the river, you carefully unload the wagon every day and take several trips to get your goods to the other side. But sinkholes haven’t formed in recent years, and it increasingly seems a waste of time unloading and loading the wagon – until, of course, the day that the sinkhole opens up and you lose everything. Oil prices are the sinkhole in this analogy, driving the wagon is doing business in Houston, and losing the entire load results from forgetting that oil prices will rise and fall when you least expect it. The recent decline in oil prices underscores how unpredictable oil prices can be, and illustrate the potentially severe consequences carrying too much risk.
We noted above that a 1.7 percent increase in U.S. job growth could bring 50,000 new jobs to Houston. Similarly, a one percent increase in Houston’s energy employment can bring 18,000 new jobs. Strong U.S. growth and a 3 percent jump in energy employment can put Houston on top of the world with 100,000 new jobs; or strong U.S. growth and a 3 percent decline in energy employment can wipe out all the gains provided by the U.S. economy. A 6 percent decline in energy-related jobs would bring on a mild recession. Counting 1982, this is Houston’s fifth oil-related downturn in the last 33 years. We live in a commodity-based economy that often seems like a carnival ride.
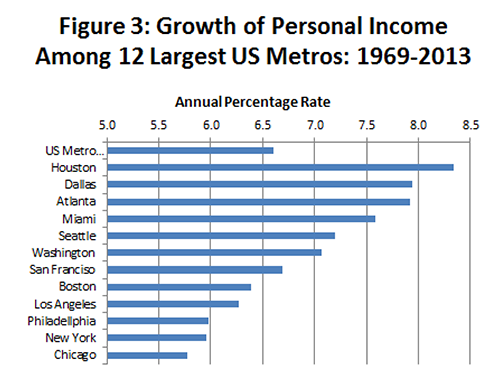
From a longer-term perspective, however, the performance of the Houston economy looks much better. Figure 3 lists the dozen largest metropolitan areas in the United States – New York, Los Angeles, Chicago, and so on. Among these dozen cities, and based on personal income growth from 1969 to 2013, the fastest growing are Houston, Dallas-Fort Worth, and Atlanta. Despite the mighty bust of the 1980s, and three other oil-related downturns, Houston has registered the fastest growth since 1969. Austin is not in the top 12 metros in terms of population, but it has grown faster than Houston or Dallas, as have border cities like Laredo and McAllen. There is clearly something in the Texas growth formula that works. To do business in Texas, you have to tolerate uncertainty and manage your way through unexpected short-term oil-market disruptions, but there is a long-term payoff for those that do so successfully.
Houston Divided East to West
Our December analysis speculated that the current drop in the price of oil will hit west Houston and the Energy Corridor much harder than the industrial east. Houston’s economy soon will be divided more or less along state highway 59 (now becoming I-69), with the east side booming with an influx of blue-collar workers, while much of the pain of $50 oil will be felt in the office towers on the west side. Can we illustrate this divide with numbers that confirm the reality and extent of such a split? To do this, we used zip-code definitions of West Houston and the Galleria, and compared them to an area centered in Baytown, but including a much wider area than Baytown itself. See Figure 4.
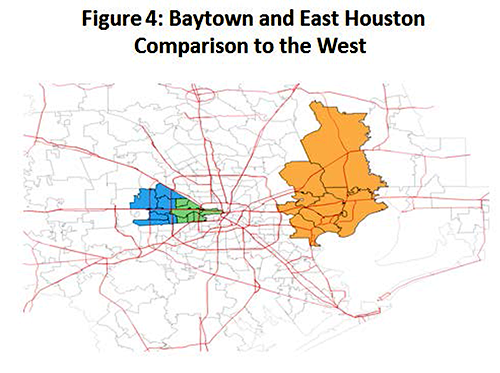
Table 5 below shows a series of industrial sectors that together provide a comprehensive description of the Houston metropolitan economy. Certain sectors have been selected for their high level of concentration in the Houston economy, and for their likely role in the on-going economic downturn. Two columns of numbers are shown. The first column is a concentration ratio – sometimes called a location quotient - that tells us if a particular industry is more or less concentrated in the Houston metropolitan economy. The ratio (Ri) is calculated as follows:
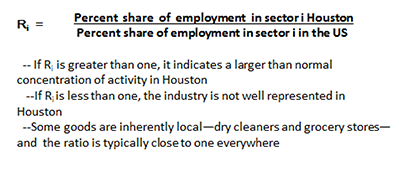
If Ri > 1, the industry is concentrated; if Ri < 1, the industry is not concentrated; if Ri = 1 or close to 1, it is typical of the US. A value of 1.15 means the industry is about 15 percent more heavily concentrated in Houston than the US, while 2.0 means about twice as concentrated. The concentration of energy industries in Houston is remarkable, and a good place to first think about what the ratios say. For example, there are 4.2 oil producer jobs for every job found in the typical US metro area. Similarly, the low concentration of information services (Ri = .64) means we are not New York, with its publishing and broadcasting, nor are we San Jose with it large cluster of information technologies.
The industries colored red are likely to be adversely affected by the current low oil prices. Oil producers and oil services will obviously be hurt by the on-going cuts in drilling. Regional and national headquarters are dominated by oil-related companies in Houston. Sectors such as Management, Scientific and Consulting Services or Administrative Services are heavily used by the oil industry as suppliers of out-sourced services. Out-sourcing is simply one way for a cyclical industry like oil to protect itself from downturns, by pulling work back into the company during periods of weak demand and making supplier companies bear the brunt of job cuts. These out-sourced activities will be subject to early cuts.
The green boxes will be subject to gains from current low natural gas prices, particularly as the downstream refining and petrochemical industries expand. The construction boom in east Houston is unprecedented in scale.
The yellow industries are on-watch for potential impacts or subject to cross currents from upstream and down. Steel, fabricated metals, machinery, pipelines, warehousing, wholesale trade, and engineering industries can serve both ends of the industry upstream and downstream, although individual firms in these industries may have little flexibility. These industries will all be cushioned to some extent by the petrochemical construction, but they will all – at a minimum – see their growth rate slow substantially.
It is important not to confuse our count of at-risk jobs with job losses. Only a small fraction of these at-risk jobs will be lost. But the process helps us understand which industry sectors are at risk, and below we will extend this analysis to see which geographies in Houston might be at risk.
For these colored boxes in Table 5 – all representing heavily concentrated and at-risk industries – the second column of the table shows their level of employment. Table 6 totals up the number of jobs in these industries. For example, the red boxes contain 366,786 jobs or 15.7 percent of the metro area total. Add to this the yellow cautionary boxes, and sectors containing 784,097 jobs will feel the effect of the downturn fairly directly, or 33.6 percent of the total. The green boxes have 207,437 jobs, or 8.9 percent of the metro total. This small fraction of positive effects is qualified, however, by the tremendous expansion of employment expected in construction over the next two years.
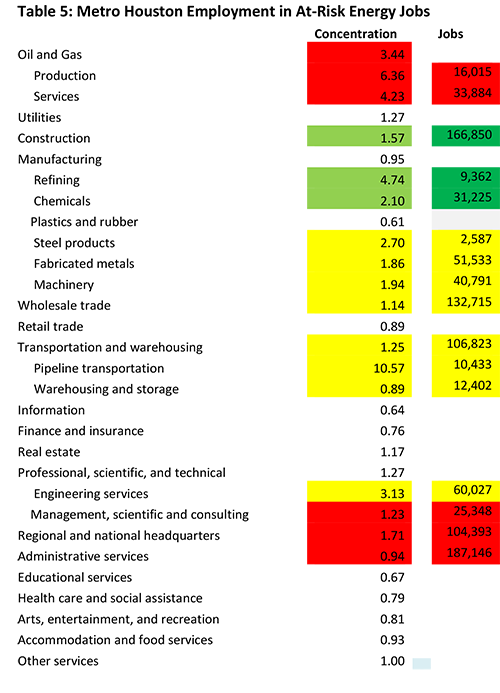
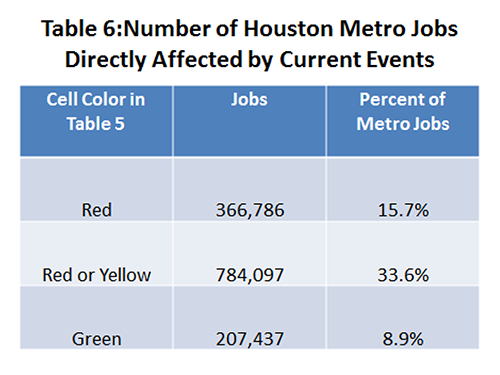
Table 7 shows concentration ratios specific to the east and west side, computed like those for the metro area as a whole, except the comparison in the denominator of the ratios is to the metro region.
Percent share of employment in sector i in east or west Houston
Percent share of employment in metro Houston
R is the percent share of the industry’s employment in each local area divided by the percent share for the entire metro area. They are interpreted the same way as Table 5, and we have applied the same system of color coding. Current economic events are negative for the sector if red, positive if green, and caution is warranted or they may be subject to mixed effects if coded yellow. The strong concentration of upstream drilling and exploration activities on the west side clearly requires more red, and we see more green on the east side.
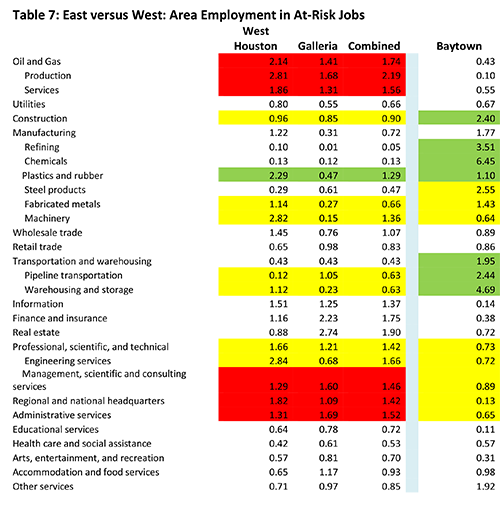
Table 8 uses concentration ratios calculated for both Houston’s east and west sides. The areas are the West Houston Energy Corridor and Galleria areas, and in the east, four zip codes in Baytown plus another four in the surrounding area.6 Table 8 shows the concentration ratios for the west divided by 17 the Baytown ratios, which are interpreted very easily by industry. If the number if equal to one, the west side is equally as strong as the Baytown area. If the number is greater than one, the west side is stronger; less than one and the east side is stronger. As the number gets bigger, the west side becomes stronger; as it gets smaller, east Houston has the advantage.
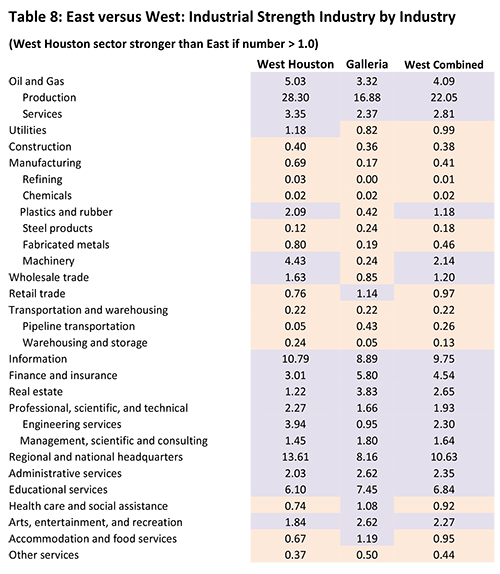
Stereotypes and our predisposed ideas about a subject don’t always match up to carefully chosen facts and specific numbers. In our case, the employment figures, and their distribution by industry, fully match expectations. For example, the Energy Corridor is home to many oil producers and oil service companies, and the west is far stronger in exploration and production than the east side. Construction in 2012 was already dominated by the east side, even though the current petrochemical expansion was barely gaining momentum at the time. Refining, chemicals, steel, and fabricated metal are east side activities; much of the machinery industry that supports drilling and oil production is located in the west. West side strength in plastics is the manufacture of plastic into products, not the huge plants of the east. Transportation and pipelines are in the east, while finance, information services, real estate, engineering, corporate headquarters, administrative services, and arts and entertainment are in the west. The blue-collar/white-collar stereotype of east and west Houston is strongly borne out by these numbers.
The east/west split is real, and the west will feel the chill of a significant slowdown in drilling. The help to the west from the temporary boost to construction employment will be limited. In fact, in the earlier report and in our calculations, we assume that it takes two construction workers to offset the loss of a white-collar office job in the west. The problem is not compensation, as many of the skilled and unionized construction workers in east Houston will easily earn $100,000 annually with overtime. And the construction work can keep Houston’s base of machinery and fabricated metals industries busy, most of it located in northwest Houston. A major problem will be a lack of linkages from temporary construction work back into single-family homes, high-end apartments, luxury retail, and office space. The total job figures each year say moderate growth for the local economy, but they do not add up in such a way that they support the class and income distinctions that are the hallmark of the west side of town.
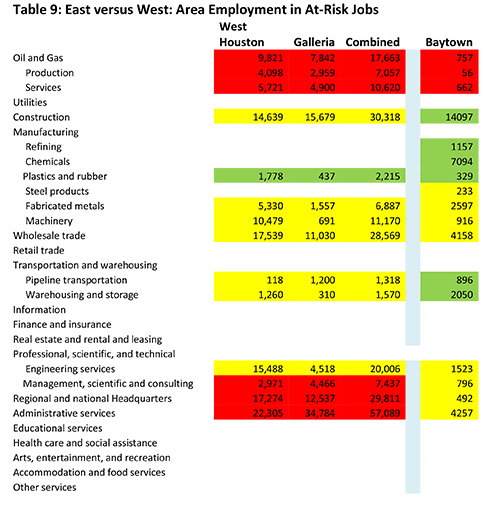
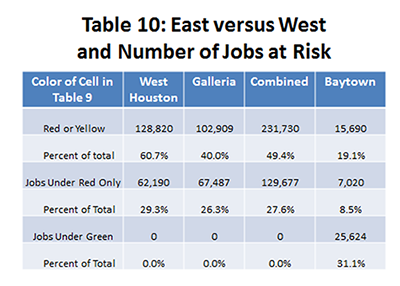
Table 9 shows the employment associated with color-coded cells. As before, these are potential high-impact jobs in the sense of being concentrated in either east or west, and at risk of being affected strongly by current events. Table 10 totals up the numbers associated with these cells. By dividing up the east and west sides, and being specific about the geographic split, far fewer jobs are at risk than in Table 6 that looked at the combined metro area. Over 784,000 jobs were coded as at risk in Table 6, while only 247,420 jobs are now in red- or yellow-coded industries affected directly by current energy prices. There is, however, a definitive split between east and west. West Houston has 60.7 percent of its jobs in red or yellow cells, and the Galleria has 40.0 percent, while east Houston has 19.1 percent. Nearly 30 percent of west Houston jobs are in red cells, with only 8.5 percent on the east side. Not only is the blue-collar/white-collar stereotype fitting the data, we also find the impact of $50 oil skewed to the west side of the metro area.
Our color coding is used to isolate jobs in sectors that will be almost immediately impacted by the decline in energy prices. These are jobs directly in oil and gas exploration, or closely-related such as machinery, corporate headquarters, and engineering services. However, the effects will ultimately spread much wider. Every job in the energy industry supports about four others. The coding catches only the most closely related industries, those probably laying off workers early in the downturn. Ultimately, the loss of employment and income spreads to the level of dry cleaners, grocery stores, retail, gasoline stations, finance, real estate, and many other local activities that have nothing to do with oil and natural gas. However, to the extent these local industries serve customers affected by the downturn, the energy cutbacks ultimately reach far into the economy. The industries isolated above will see job cuts early in the economic decline – but that ultimately trigger widespread losses throughout the metropolitan area.
The economic wheel does turn, however, and as shown earlier in Table 2, by 2017 we expect to see recovery in oil prices, the return of white-collar jobs lost to the downturn, and resumed growth in exploration and drilling. As chemical and liquefaction plants are completed in the east, momentum again shifts to west Houston with the recovery of oil prices. Permanent white-collar jobs replace the construction jobs in the east, and demand for single-family housing, luxury apartments, and office space begins to grow again.
If a couple of years ago we had been forced to choose a time for oil prices to decline sharply, it probably would have been right now. As painful as upstream losses will be, the US economy is now growing strongly and delivering as many as 50,000 jobs per year. This is also the moment when the petrochemical construction begins to really lift off, and it will quickly begin creating large numbers of new jobs. East Houston’s current good luck brings bring a period of moderate growth to the metro area, and keeps the metro area out of the mild recession that the current drilling downturn would otherwise bring.
Notes
1 This forecast was completed before the Houston data was re-benchmarked and revised. However, most of the revisions could be anticipated from other published data, and we applied preliminary revisions that moved the figures in the right direction and much closer to the final estimates. Revised employment growth in 2013 and 2014 turned out to be 89,900 and 104,300, respectively; the estimates used in this forecast are 84,400 and 99,900. Both years will be subject to further revision.
2 R.W. Gilmer, “For Better and For Worse: Oil Still Drives Houston’s Economic Outlook,” Institute for Regional Forecasting, University of Houston, December 17, 2014, http://www.bauer.uh.edu/centers/irf/houston-updates-dec14.php
3 A number of reports confirm the high likelihood of completion for the Texas ethylene crackers and associated plastics plants. For example, see Goldman Sachs, “The Ethylene Advantage Has Evaporated; Is the SuperCycle Over?” December 11, 2014. Also, BASF recently announced a $600 million ammonia plant to take advantage of low natural gas prices in late February. “$600 million ammonia plant in Freeport gets green light,” Houston Business Journal, February 27-March 5, 2014, p 4A.
4 In North America, petrochemicals are made with natural gas liquids such as butane, propane, or ethane, liquids that are priced much like natural gas. The rest of the world primarily uses oil-based naphtha, priced like oil to produce their petrochemicals. The result has been enormous competitive advantages and profit margins for North American producers with oil priced at $100 per barrel, and natural gas at the equivalent of $20-$30 per barrel. Much of this advantage has been lost with the decline in oil prices, but no one believes the price of oil will stay this low forever. Higher oil prices by 2017-18 mean the return of high profit margins for these chemical plants.
5 The areas are defined by zip codes that are added together to form the regions. Payroll employment data by zip code from County Business Patterns is used to analyze the industrial structure of each of the three areas, and to determine their susceptibility to the current downturn. West Houston zips include 77041, 77042, 77043, 77077, 77079, 77082, and 77084. The Galleria are includes 77077, 77024, 77027, 77055, 77056, 77057, 77063, and 77080; and Baytown is 77520, 77521, 77522, 77533, 77530, 77532, 77535, 77562, 77571, 77580.
6 This analysis was originally carried out for a presentation to the membership of the Houston West Chamber of Commerce, and the areas chosen reflect the Chamber’s service area. They have no responsibility for the results shown here, nor do they necessarily endorse the outcome.
7 These are white-collar jobs in oil production and oil services. Virtually no drilling is done in the Huston area. Houston is the administrative and technical headquarters for the American oil industry. See R.W. Gilmer, “Houston: America’s Oil Headquarters,” Tierra Grande, Texas A&M Real Estate Center, Publication Number 2015, January 2014, http://recenter.tamu.edu/pdf/2051.pdf.
8 The production of massive amounts of plastics from chemicals, sold and shipped by the railcar, is on the east side, and has by far the greater economic impact measured by sales or output. These capital–intensive plants provide few jobs, however. Processing plastic into final products – water bottles or coolers – provides less output, but requires more jobs. The apparent strength of plastics on the west side is based on the employment measure we use.
9 Again, it is important that the number of jobs at risk not be confused with the number of jobs potentially lost. Only a small fraction of at-risk jobs in the sector will become jobs losses. But the analysis tells us where jobs losses might come from, both by industry sector and by geography. The nature of the on-going downturn pushes economic risk to west Houston.
Written by:
Robert W. Gilmer, Ph.D.
and
Adam W. Perdue, Ph.D.
Institute for Regional Forecasting
March 18, 2015