Houston Updates
-
Archive
- June 2025
- March 2025
- December 10, 2024
- September 14, 2024
- May 21, 2024
- March 19, 2024
- December 9, 2023
- June 16, 2023
- April 6, 2023
- March 17, 2023
- Dec. 19, 2022
- Sept. 14, 2022
- July 4, 2022
- March 27, 2022
- March 9, 2022
- September 2021
- April 2021
- March 2021
- September 2020
- August 2020
- June 2020
- April 2020
- March 2020
- January 2020
- December 2018
- June 2018
- March 2018
- February 2018
- January 2018
- September 2017
- September 2017 Post-Hurricane
- June 2017
- March 2017
- January 2017
- September 2016
- March 2016
- December 2015
- September 2015
- June 2015
- March 2015
- December 2014
- June 2014
- March 2014
- November 2013
- September 2013
Houston Returns to Growth: How Fast Can We Move Forward From Here?
June 18, 2018
There is a lot going on in the Houston economy right now: Hurricane Harvey, Donald Trump’s tariff policy, restoration of Iran sanctions, rising oil prices, the Tax Cuts and Jobs Act, the Fed … and on and on. It might be a good idea to lay out a brief agenda for this report, otherwise it might seem that it lacks direction or loses focus. But the bottom line is to fit together all the pieces of this complicated puzzle, and to define the outlook for Houston’s economy.
First, the news on Houston is much better than recent years. After two years of no growth in Houston through 2015-16, last year marked a return to slow to moderate job growth. The key question today: How fast can we move forward in 2018 and beyond?
Second, from an economic perspective, Hurricane Harvey’s impacts are largely behind us. The major short-term effect on jobs, construction, and spending ended late in 2017, although mop-up work on construction and infrastructure will remain active for many months to come. Harvey will be a slight drag on the economy in 2018 as clean-up and restoration slowly come to an end.
Next, we need to be careful with our job numbers from last year – primarily because Harvey has exaggerated them substantially. The Houston job numbers are much improved based on the performance of the economy – but not nearly as good as the addition of Harvey’s one-time, temporary jobs make them seem. We will also share some reservations about the size of the early 2018 employment estimates.
In addition, we have been waiting three years for oil prices to return to $60-$65 per barrel, and we arrived there in early 2018. Then political risk in the Middle East ran oil prices up even higher. But moving oil up from here, or even keeping the recent $60 price, may prove to be hard slogging. Higher prices failed us last year at this time, and we are currently in the middle of a test to see if prices really hold through 2018.
Finally, the U.S. economy is in great shape right now. All the data remain very solid. However, there are growing risks: from interest rates, tax cuts and deficits, and from tariffs. How these risks develop through 2018-19 will determine if the U.S. outlook might change significantly.
The trick will be in pulling all this together, and to come up with an economic forecast for Houston in 2018 and beyond. We need to stress that the current news on Houston – with help from Harvey and oil markets – can easily look much better than the current reality. The bottom line for Houston in 2018 is likely to be continued growth at a moderate rate.
Putting Harvey Behind Us
Harvey was a devastating event. The University of Wisconsin labeled it a thousand-year storm, with no rainfall precedent in the history of North America. Major storms typically leave us much poorer, and in the case of Harvey it was some $80 billion poorer. We took a major hit to our balance sheet and to our net wealth. But we have to be careful in labeling Harvey – or other storms -- as a setback to the economy.
When we talk about economic progress, we usually mean employment, income and production. There are two phases for a storm like Harvey. We lose work and wages with the passing of the storm, as we close everything from small shops and restaurants to giant plants on the Ship Channel. But we then find good employment prospects from storm-related spending and reconstruction, and plenty of overtime available for a few weeks. If Harvey works like other storms in Houston, there will be a small net change in the economy -- a small plus or minus as clean-up efforts offset the shelter period.
Data in Figure 1 from Harvey and seven other billion-dollar storms reaches back as far as Alicia in 1983. This was a major statistical project on our part, and the first two columns show the impact of the storm on the broad Houston economy measured in two ways: the percent change in payroll employment or in the Dallas Fed Business Cycle Index. Their effect on Houston is measured six months after each storm. The Houston BCI includes payroll employment, as well as the unemployment rate, real wages, and real retail sales. If no values are shown, there is no meaningful chance that the storm affected the economy. If a value is shown, there is at least a 75% chance it affected the economy after six months, and if the value is in bold there is 90% chance.
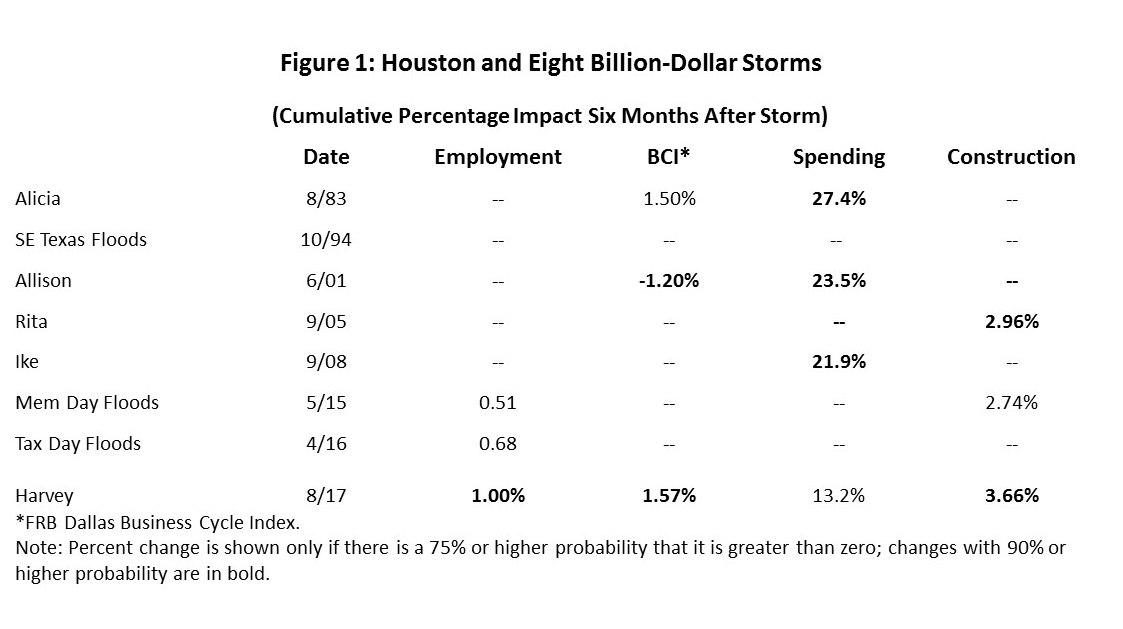
Allison caused small negative percentage changes to the local economy, while the effects of Alicia, the Memorial Day and Tax Day Floods, and Harvey were also small but positive. Only Allison and Harvey had economic impacts that reached 90 percent levels of statistical significance.
There are big changes in spending and construction resulting from the storms and seen in columns three and four of the figure. These are the changes that give the economy its storm-related boost and offset the losses of the shelter period.
Figure 2 – from the same statistical study -- shows the timing of Harvey impacts by month. They are again calculated apart from whatever role the economy was playing in the employment data. On the left is the month-by-month percentage change through January in either employment or the Houston BCI attributable to Harvey. Economic losses are large and negative in the August shelter period, turn positive for three months, but then the economy adds no more storm-related jobs after December.
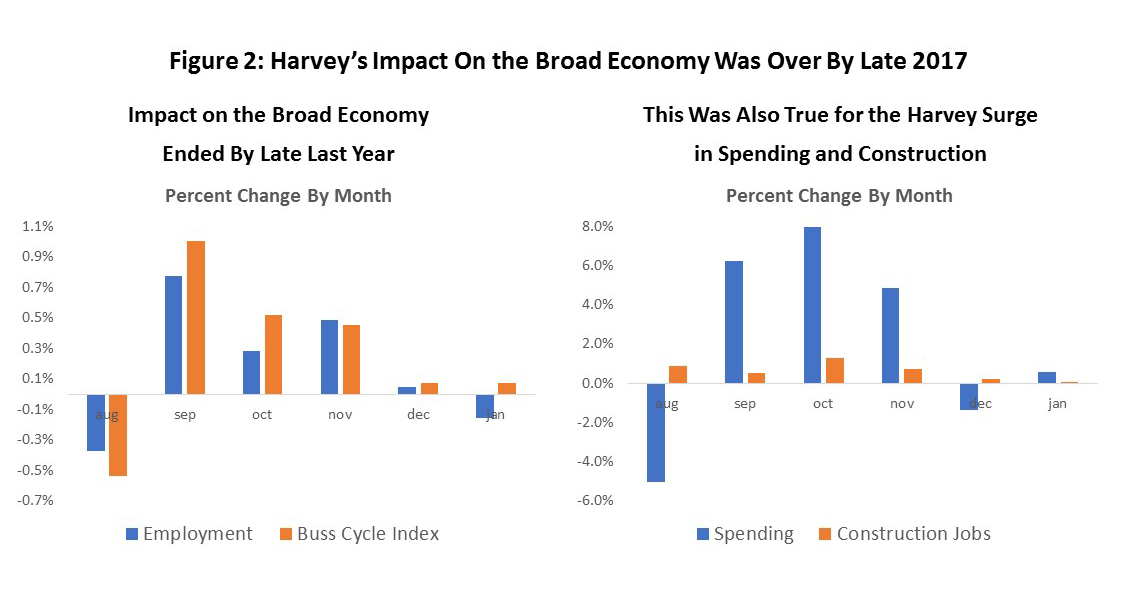
The same results are seen on the right side of Figure 2 for storm-related spending (the taller bars) and for construction employment. The shelter effect is there in August, and the big positive effects are over by November/December. We can expect to see a long, slow fallback in construction activity in 2018, and the decline will be a moderate drag on Houston’s economy for months to come.
The estimate of Harvey-related spending is based on the City of Houston allocations for sales tax revenue. The 13.2 percent increase that can be counted as Harvey-related is based on the August 2017 allocation level (seasonally adjusted and in 2017 dollars) of $49.5 million, or a Harvey-related net surplus of $6.8 million in tax revenue. With a penny tax rate, total taxable spending in the City of Houston related to Harvey was $675 million.
Unfortunately, there is not enough METRO MTA monthly data to repeat previous estimates for the City. However, we can make similar (if less exact estimates) using our quarterly models. For the City of Houston, the quarterly estimate is $7.94 million in Harvey-related allocations, and for METRO the number is $12.44 million. The bigger Harvey impact for METRO is partly due to the larger METRO service generating 12.8 percent more revenue in late 2017, but mostly because the Harvey impact was bigger outside the City.
Harvey exposed major shortfalls in our flood control infrastructure and management, and how we respond will determine future economic risks for the region. The City and Harris County have responded with new restrictions on building in the floodplain. Congress has allocated money, and studies are underway. Continued progress on flood control is essential to protect the economy.
In the past, Harvey and the other seven storms had adequate protection for the Houston economy. But we continue to ignore warnings from storms like Ike and Harvey at our own risk. New Orleans, Puerto Rico, and 1900 Galveston ignored clear signals that that their flood-control protection was inadequate, and each suffered deep economic damage as a result – the dikes overcome in New Orleans, the electrical system collapsed in Puerto Rico, or a barrier island inundated with no seawall in Galveston. With appropriate infrastructure in place, the rules concerning small plus or minus impacts on the economy hold up well; without the proper infrastructure, the local economy is at risk.
Resetting the Clock on Houston’s Job Growth
The Fracking Bust began in late 2014 and was perhaps the worst downturn in the history of American oil if measured by the percent decline in the rig count, by the lowest level of drilling activity in U.S. history, or by the huge loss of oil-industry capital spending. However, the worst seems to be behind us now, and we are now seeing a turn in oil prices, as well as the return of oil jobs in moderate numbers. So how do we reset expectations now? The last boom and bust cycle in oil seems to be over, but does the current recovery mean a return to boom times? Or something more moderate? How should we think about cyclical events in front of us?
There is unqualified good news about Houston’s outlook. As bad as it was for the oil industry in 2015-16, Houston’s economy held on with no recession during the downturn. Despite losing 75,000 oil-related jobs, the worst Houston saw was two years of no growth, and in 2017 the city returned to slow recovery. Unlike the 1980’s, the combination of a growing U.S. economy, help from downstream industries, and momentum from the boom years kept Houston out of a significant downturn.
On the surface, the current economic news on Houston’s economy could look like a huge turnaround. But be careful when you dive into the numbers.
- For example, revised estimates of 2017 job growth jump to 57,800 measured December to December, a number that would reflect a return to normal growth for Houston. However, 36,500 of the 2017 jobs were temporary and due to Hurricane Harvey. The number of new jobs attributable to a better economy in Houston were more like 21,300.
- WTI is back at $65 per barrel, indicating a rebalancing of oil markets for the first time since late 2014. However, high oil prices depend on producer discipline, i.e., that we will see no big jump in drilling activity in 2018. Without this discipline? Then oil prices fall, and drilling programs could shrink again.
- Local population growth in 2017 was reported as a robust 94,417. However, this increase was the weakest since 2010, and the third weakest since 1997. Just having nearly 7 million people living in Houston generated the big growth numbers. Births and deaths are not the economic driver from population growth, but net migration. While international net migration remained small but positive, domestic net migration into Houston turned negative in 2017.
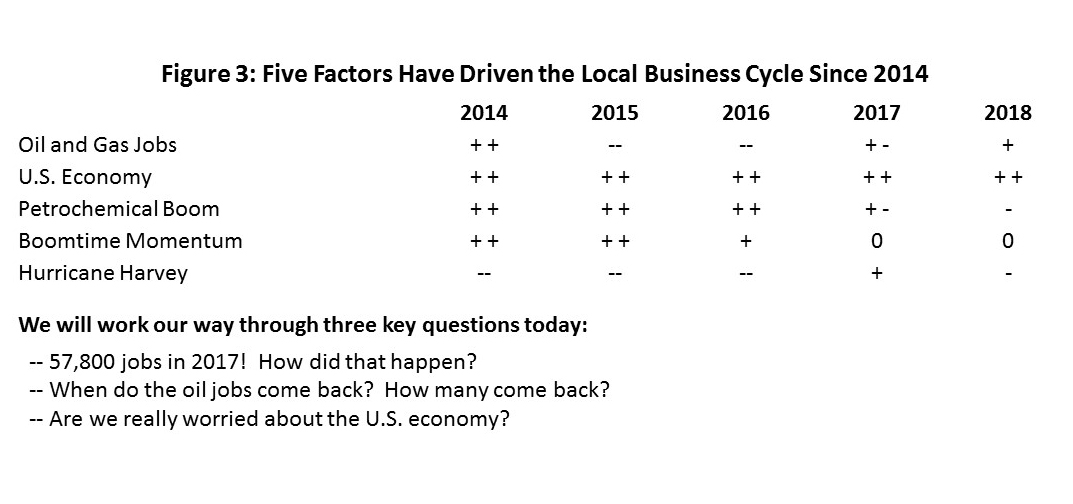
Figure 3 explains how we missed a major downturn in Houston in 2015-16. Four key factors combined to define the important changes in the economy throughout this period, and we add Hurricane Harvey at the end of 2017.
- Oil was a big double-plus in the boom leading up to 2014, then quickly turned into a big double-minus. We lost 75,000 oil-related jobs by the end of 2016.
- While it has not been economic boom-times for the U.S. economy in recent years, we have grown at a steady pace since 2012, and continue to improve nicely in recent months. U.S. expansion has been essential to Houston’s economic health since the price of oil fell in 2014.
- We came out of the oil boom with tremendous economic momentum that carried us through 2015 and much of 2016. The 700,000 local jobs added from Dec 2003 to Dec 2014 resulted in huge demands for general commerce such as retail and restaurants, as well as from schools, hospitals, roads, and general infrastructure. That momentum held through 2015 and much of 2016, but now is largely spent.
- A major construction boom on the Ship Channel ($50 billion in capital spending) carried us through 2016, but it began winding down quickly last year. As construction jobs are lost, the reduced workload becomes an active drag on the current economy.
- Finally, Harvey-related spending and construction drove a surge in employment through late 2017. But as Harvey-related jobs slowly dwindle, they also become a drag on local growth.
Where do we stand now? Note the contrast in Figure 3 between 2016 and now. Of the five economic drivers – oil and gas, the U.S. economy, petrochemical construction, momentum and Harvey – only oil and continued U.S. expansion are left as contributors to the local economy. The rest are neutral or a drag on current growth
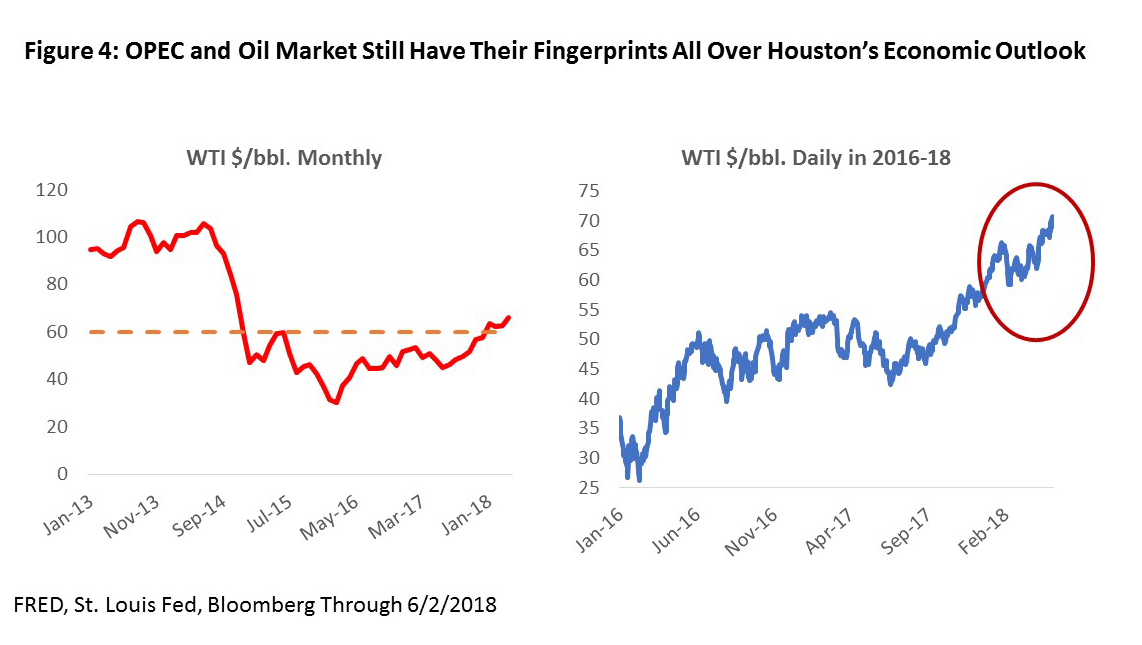
As we reset the clock on local growth, OPEC remains the most important actor. The cartel, and especially the Saudis, have had their fingerprints all over the oil downturn from the beginning, driven by deep concern about the rapidly-growing American fracking industry. Figure 4 shows that after briefly falling as low as $26 per barrel in 2016, oil prices pushed back to $50 again by June of 2016.
Various forecasters, including the Energy Information Administration (EIA) and International Energy Agency (IEA) announced that oil markets were ready to rebalance in late 2016, so OPEC chose that moment to return as swing producer. Claiming it would control oil prices again, OPEC said it “Would do whatever was necessary …” to accelerate a return to higher oil prices.
OPEC’s actions set off a tremendous burst of enthusiasm in oil markets and in Houston’s economy, as oil briefly jumped to $55 per barrel. Unfortunately, as we moved into 2017, oil prices returned to $45 by May, and remained mired there for much of the year. But OPEC came back again late last year with another agreement – with more producers signed on, and with more stringent oil quotas -- and they have had some success.
In fact, price is back at the $60-$65 price that we think of as the sweet spot for oil – not too hot, not too cold. And political turmoil in the Middle East – in Iran and Saudi Arabia most recently – has pushed oil prices higher at times. A key question for the current economic outlook is whether this latest agreement can hold together as we move forward. I will give reasons later why higher oil prices still might mean trouble ahead for the local economy.
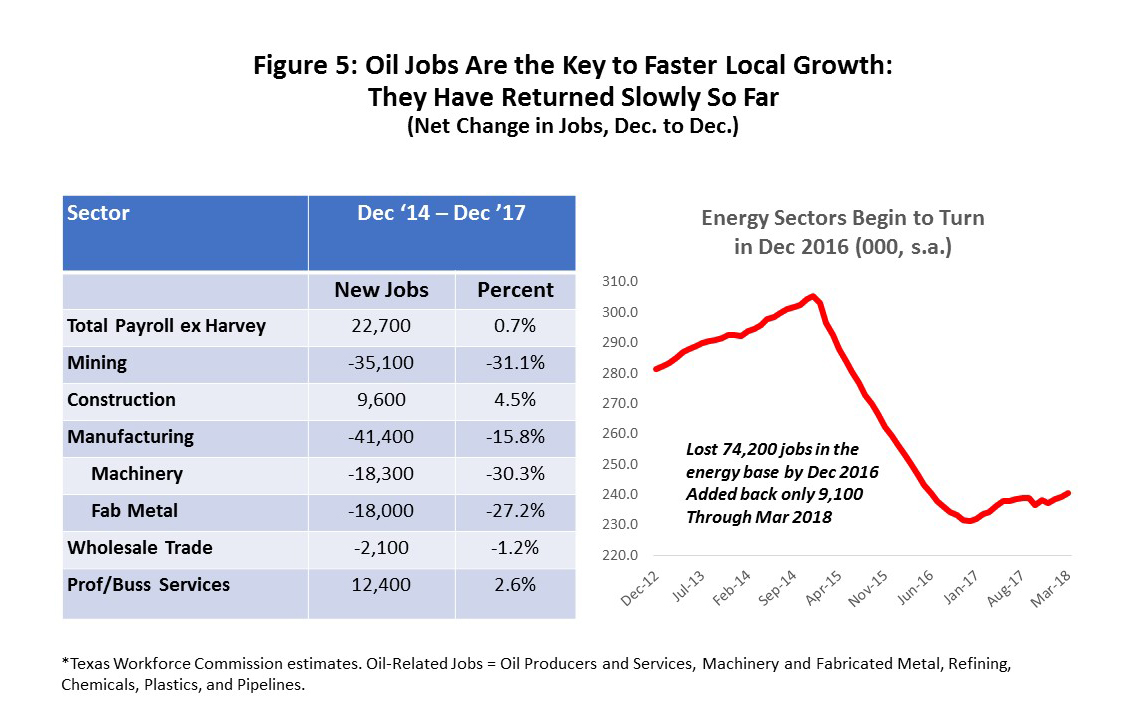
It is also important to note, that higher oil prices are great, but they also have to translate into growing oil-related employment. In Houston, the return of oil jobs has been a slow process in 2017 and early 2018, and Figure 5 summarizes where we stand today.
- Mining and manufacturing sustained major losses through 2016, with 35,100 jobs lost in mining, and most in oil services.
- Construction still had small gains through 2016. The data simply don’t let us split construction into losses in residential and commercial real estate versus the petrochemical boom.
- Manufacturing losses are concentrated in machinery and fabricated metals – most are tied directly to drilling.
- Professional services include many outsourced services to the oil industry, certainly engineering services, plus accounting, payroll, personnel, etc.
- The data on total energy jobs show a jump in November 2016 with the first round of OPEC cuts, they then peaked briefly in May of last year, and are now growing slowly. They are up about 9,100 jobs over the last 17 months.
Houston Fundamentals Today
Payroll employment data is the best information available on Houston’s economy: it is the timeliest, most detailed, and ultimately most reliable. We used this data earlier to describe Houston’s oil jobs, and now turn to total employment estimates, including the effects of Harvey. Finally, we illustrate the recent loss of momentum in Houston’s secondary service industries.
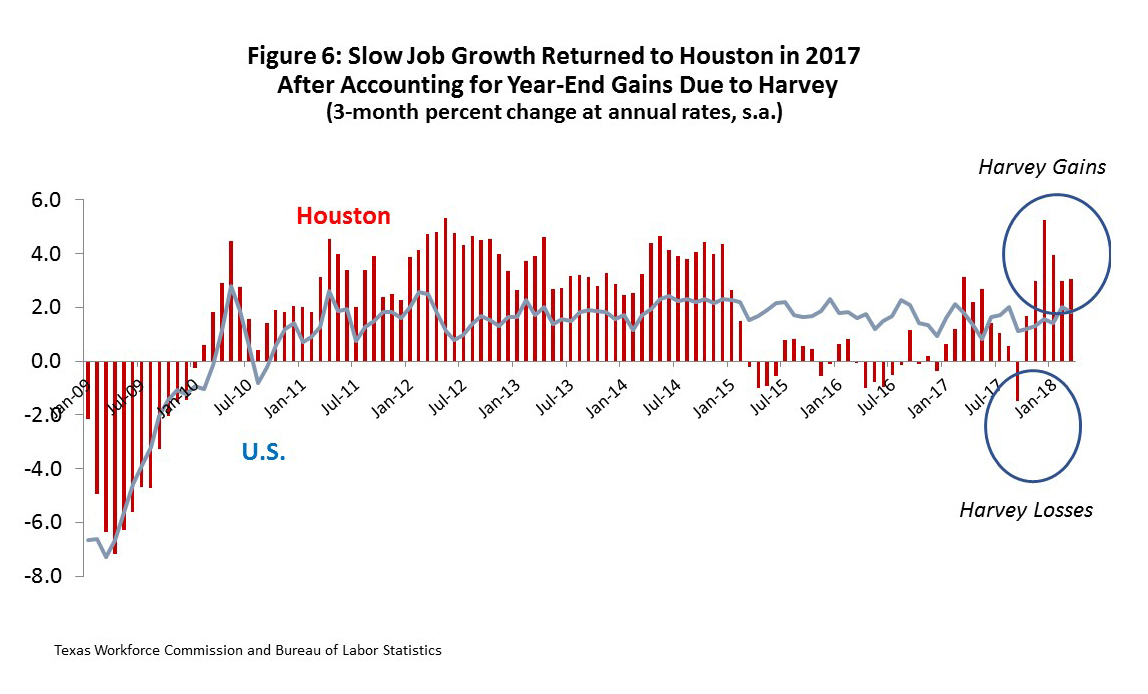
Figure 6 shows recent local economic history based on total payroll employment data. Houston came to the Great Recession later, did not go in as deeply, and recovered at about the same pace. But after the recession and through 2014, the taller red bars tell us that Houston out-stripped the U.S. in job growth by a wide margin. Indeed, since the recession ended in 2009 and through the end of 2014, Houston employment grew at 3.3 percent annual rates, the U.S. at about 1.3 percent.
Houston’s advantage held only until late 2014. It is remarkable how fast the drop in the oil prices shut down local job-growth, and how fast Houston and the U.S. changed relative positions regarding growth. Local job losses held near zero through 2015 and 2016. Then note the burst of job growth at the end of 2016, carrying into 2017, only to disappear just before Harvey approached. This brief burst was OPEC momentum gained in early 2017, lost by the summer, and then followed by a large number of Harvey-related jobs at year-end.
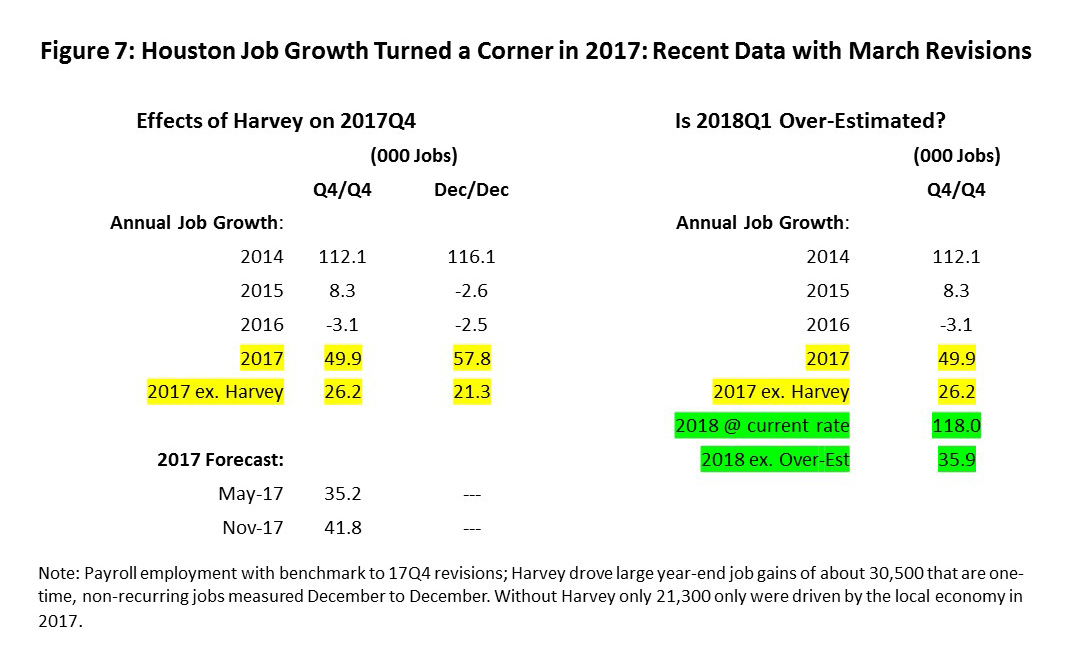
How big was the Harvey contribution? Based on the same statistical analysis done earlier on Harvey and the economy, we currently estimate that of the 57,800 jobs added Dec/Dec in Houston, about 34,700 were attributable to Harvey, and 23,100 could be attributed to fundamentals in the economy. (See the left side of Figure 7) After two years of zero growth, local jobs turned positive in 2017 – but not by much. Normal job growth in Houston is about 60.000 jobs or two percent. Taking only economic conditions into account, 2017 fell short of a respectable year.
The 2017 results are in line with our expectations. The IRF forecast is based on quarterly data and excluding Harvey-related jobs, the 2017 economy brought 26,200 jobs. Our May forecast was 35,200 jobs – and of course, did not include Harvey. Our forecast last November was 41,800 jobs – but including Harvey. Our sin here was under-estimating Harvey’s 23,700 jobs in 2017Q4.
The right side of Figure 7 shows recent data for early 2018Q1, but which seem way too high even if we allow for another burst of optimism about the new OPEC accord. The TWC sample has a long history of going astray at turning points, and this seems likely to be one of those times. Perhaps this should not be surprising, operating with a small sample and on a base of 3 million workers.
If the current sample estimate for the first quarter was extrapolated forward to all of 2018, it would imply 128,000 new jobs or a quick return to the peak of the fracking boom and more. Based on the current performance of the U.S. economy and the rate of return of energy jobs, our model estimates only 9,200 new jobs in the first quarter, or 36,600 for the year. We will stick with the lower figure for now. While Houston’s economy is improving, a return to the fracking boom seems a very long reach right now.
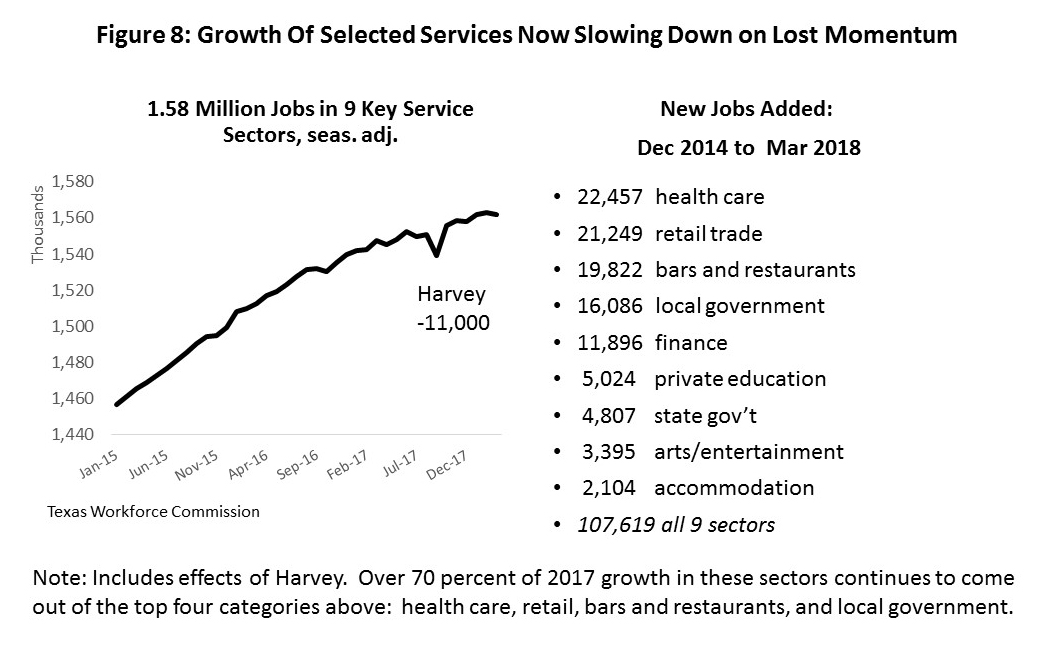
Momentum from the boom years carried us so strongly through 2015 but now shows signs of winding down. Figure 8 shows nine service sectors that were major beneficiaries of the boom years, and that together added over 107,000 jobs after the fracking bust began. Importantly, this growth in services persisted for 3 years after the fracking bust began; the combined nine industries grew at 3.0 percent annually from 2012 and into 2015, slowed only to a 2.5 percent rate in 2016, then finally to only 1.7 percent last year.
The sustained momentum from boom time growth was a huge lift to Houston in the years of the oil downturn, but it is now going to be slow to restart. Lost momentum, a moderate U.S. expansion, and relatively slow population growth make it difficult to jump-start these secondary industries.
Demand and Supply of Oil
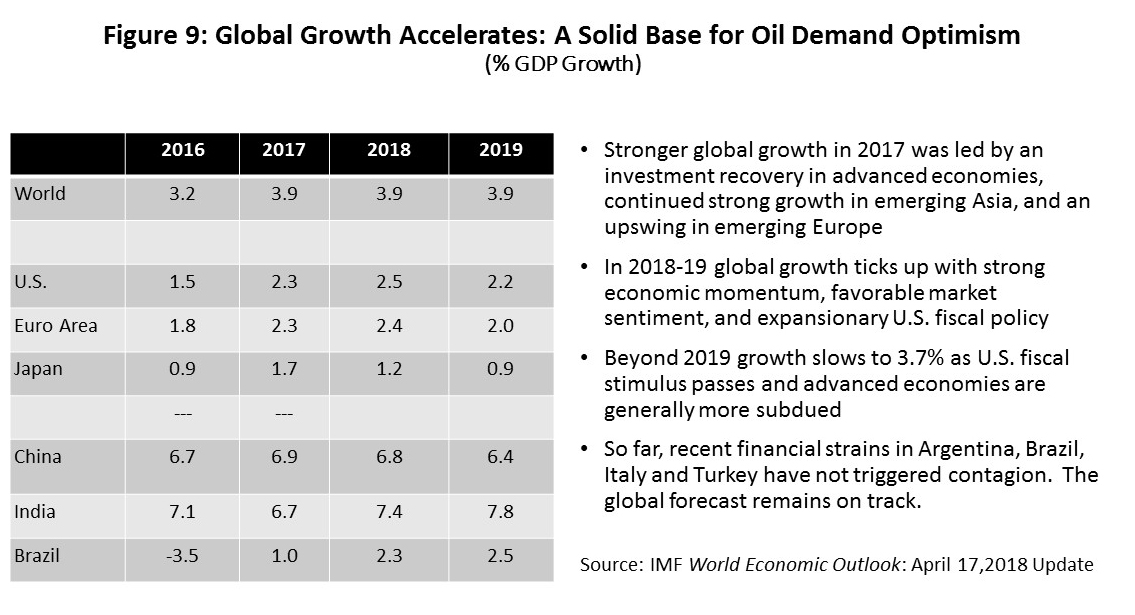
Rapidly changing headlines in the developing world include financial stress in Argentina, Brazil, Italy, and Turkey, and for the rest of the world we have tariff disputes and the U.S.-North Korea Summit. (Figure 9) So far, none of this turmoil seems to be enough to throw the global economy off track. The April economic outlook from the IMF is for 3.9 percent GDP growth in 2018 and 2019. We have finally moved above the long-term trend of 3.6 percent following the global financial crisis of 2007-09.
The move to higher growth has been led by a stronger Europe and with help from fiscal stimulus in the U.S. China has slowed from GDP growth at the seemingly perpetual 10 percent rate of a decade ago to the current steady 6 percent. Indian economic reforms continue to put the country on a stronger growth path than only a few years ago, helping replace GDP losses to China. Brazil is now back from its Olympic-year recession, though not growing strongly on the standards of a healthy developing nation.
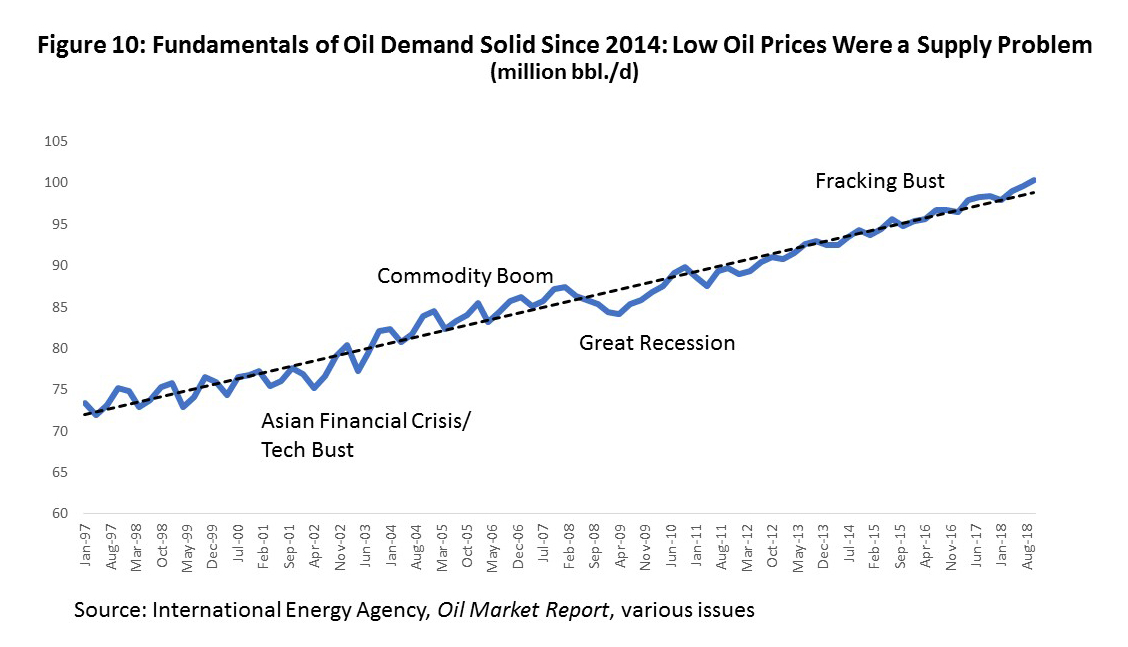
While this adds up to a stronger economic outlook and to stronger global oil demand, it is an incremental improvement. The demand for oil has been quite strong throughout the Fracking Bust period. Weak oil prices since 2015 have been supply problems -- not about demand. Despite all the talk of peak demand for oil, global usage continues to tick up steadily and year-after-year at about 1.4 million b/d. (Figure 10) Concerns about significant displacement of oil by wind or solar or electric cars becomes an issue only many years into the future.
Both OPEC and stronger global growth have helped oil prices improve. The late 2016 return of OPEC as swing producer turned out to be a disappointment for the cartel, as the subsequent early 2017 rise in oil prices quickly evaporated. Despite OPEC’s commitment to crush American fracking, the industry quickly returned to action, adding back the nearly million barrels per day of American oil production lost in the 2015-16 downturn, then quickly adding another million barrels per day on top of that.
OPEC returned in late 2017 with its most recent effort to prop up oil prices, this time bringing the Russians and 20 other oil non-OPEC producers from around the world that were willing to impose quotas and limit production. Virtually all of these producers have stringently complied with these quotas and reduced their oil production to prop up oil global prices. OPEC deserves credit for supporting price near the current $60 per barrel.
But there is more at work here than OPEC quotas, and that is the return of supply disruptions and political risk. It has been a long time since political risk was a factor in the oil market, but early this year it returned with a vengeance. We can count supply disruptions like pipeline repairs in the North Sea, an on-going collapse of the Venezuelan economy, and guerillas in Nigeria that have all pushed prices up. And the Middle East is back in play. Most recently it is sanctions on Iran, but there are the Kurds and Turks in Iraq, the U.S. and Russians tied up in Syria, the Saudis in Yemen, and growing internal strife in Saudi Arabia.
On May 9, Donald Trump restored all prior economic sanctions on Iran. Over the following 6 months, this would potentially disrupt 2.7 million barrels per day of Iranian oil exports. However, it turns out that these sanctions are likely to have little effect. While the U.S. financial sanctions may force some allies and producers to go along with oil cuts, France, the UK, Germany, China, and the United Nations vigorously oppose sanctions. Russia, Turkey, and India were not going along anyway.
With only the U.S. and perhaps a few allies involved, the carefully constructed Obama-era web of oil embargo and financial restrictions on the Iranians will not go back into effect to bottle up Iranian oil. CME Group, for example, sees no coming cuts in Iranian oil production, only some occasional price discounting. In the event that some Iranian oil production is lost, a long line of producers has lined up to take Iran’s place – Saudi Arabia, Russia, Iraq, Kuwait, and the UAE, among others.
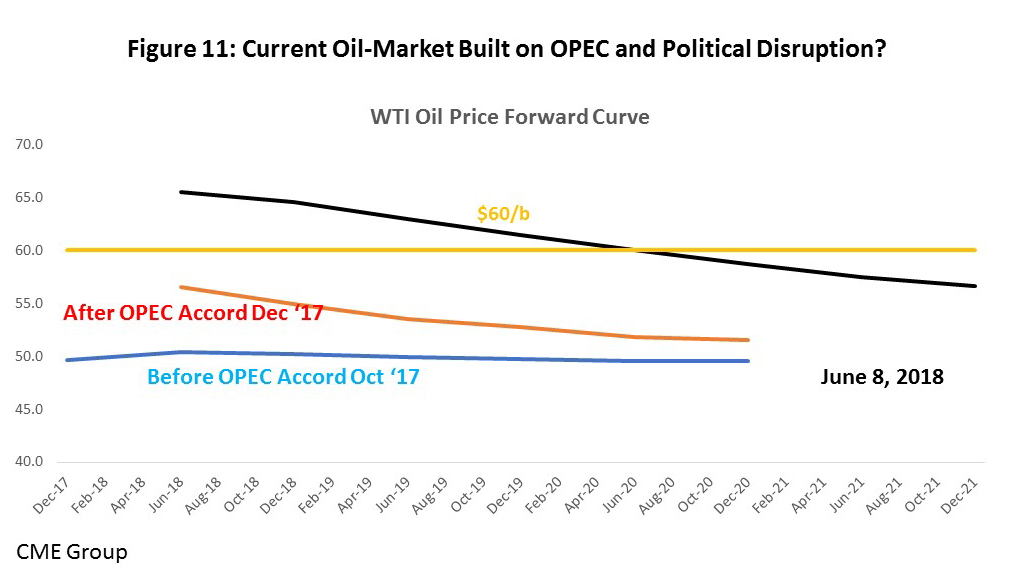
There is, however, a continuing premium of $5-$10 on political risk in oil markets, based primarily on Saudi/Iranian tensions, not U.S. sanctions on Iran. Figure 11 shows the current futures price for WTI from the present to December 2021. A normal futures curve has near-dated prices lower than more distant prices, while this one has near-term price higher. The current short-term premium of $5-$10 for risk explains the shape of the current curve.
In one important sense, the political risk does not matter that much. A West Texas producer, for example, thinking about adding rigs, has to take account of the lag in securing leases, crews and a service company, and then producing and delivering the oil. The relevant price on the futures curve is about 24 months into the future or a current $60 per barrel, and five dollars lower than the current price. The $5 is the near-term political risk working out of the market. The producer’s decision will be made more on fundamentals in the oil market, less on political risk.
Can We Really Keep the Price of Oil Up?
Oil prices currently look quite healthy. Abstracting from political risk, they sit at a sweet spot near $60 per barrel. Let’s focus on the $60, and ask what risks there might be to the economic outlook?
Figure 12 shows U.S. oil production, which stood at 5.5 million barrels per day (b/d) in 2010, rising to 9.2 in 2017, easily rising to 11 million in 2018 and 12 million in 2019. In fact, DOE/EIA says we have already reached 10.8 million b/d in early June. Meanwhile, the Saudi’s total stood at 8.9 million in 2010, and our chart assumes they are capped at 10.6 million by the current OPEC quotas. The Russians – the world’s largest oil producer – are similarly capped at about 10.6 million.
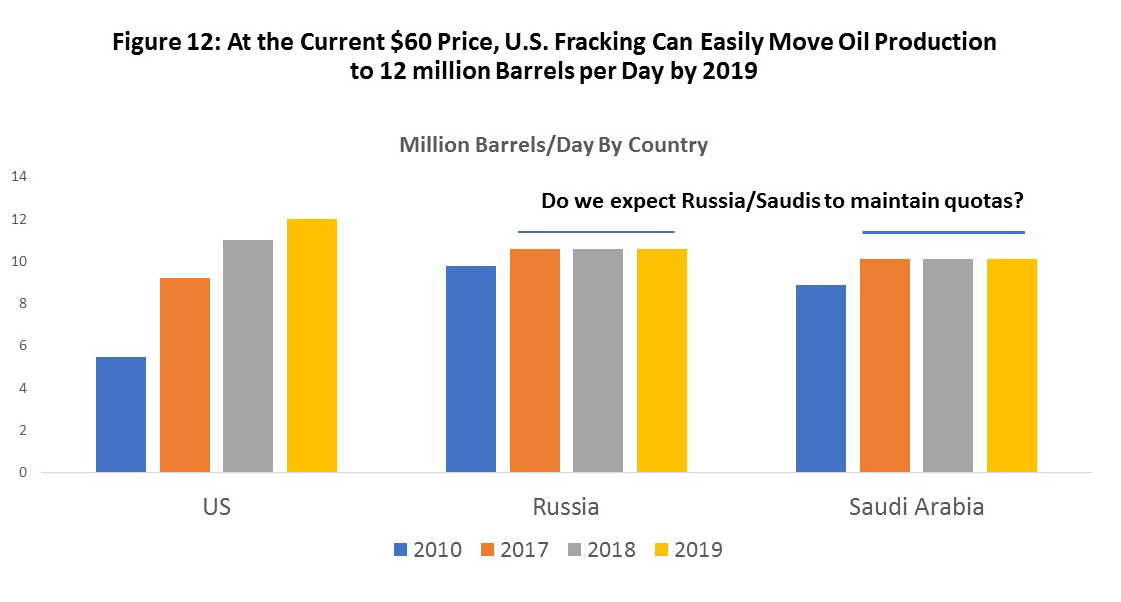
This sets the stage for the coming OPEC meeting in late June, as well as preliminary meetings between the Saudis, the Russians, and other non-OPEC producers. Will this group simply maintain current quotas, lose market share to the Americans, and allow the U.S. to become the world’s largest oil producer? Probably not. Early indications from OPEC are that they will soon raise production, risk lower prices, but seek a path that can keep prices high enough to maintain much needed oil revenues. The trick is to deter the Americans from growing production through fracking.
OPEC’s problems are harder than they might sound, especially if we are putting aside political risk and Venezuela’s on-going collapse. American fracking presents a long-term and perhaps intractable problem if the goal is to keep oil prices at high levels. U.S. oil production is no longer built on the Seven Sisters model of 30 years ago. It is not the huge companies engaged in projects costing billions of dollars and taking many years to deliver.
In contrast to the oligopolistic markets of Shell, Exxon, and the giant national oil companies, fracking looks and behaves like a highly competitive industry: numerous small firms, low barriers to entry, and oil production that can be quickly ramped up or down as price changes. Unlike conventional oil, there is no significant exploration risk, making output relatively certain, and working much more like an assembly line than old-style wildcatting.
Given these competitive properties, if the long-run equilibrium oil price is $60 per barrel – something that both the petroleum and financial engineers tell us is true -- then producer behavior should move supply and demand into balance near that level.
But something went badly haywire in early 2017 when OPEC promised to rebalance the oil market and failed. One answer seems to be too much cheap money. Producers recognized that there were huge subsidies available from cheap money, provided in large quantities by central banks, and U.S. producers turned to private equity and high-yield borrowing. This allowed them to outspend cash flows, hoping to impress equity markets with a quick build-up of reserves and production. Wall Street would shower money on them.
If only one producer had thought of this, it would work. But when all of them drilled and built up their oil reserves at the same time, their new oil supplies collectively pushed down oil prices. The strategy failed, with losses replacing gains in the stock market, and leaving companies with substantial debt.
Where are we now? Large or medium public companies in oil production recognized the prior strategy was flawed, have promised not to out-spend cash flows again, and committed to pay close attention to profits over the oil-price cycle. And they have followed through on these commitments according to company statements, analyst reports, and earnings conference calls.
The problem is that many of today’s oil producers are not public companies. Given the speed and ease of forming a new fracking operation, the number of private companies is hard to track. All it takes is capital, some geology, leases, and a service company, and you are an oil producer. Public company discipline offers the perfect cover for the private companies to come in under the radar and re-try the strategy that just failed for the public companies. According to Rystad Energy, 28 new private operators will be added in 2018 -- and that is just in the over-crowded Permian Basin. Consultant IHS says that just in 2018Q1, private equity has provided over $50 billion to fund new U.S. fracking operations.
Here is the dilemma for the oil industry and Houston. If we suppose that public producers dominate the oil outlook, drilling will be limited by self-imposed discipline. Alternatively, if a flood of new private producers enters the market, they will push drilling activity up sharply early in the year, only to see it fall back later in the year as oil production first soars and then crashes. The latter outcome would simply be a re-run of early 2017. Either way, and despite $60 oil, it is hard to see drilling bringing a boom year to Houston.
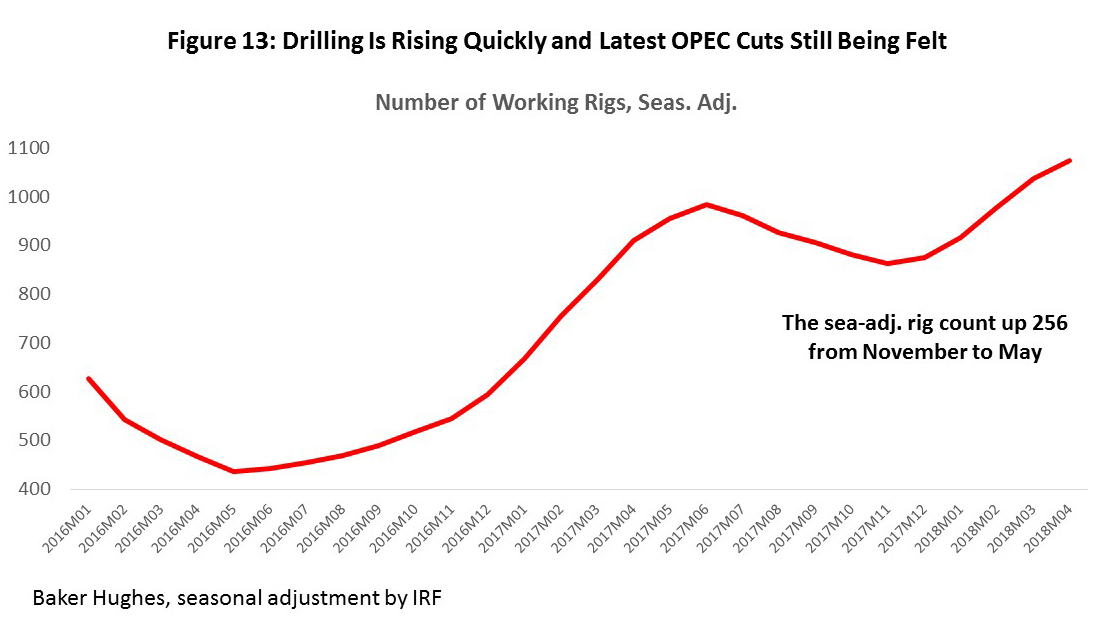
U.S drilling fell back in the second half of 2017, after OPEC price support failed at mid-year. However, Figure 13 shows that the rig count has surged again as the latest OPEC agreement fell into place. After bottoming out in November, 256 rigs were added through May. Given the timing of the OPEC cuts, there is still plenty of stimulus left for the rig count to climb further. And this is without adding in the $50 billion in private equity offered in 2018Q1 that should easily keep it rapidly climbing through the year.
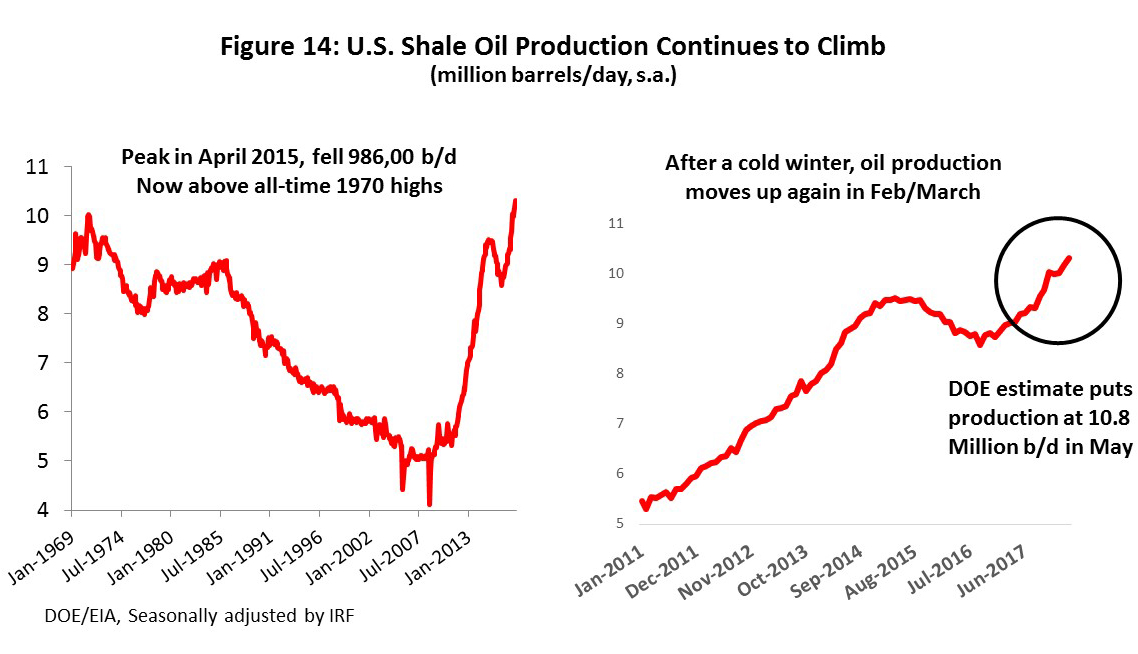
So far, OPEC’s efforts to crush U.S. fracking have been an abject failure. The left side of Figure 14 shows the bigger picture. Steadily falling U.S. oil production from the 1970’s onward was suddenly reversed around 2008, as U.S. fracking allowed it to climb to 9.5 million b/d by the time the Fracking Bust began.
The industry lost nearly a million b/d to the downturn, but as soon as the 2016 OPEC accord fell into place, the industry was again off to the races. Fracking quickly erased the million barrels of lost output, climbed to all-time record levels of U.S. oil production in 2017, and continues to rapidly add to the total.
Based on this discussion, we propose three scenarios to guide the oil outlook as we move forward. They are summarized in Figure 15. The key fact is that it seems tough to get far from a moderate outlook for this year. Either producer discipline holds, and drilling remains moderate, or discipline fails, and a burst of drilling activity is followed by U.S. over-production that soon pulls it back into line.
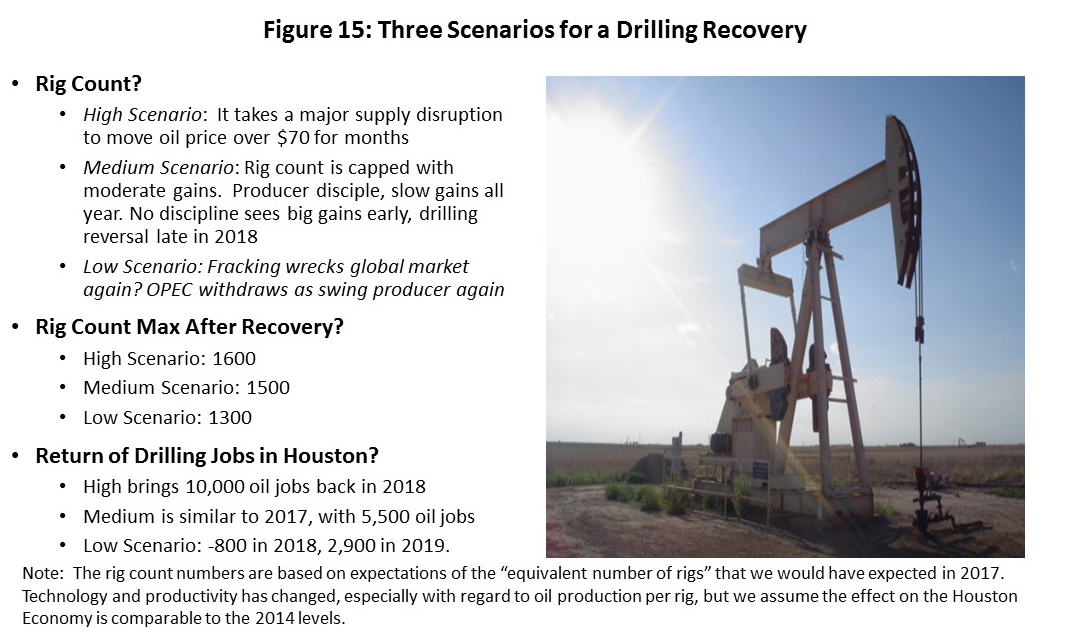
It is difficult to see a high scenario without an outbreak of political risk or supply disruption, and it must be large and on-going for months. A low scenario would be driven by yet about round of U.S. over-production from fracking. Frustration by OPEC from another fracking-led oil price decline, for example, could again bring on its withdrawal as swing producer.
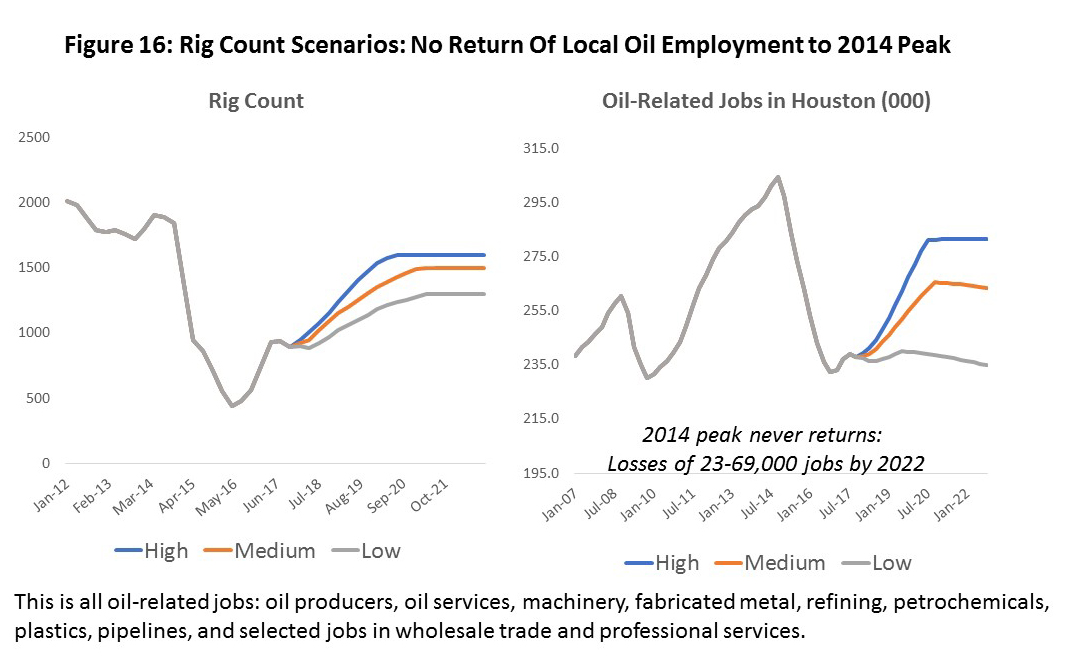
Figure 16 summarizes in graphical form our rig count assumptions, and the number of oil-related jobs that correspond to each case. The medium scenario has only 5,500 new jobs in 2018, but the number improves quickly over time. The high has 10,000 in 2018, and the low has only 800.
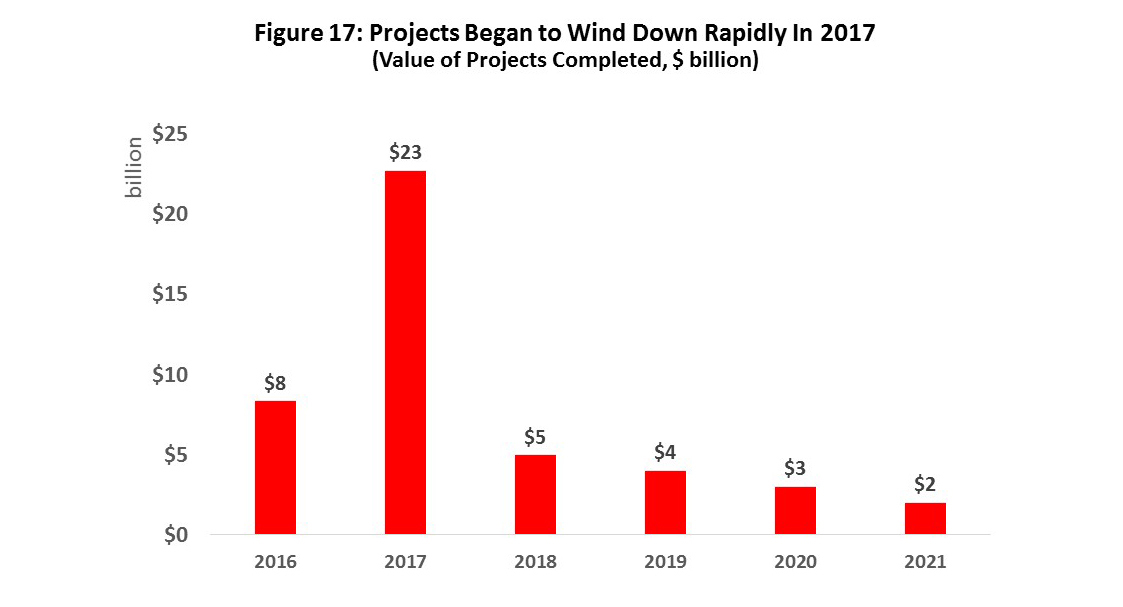
The Petrochemical Boom Comes to an End
The recent chemical boom on the Ship Channel was a huge economic event, triggering $50 billion in construction. For the integrated oil industry, a shift in oil and natural gas prices brings a rebalancing of profits as we move along the production chain from oil exploration and production to refining, chemicals and other processing. Higher oil prices trigger higher levels of profits and activity in the upstream E&P sector, but they also increase feedstock costs that hurts profits for downstream processors. The reverse happens as oil prices fall, with processors benefitting from lower input costs, while E&P companies are hurt by fewer exploration opportunities.
Houston is fortunate to have both a very large E&P sector, mostly on the west side of Houston, as well as a huge oil processing industry in the east and along the Ship Channel. It brings economic balance to Houston’s economy that is often overlooked. It this case, the construction boom was triggered by the fracking industry and a long-term structural shift in favor of historically low natural gas prices. Its immediate economic impact was on construction, with much smaller employment impacts once the new plants came on line. Industry output is huge, however with most of the new plastic product shipped around the world by train, barge and ship.
Today’s most relevant fact about the current construction phase is that it is rapidly coming to an end. It began as early as 2013, gained momentum through 2014-15, peaked in 2016, and began to wind down rapidly in 2017. Figure 17 shows the date of expected completion of the plants, based on the original announcement of expected plant openings. By 2017, over $30 billion of construction had ended. While some plants remain under construction, and there will be additional plants announced near Houston, they will not add up to anything like the original $50 billion dollars. A steady decline in chemical construction seems inevitable as we move forward in time.
U.S. Economy Is Strong, But with Risks Ahead
Our assessment of the U.S. economy runs on two levels: (1) the current very strong performance that we see today, and that we expect to see continue into the near future, and (2) an economy that slowly becomes riskier with the emergence of labor market tightness, wage inflation, and higher interest rates. The key becomes the path of Federal Reserve monetary policy as it simultaneously tries to keep inflation under control and the economy growing.
The first part of this assessment is easily handled. (Figure 18) The U.S. economy remains strong. We know this from virtually every economic measure, and from surveys of professional forecasters, consumers, purchasing managers, and small business. The probability of recession remains near zero, and the economy has strengthened significantly in recent months. Our U.S. forecast is based on the Survey of Professional Forecasters from the Philadelphia Fed, and it shows that the U.S. economy remains as an important source of strength for Houston in 2018 and beyond.
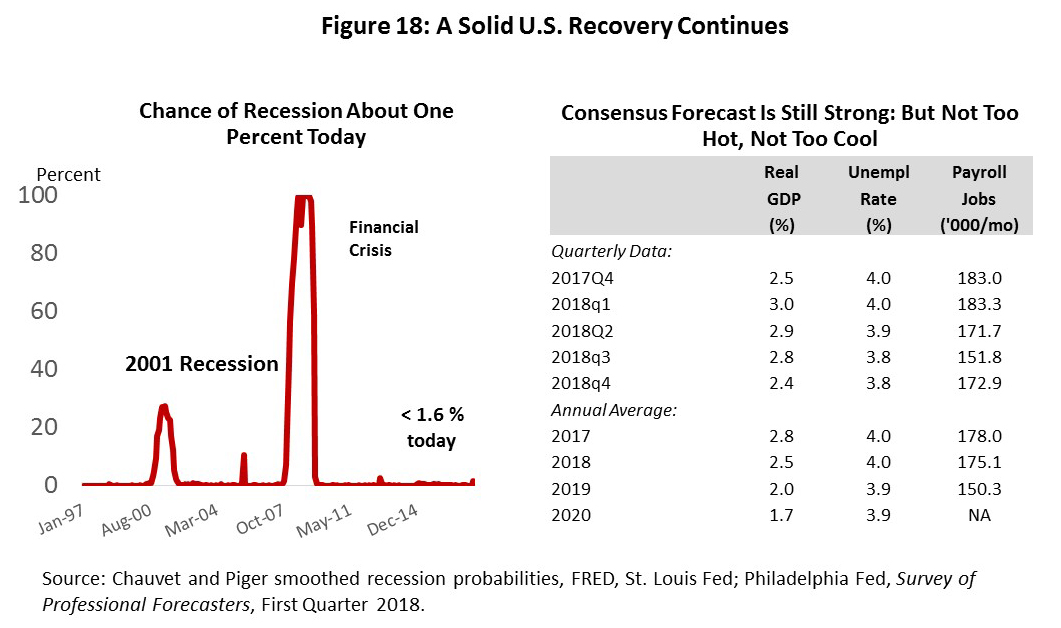
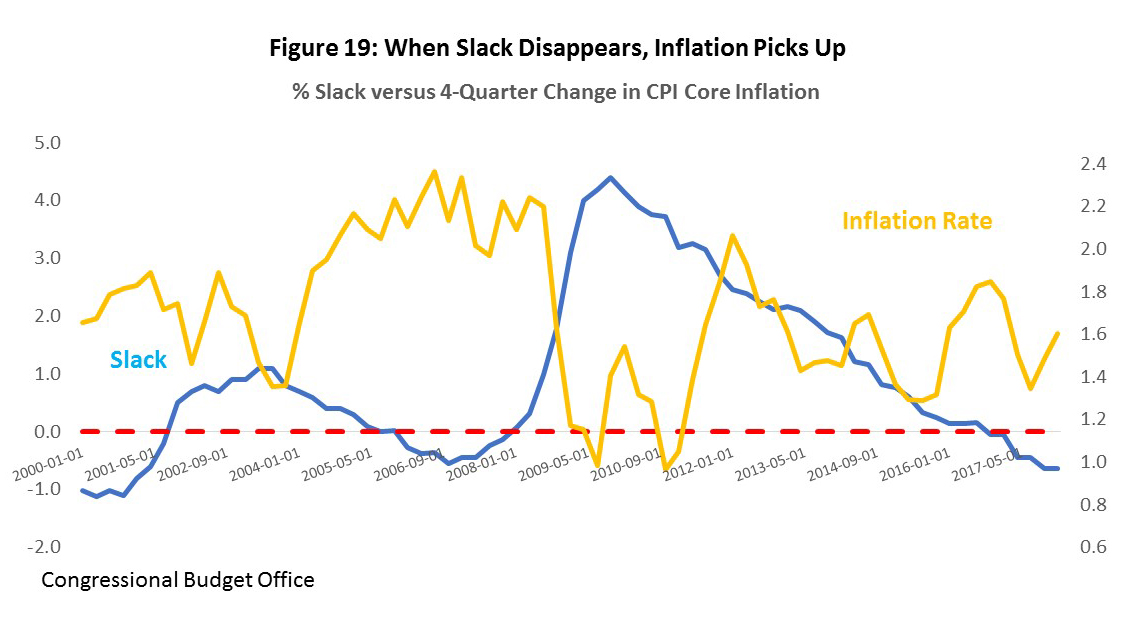
Figure 19 sets up the longer-term issue. The blue line is a measure of slack in the economy called the short-run natural rate of unemployment. Any resources that are influencing the business cycle positively absorb slack, and any potential resources that are not contributing to the cycle produce slack. Specifically, this measure gauges slack in labor markets, and as slack disappears we see labor markets tighten and inflation begin to rise. The inverse relationship between slack and inflation is apparent from the figure.
At present, you see inflation picking us up just as slack in the U.S. economy disappears. The inflation measure used here is the Federal Reserve’s preferred gauge, or the personal consumer expenditure deflator less food and energy. Through the first quarter it was running at 12-month rates of about 1.6 percent. This remains well below the Fed target of 2.0 percent, but recent readings continue to flirt with the target range, and – as we will see – the risks are growing that we reach or exceed that range soon.
The current tight labor markets put the Federal Reserve at center stage. The on-going U.S. expansion began in 2009, and it moved very slowly. By 2012, growth hit a moderate and steady pace, with few speculative excesses. By July, this expansion should become the second longest in U.S. economic history.
During the Great Recession and through much of the recovery, the Fed undertook unprecedented policy measures to support the economy, including zero interest rates and doubling its balance sheet. In the last 18 months, however, the Fed has moved to normalize these measures by raising rates and shrinking the balance sheet. But in the early stages of recovery, the Fed repeatedly asked Congress to help speed up the economy with fiscal policy, e.g., tax cuts or infrastructure spending, but to no avail.
Then in December of this year, Congress passed the Tax Cuts and Jobs Act (TJCA) that enacted much needed tax reform and lowered taxes for corporations and individuals. Congress did not raise taxes elsewhere or cut spending, however, leaving a $1.5-trillion-dollar deficit over the coming 10 years. The administration argues that the tax reforms will unleash growth and will pay for themselves; the nonpartisan Urban Institute says additional growth will pay only 13 percent of the deficit, or about what is required to cover the debt service. Most economists agree with the Urban Institute assessment.
This stimulus is exactly what the Fed wanted … five years ago. Now the outcome is likely to be substantial stimulus running headlong into very low unemployment. And the stimulus will bring little additional growth. Forecasters are revising growth figures for GDP upward, but only in the near-term and not nearly as much as the administration has estimated. Faster growth is likely capped by three specific factors: (1) we are already close to full employment and full industrial capacity; (2) as the labor market continues to tighten, the Fed will accelerate its rate increases, and (3) if large fiscal deficits materialize, other legislation is already in place to require offsetting spending cuts, including cuts to entitlements.
So far, the Federal Reserve has remained on the same measured track for rate increases. (Figure 20) In late 2017, when Janet Yellen was Chair of the Fed, the federal funds futures market was saying three rate increases were likely in 2018, with a fourth increase in December having a 50-50 chance. This same outlook held when Jay Powell became Chair, as well as with the passage of the TCJA. At the latest June meeting of the Fed, internal estimate of the policy committee said a fourth increase was now possible in December. While the federal funds futures market now agrees with the fourth increase, the change in still about 50-50. The December hike now just above 50-50 (56.7%), instead of a little below. And a previously-expected January 2019 increase has now been postponed.
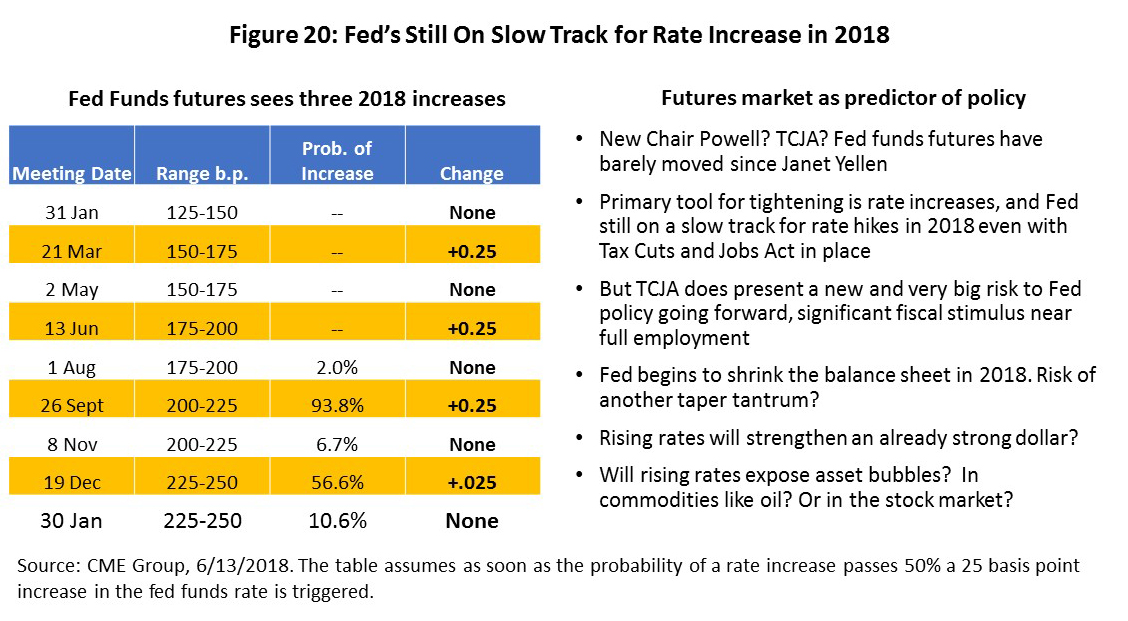
The Fed will achieve a neutral position on monetary policy (all financial crisis stimulus erased) with about four more rate increases, two of which are already predicted by Table 20. The important question – and the hard one – is whether it will be necessary to actively raise rates even further in 2019 to fight inflation. Our forecast is that the Fed responds to any increase in inflation with measured policy changes that slow inflation but do not push the economy into recession. But the Fed’s history here is not good. More often than not, interest rates have risen too fast and too high, ending recent U.S. expansions. The risk of a U.S. recession remains well into the future, but it slowly becomes a very real possibility by late 2019 and beyond.
Pulling It All Together
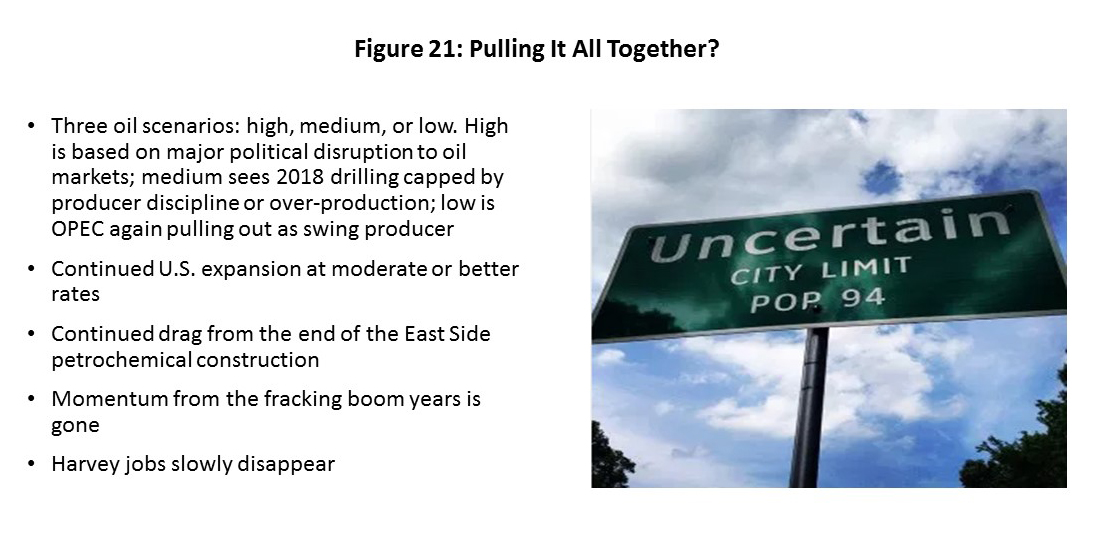
Figure 21 summarizes where we stand with the outlook: three oil scenarios and continued U.S. expansion at a moderate pace are the keys to moving forward. The petrochemical work on the Ship Channel began to rapidly ratchet down in 2017, with many layoffs as large projects ended. Harvey-related construction is in a similar position, following a rapid buildup in late 2017 that will slowly dissipate through the rest of this year. Economic momentum from the boom-times in fracking also ended by early 2017.
We are finally left with just oil and the U.S. economy to support the forecast, along with our list of modest headwinds. Our medium forecast is for a moderate recovery in oil, either from self-imposed discipline by American producers or alternatively from a quick build-up in activity followed by decline if discipline is not observed. The high forecast depends on unanticipated political risk, and the low on the return of too much oil. All forecasts count on the U.S. economy growing at healthy rates.
The forecast for Houston payroll employment is summarized in Figure 22. The 2017 payroll employment estimate is only 26,900 jobs after one-time stimulus from Hurricane Harvey is removed. Our medium estimate for 2018 is 45,100 jobs, followed by a 2019 return to an average growth year in Houston with 60,700 new workers. The economy moves steadily forward from there. The high forecast sets the 2018 and 2019 marks higher, with 54,800 and 81,900 jobs, while the low forecast is only 28,700 and 34,000. The 15/70/15 forecast is a probability-weighted outlook, with a 70 percent chance the medium outlook prevails, and 15 percent each for the high and low. Its current symmetry makes it look much like the medium forecast.
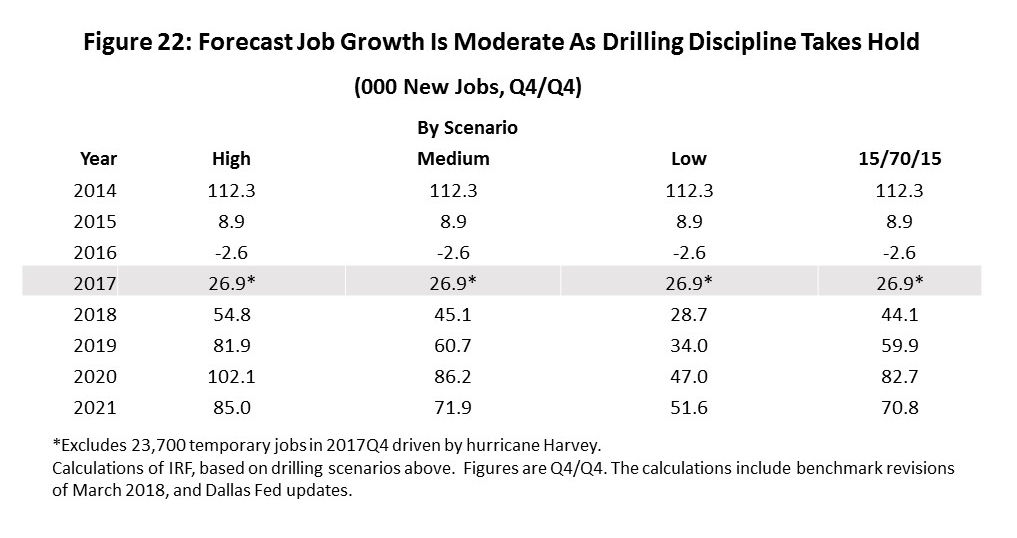
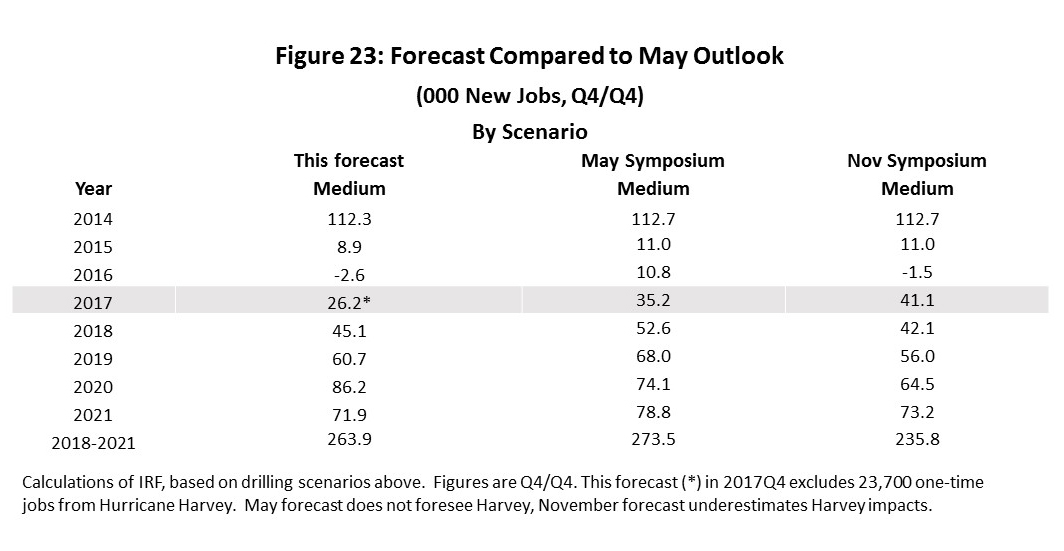
Figure 23 compares the present medium forecast to those from our two previous Economic Outlook Symposia in May and November of 2017. Compared to the current medium forecast, the May outlook was uniformly more optimistic and November more pessimistic. Differences were small, however, with the bottom line of Figure 23 showing total four-year job gains for each case. The average annual increase over four years was 66,000 jobs in the current forecast, 68,300 in May and 59,000 in November.
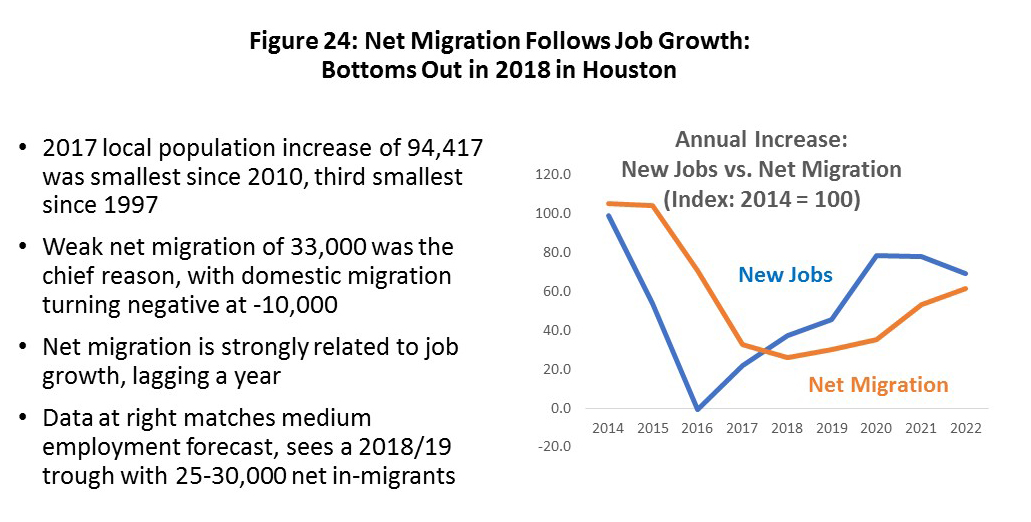
Finally, Figure 24 is a look at projected population growth. As discussed earlier, population growth in Houston is a big number simply because there are seven million people living here, and births versus deaths net out to a big gain. However, positive net migration into Houston provides the real boost to the economy from population growth, with over 100,000 annual net migrants during the Fracking Boom as an example.
While net migration to Houston remained positive in 2017, it is only because international migration remained strong. International migration is driven less by the state of the economy, and more by non-economic factors like family reunification. However, net domestic migration is an economic phenomenon, and it turned negative last year indicating more Houstonians were leaving the metro area than arriving. Our forecast sees total net migration bottoming out in 2018-19 at 25-30,000, before following the economic outlook upward.
Written by:
Robert W. Gilmer, Ph.D.
Institute for Regional Forecasting
June 18, 2018
1R.W. Gilmer, “Harvey in Perspective: The Houston Economy and Hurricanes Past and Present,” Institute for Regional Forecasting, Bauer College of Business, February 6, 2018 https://www.bauer.uh.edu/centers/irf/houston-updates-feb18.php; also, R.W. Gilmer, “H-Town: Houston and Hurricanes,” Tierra Grande, Research Publication 2204, Texas A&M Real Estate Center, vol. 25 (May, 2018)
2For a basic explanation of how it works, see the Texas Workforce Commission’s sample estimates of Houston’s payroll employment and its subsequent revision at “Houston's 2017 Benchmark Payroll Revisions Bear the Mark of Hurricane Harvey,” Institute for Regional Forecasting, Bauer College of Business, March 19, 2018. https://www.bauer.uh.edu/centers/irf/houston-updates-march18.php
3These estimates of Houston payrolls are based on June 2018 BLS revisions and updates to the Quarterly Census of Employment and Wages for 2017Q4, as well as revisions to previous quarters. Despite new information being available, the Texas Workforce Commission does not update the current sample-based payroll estimates until March 2019. In contrast, the Dallas Fed uses the QCEW estimates to continuously replace parts of the TWC’s sample and to revise the payroll figures. The Fed’s new payroll estimates are referred to a “preliminary rebenchmark,” and we use them in model estimates.
4On June 15, the Workforce Commission released estimates of local payroll employment through May. Based on the TWC’s seasonally-adjusted payroll data, the first five months of the year brought 44,000 new jobs. If this rate was extrapolated through 2018, it would imply 135,800 jobs, a figure greater than seen for any year of the Fracking Boom. Using a narrow definition of upstream oil (producers, service companies, machinery, and fabricated metals) only 6,900 jobs have been added between December and May. These jobs – which should be the chief driver of a 2018 expansion in Houston -- represent are a nice recovery in oil but not a boom.
5Bluford Putnam, “U.S. Pullout of the Iran Nuclear Deal: What Next for Oil, Business?, CME Group, 10 May 2018, http://www.cmegroup.com/education/featured-reports/us-pullout-of-iran-nuclear-deal-what-next-for-oil-business.html
6DOE/EIA, US Weekly U.S. Field Production of Crude Oil, https://www.eia.gov/dnav/pet/PET_SUM_SNDW_DCUS_NUS_W.htm
Venezuela’s political collapse is on-going, with long lines of ships lined up to load Venezuelan oil. The current political crisis leaves the country less and less able to make delivery. This may be the main factor currently propping up world oil prices.
7We have left the tariff fight out of the discussion. It is an important topic, as the reduction of trade barriers over the last 60 years has been enormously beneficial to the global economy. However, the Trump administration would argue that many low-income Americans have been inadequately compensated for their losses to previous trade agreements, and that currency manipulation and organized theft of intellectual property must be stopped however possible. The arguments have validity. The fight is greatly complicated by heated rhetoric, by too many simultaneous proposals, and by little clarity on the economic implications of the proposed tariffs. We have ignored the tariffs as part of the forecast out of uncertainty about what they mean for Houston’s future growth. We can be certain, however, that these tariffs can easily spill over into many important Houston industries: fabricated metals, plastics, machinery, chemicals, oil production and oil services, and pipelines.