Houston Updates
-
Archive
- June 2025
- March 2025
- December 10, 2024
- September 14, 2024
- May 21, 2024
- March 19, 2024
- December 9, 2023
- June 16, 2023
- April 6, 2023
- March 17, 2023
- Dec. 19, 2022
- Sept. 14, 2022
- July 4, 2022
- March 27, 2022
- March 9, 2022
- September 2021
- April 2021
- March 2021
- September 2020
- August 2020
- June 2020
- April 2020
- March 2020
- January 2020
- December 2018
- June 2018
- March 2018
- February 2018
- January 2018
- September 2017
- September 2017 Post-Hurricane
- June 2017
- March 2017
- January 2017
- September 2016
- March 2016
- December 2015
- September 2015
- June 2015
- March 2015
- December 2014
- June 2014
- March 2014
- November 2013
- September 2013
Houston Waiting for the Recession: How Soon? How Deep?
March 17, 2023
A broad U.S. economic slowdown or modest recession looms in the not-too-distant future as the Federal Reserve moves aggressively to raise short-term interest rates, slow the economy, and bring inflation under control. With core inflation still running at 4.6 percent, well short of the Fed’s two percent goal, continued rate increases remain likely. The harder the Fed must fight inflation, the greater the risk of a more serious economic reversal ahead.
For now, however, the consensus forecast remains focused on a near-term slowdown or shallow recession. The February Survey of Professional Forecasters, for example, sees an abrupt slowdown in U.S. job growth beginning in the second quarter of this year, opening with scattered job losses that turn into slow growth that continues through 2023 and most of 2024. The Congressional Budget Office has a similar forecast with a near-term 0.5 percent loss of jobs that then turns into a no-growth scenario also lasting through 2024.
This U.S. slowdown has its consequences for Houston as well. In our forecast from Last September, we were expecting sub-par job growth of around 45,000 local jobs in both 2023 and 2024. Over the last six months, expectations have slipped to only 10,500 this year and 24,300 in 2024.
But can there really be a recession coming, given the tight labor markets, rapid wage increases, and high levels of spending? How could it be as close as just a few months away given current consumer strength? We can offer three reasons for concern.
- First, maybe the consumer’s sense of well-being is misplaced. There is no doubt that the household sector is in control of today’s economy, spending at well above levels consistent with economic fundamentals, and with confidence built on left-over pandemic fiscal and monetary stimulus. The Federal Reserve’s Financial Accounts of the United States tell us that in late 2022 the household sector was holding an extraordinary $17.6 trillion more in financial assets than before the pandemic, even after accounting for the financial setbacks of last year. Even if we allow for on-going inflation since 2019, the spending power left in those extra balances is still a formidable $4.9 trillion. But even this large sum can be exhausted in just a few months by a combination of continued spending, further declines in financial markets, or sustained inflation.
- Second, maybe we are looking in the wrong corners of the economy. The strength we see today in measures like personal income, jobs, and spending is coincident with the business cycle – telling us times are good right now. But there are also forward-looking variables like new orders, housing permits, credit conditions, and the stock market that tell us what is yet to come. One well-known index built on 10 of these leading variables turned down immediately with the Fed’s first rate increases, and it has for months been predicting with growing confidence a recession in early- to mid-2023.
- Third, the Fed can and will make recession happen. The central bank was embarrassed by letting the inflation genie out of the bottle in 2021 and professional reputations and personal legacies are now at stake. They are fully geared to move forward unless there is an Immaculate Disinflation – somehow the core inflation measures simply fall back without the need for continued tightening. The Fed’s target now is the household.
Don’t count on much easing before the labor market and consumer spending have clearly cracked. It is a matter of when … not if. The longer it takes, the higher the terminal rate, and the worse the economic downturn.
The End of COVID Stimulus … And Continued Stimulus Effects
The COVID pandemic is over, but its consequences and the policy measures taken to fight it remain central to the U.S. outlook. Although supply-chain disruptions continue to recede they remain as an economic issue. Construction employment remains strong for office, retail, and apartments, for example, as developers are still finishing projects long delayed by material shortages.
But the key economic problem in today’s economy is inflation, with the CPI breaking out of its two-percent range in March 2021 just as the second and third rounds of fiscal stimulus were paid out. Headline inflation reached 8.2 percent only 12 months later. The impact of the fiscal payments had important implications for keeping the economy strong at the time and perhaps avoided a deflation trap. However, it also was large enough to generate close to two trillion dollars in “excess savings” that helped fortify household balance sheets and keep them spending at high levels for at least a year after stimulus was needed.
Meanwhile, the Federal Reserve was itself feeding inflation through zero interest rates while it attributed the initial inflation break out in 2021 to supply-chain issues. It failed to recognize either its own role in the price increases or the critical impact of fiscal policy and consumer spending. It only began to raise its policy rate from the zero bound in March 2022. If monetary policy works with long and variable lags of 12-24 months, we are only now on the cusp of it having significant effects on the economy.
Fiscal stimulus was an enormous injection of cash into the economy, but payments mostly ended in early 2022 and they now must be replaced by economic growth. The stimulus came in two waves of about $2.5 trillion dollars each, first in early 2020 during the lockdown period, then followed by two more rounds in late 2020 and early 2021 that totaled another $2.5 trillion. Two and a half trillion dollars was about $16,800 per U.S. household in 2020, and each round saw perhaps half of this cash flow into individuals directly or indirectly -- but quickly and as needed. Most went into the bank accounts of individuals and businesses through economic impact payments, the paycheck protection program, and enhanced unemployment checks.
In Figure 1, the solid blue line shows the pandemic-period track of total personal income (including stimulus), and the solid red line is the wages, salaries, and income of the self- employed (no stimulus). Each point compares these measures to pre-pandemic levels in February 2020. The initial round of stimulus came against a backdrop of consumer shock and lockdowns, and a ten percent drop in wages and salaries that was immediately matched by a ten percent jump in stimulus-driven personal income. These cash payments appeared to quickly right the economic ship by mid-2020 by offsetting wage losses and delivering record levels of income. Pre-pandemic levels of wages and salaries were fully restored by November 2020.
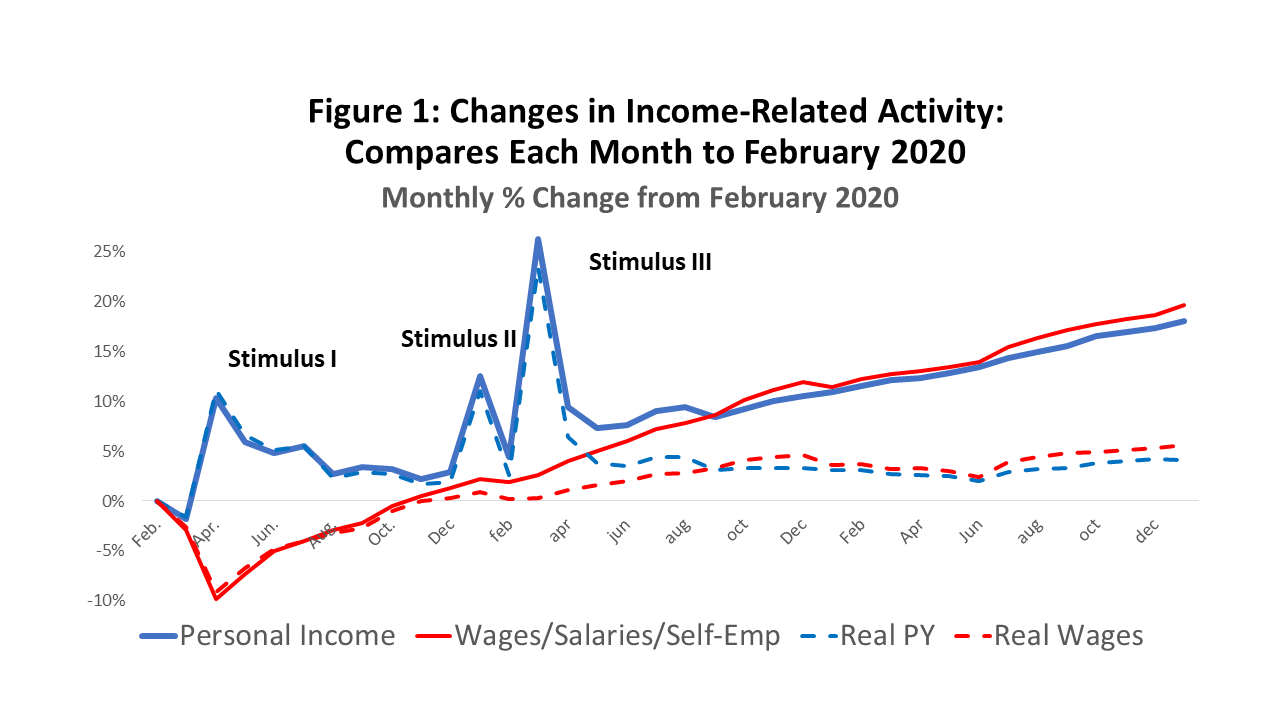
The lockdown month of March 2020 was the only month that U.S. personal income fell below pre-pandemic levels, telling us that consumers had the wherewithal to spend if they chose to do so. In fact, Americans – at least collectively -- were never before so well off financially as during the pandemic.
Figure 7 also shows us an economy that is now expanding on its own. The red line for wages and salaries has been growing rapidly since late 2020 and now stands 19.7 percent above pre- COVID levels. The blue personal income line has been steadily slowing as the stimulus recedes, although it is now being carried forward nicely by wages and salary growth and remains 18.0 percent above pre-COVID levels. However, the gains are much less impressive if inflation is removed as shown by the broken lines. Personal income is up only 4.1 percent over three years and wages and salaries up only 5.6 percent.
After the impact payments had been sent out to individuals, the major features of pandemic spending were the paycheck protection program and enhanced unemployment compensation. In April 2021 these programs were running at annual rates of $763 billion. Almost all of the major programs were rapidly winding down by late 2021, although by the following January fiscal spending was still running $164.1 billion at annual rates, mostly via expanded Medicare, child tax credits, and college loan forbearance. An expanded childcare tax credit ended last September. College loan forbearance will end this year, either through a partial amnesty for debtors or an adverse court ruling.
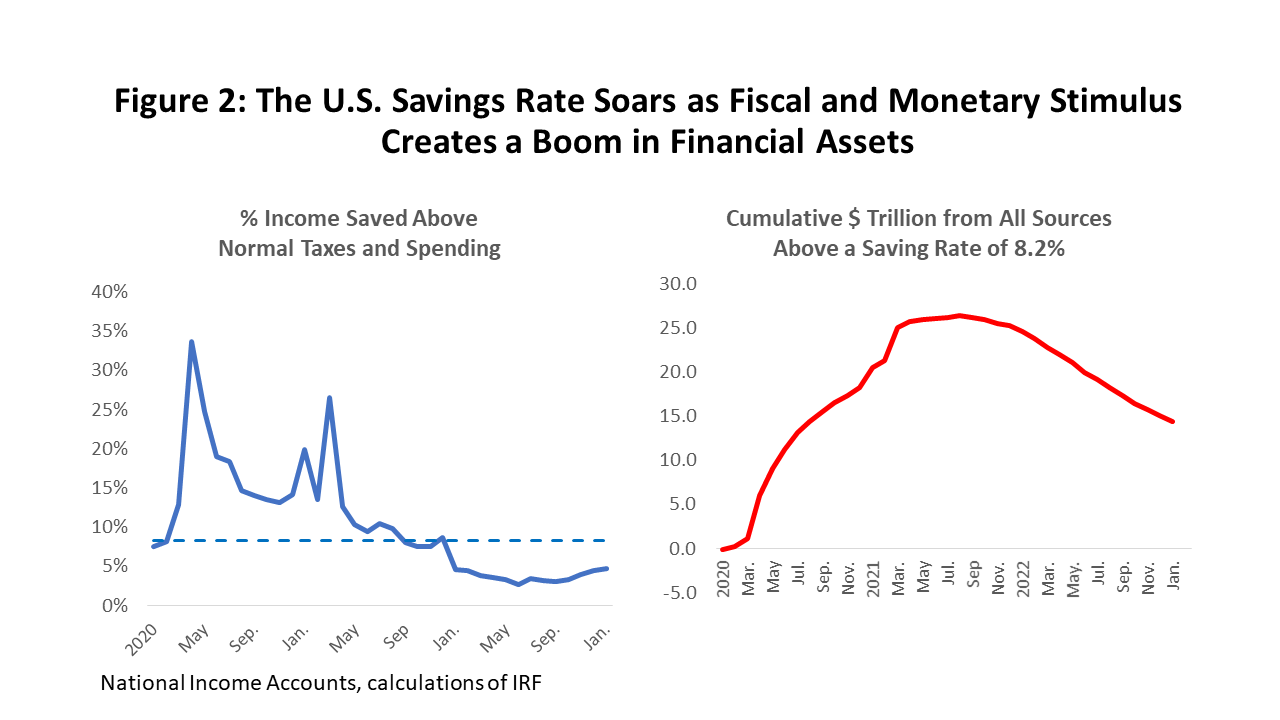
How do spending and allocations stay high with the stimulus payments ended? The key for many consumers was that the pandemic stimulus was not all spent, and much was saved. “Savings” as defined by the National Income and Product Accounts is simply the difference between after-tax personal income and outlays on goods and services. If 8.2 percent of after- tax income is a comfortable past level of saving, Figure 2 shows that actual savings rates were far higher throughout much of the pandemic. The saving rate finally slipped below 8.2 percent throughout last year and has since fallen to a very low levels near two to three percent.
The right side of Figure 2 shows that these pandemic savings cumulated into a huge amount of money, with “excess” savings above the 8.2% mark reaching $26.5 trillion in September of last year, and still around $15.7 trillion this January. We will see how these numbers compare to recent changes in the household sector balance sheet below.
You must be careful with the definition of savings, however. It includes anything that is not spent on goods and services and is part of after-tax income. New homes, existing homes, upgrades of existing homes would be in this definition of savings, along with any financial investment like stocks and bonds. Much of this saving goes to illiquid assets, but the liquid assets held by households remains quite large, and the amount is important because that is the dry powder that drives spending.
Stocks and bonds might be relatively liquid or they might have gone to a 401(k) where they are subject to penalty withdrawals, or maybe they were just lost to the current financial downturn, or to meme stocks, crypto, or other regrettable investments. In fact, these pandemic assets quickly merge into a much larger picture of general household assets and finances and how the consumers financial positions was influenced by both fiscal and monetary policy. We discuss this further below. Financial setbacks and inflation provide more avenues for the consumer to lose money and financial assets than just spending it.
U.S. and Houston Consumers Still Keep Spending
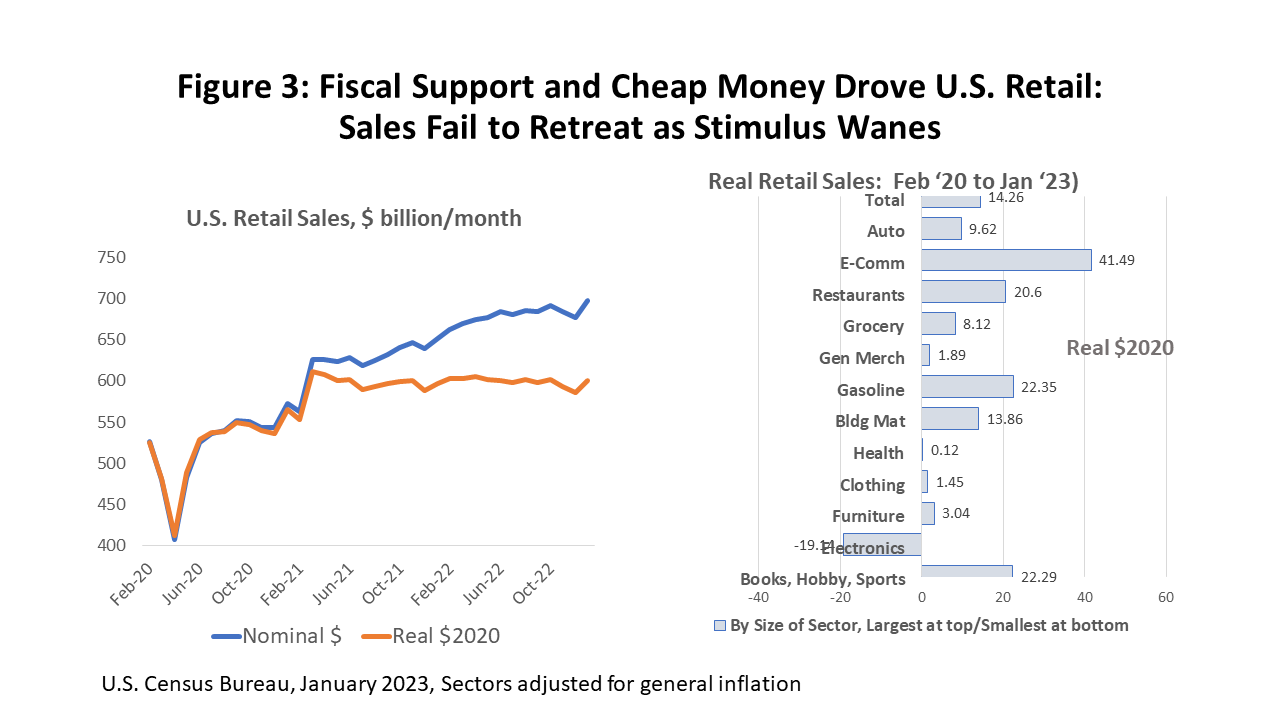
The stimulus payments had a big and immediate impact on spending in the U.S. and Houston. Figure 3 shows the obvious timing of a jump in U.S. retail sales following each round of fiscal help: first, there is returning retail activity to pre-pandemic levels by June 2020, followed by an added sharp pick up that comes in March 2021, pushing spending well above pre-pandemic levels where it has stayed throughout last year.
However, inflation is taking its toll. Consumer prices including food and energy rose 6.8 percent measured fourth quarter to fourth quarter of 2021 and at a 7.1 percent rate through last year. The bite that inflation has taken from spending is the difference between the blue and red lines of Figure 3. Since the last round of stimulus, even the inflation-adjusted figure shows only minimal slowing while remaining well above previous peaks.
There is no reason why Houston was not a full participant in the stimulus payments and in any resulting local spending bubbles. Figure 4 shows City sales tax allocations in place of retail sales, but we see the same stimulus-driven pattern as the U.S. with continued high levels of spending. Figure 4 also shows the COVID history of sales tax collections in both current and inflation-adjusted dollars. Before COVID, City revenues in 2019 had been trending upward to over $60 million per month, only to fall back to $48.9 million in the April lockdown. Allocations stabilized and returned to pre-COVID levels with the first stimulus, but significant recovery does not come until March 2021, following the lead of an improving U.S. economy, vaccines, and further stimulus.
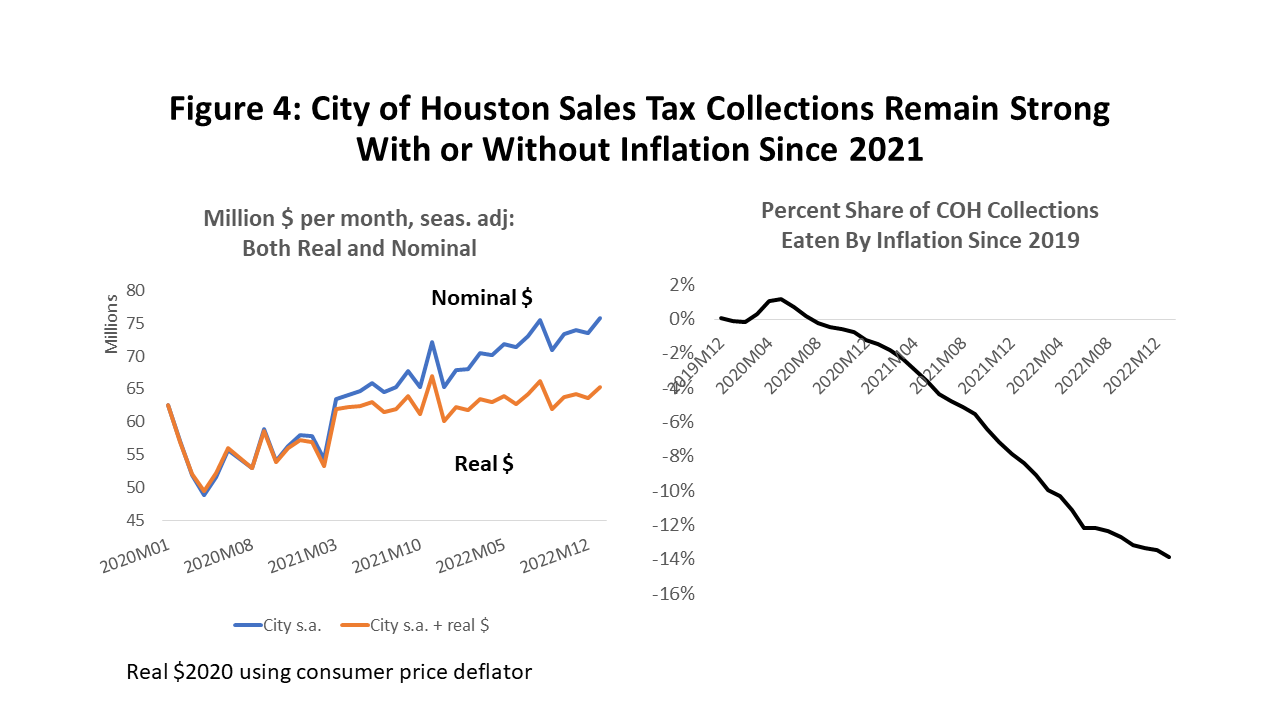
In March 2021, inflation-adjusted allocations earned by the City of Houston (in $2020) jumped back to $63.4 million per month or just above pre-COVID levels, and then continued to move higher. In the 12 months leading to the pandemic lockdowns real allocations averaged $59.6 million per month in $2020, compared to the current $65.3 million or 9.7 percent higher. These spending gains come despite the fact that Houston’s economy struggled until April 2022 to simply return payroll employment to 2019 pre-COVID levels.
The focus on real dollars becomes increasingly important, as the percent share of monthly allocations lost to inflation compared to pre-pandemic levels is now 13.9 percent. Nominal collections can look quite strong compared to the past – but only until you look at the other side of the balance sheet and consider the higher cost of buying goods and services for the City.
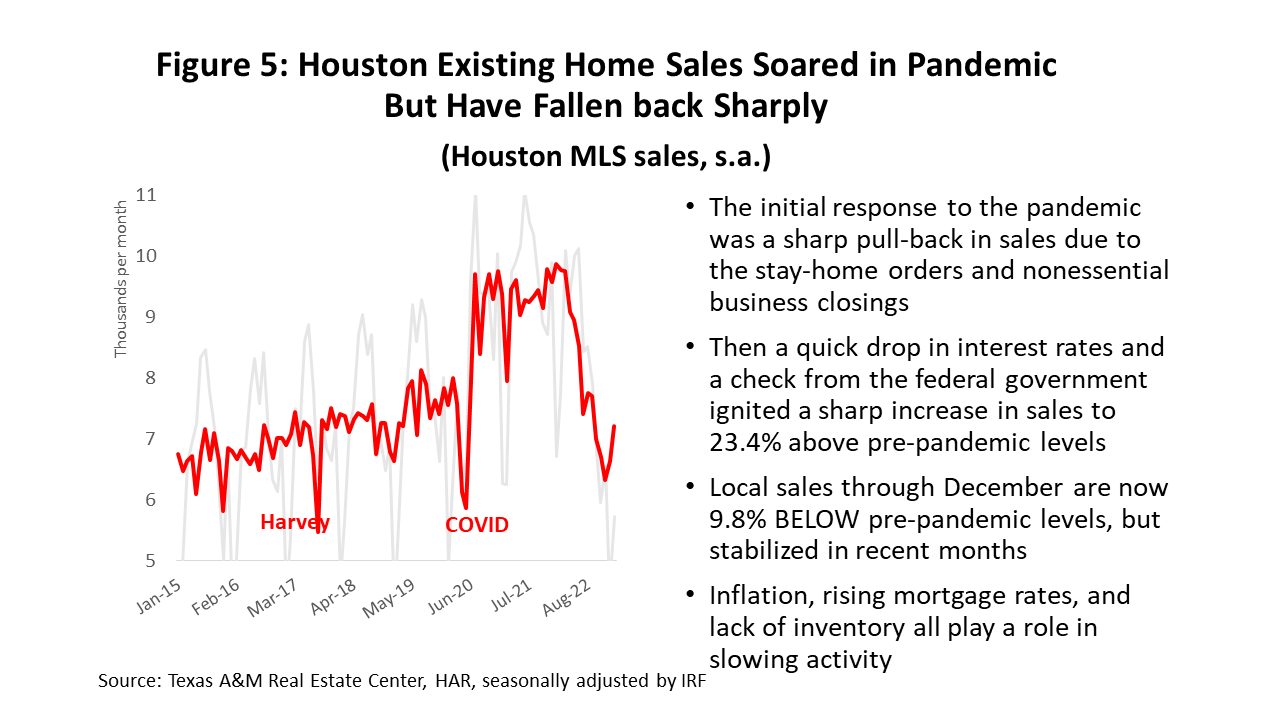
Local big-ticket items have been subject to similar COVID-driven mini-bubbles. The sale of local trucks and autos, for example, was subdued in the pandemic, mostly due to shortages of chips and supply chain issues that left dealer lots empty. But we saw sharply rising car prices in place of the number of sales, with prices quickly moving up 25% and now reaching over $52,500 for the typical Houston truck or auto. However, the most recent data in Figure 5 shows sales returning to pre-COVID levels and prices that have stabilized in recent months, even with no inflation adjustment.
Also, Houston’s existing home sales and prices soared with successive rounds of stimulus. This began early in the pandemic and was helped by low interest rates as well as fiscal spending.
Existing home sales spiked as much as 23.4% above pre-pandemic levels, prices rose 36.4%, and inventories fell to a 1.3-month supply. Figure 5 shows that seasonally adjusted sales were in full retreat through 2022 but have stabilized in recent months. Home prices that have leveled out at high levels and inventories slowly rose to a still-low 3.1 percent. Higher mortgage rates have been the primary lever to burst this COVID mini bubble.
Recession Ahead? Reason 1: Spending, Financial Losses, and Inflation Hurt Households
It was not just the direct recipients of pandemic fiscal stimulus that pushed household wealth and spending higher, but all consumers directly and indirectly enjoyed large gains after 2019. Figure 6 shows the US balance sheet for all households and their financial holdings in 2019Q4, 2021Q4, and 2022Q4. The financial assets are divided into equities, debt, liquid assets like checking and savings accounts and a large and relatively stable “Other” category mostly made up of pension claims, equity value of unincorporate businesses, and insurance reserves.
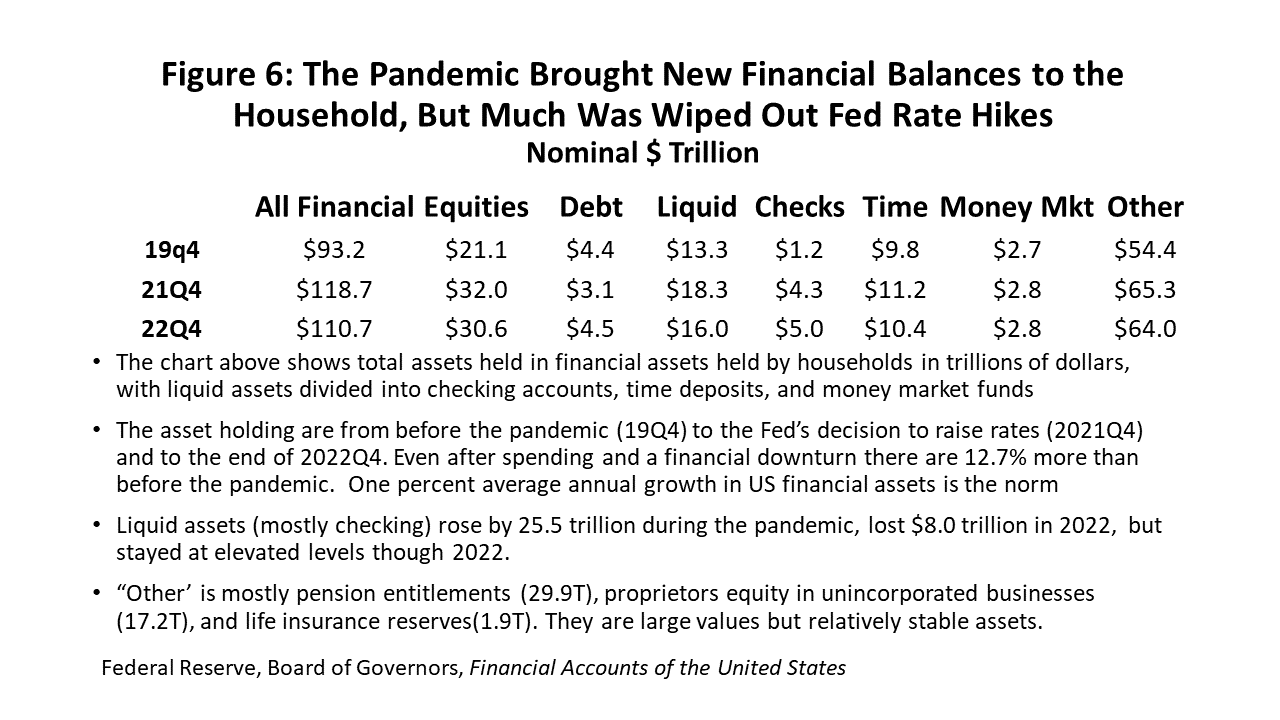
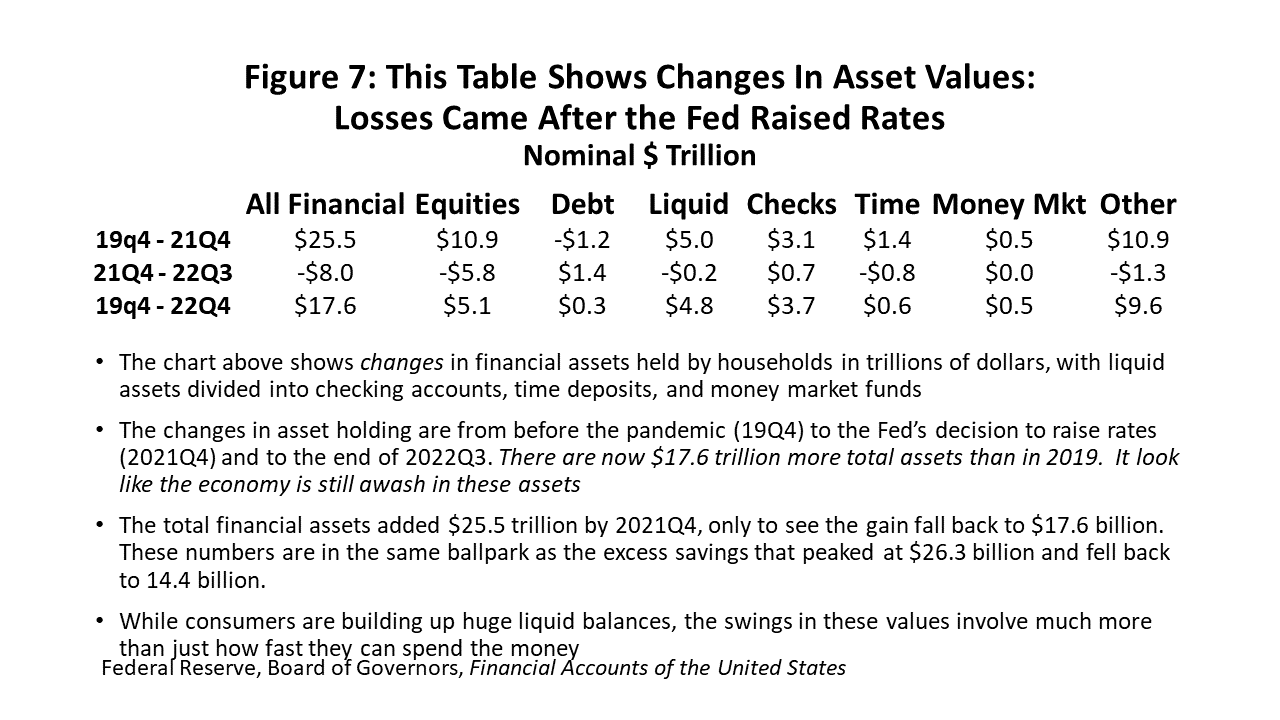
Figure 7 shows the change in the value of financial assets from the pre-pandemic period in 2019Q4 through the end of 2021Q4, and then for the period of Fed rate increases from 2021Q4 to 2022Q4. All household financial assets rose a combined $25.5 trillion during the pandemic, led by the $10.9 trillion from the stock market, a $5.0 trillion surge in liquid assets such as checkable deposits, and $10.9 trillion from “Other” assets.
There was a significant reversal in 2022 as interest rates rose, however, with a combined loss of $10.4 trillion. The stock market and Other led the decline, but the net overall financial gain still remaining for households after 2029Q4 was still a stunning $17.6 trillion in new wealth measured from before the pandemic until 2022Q4.
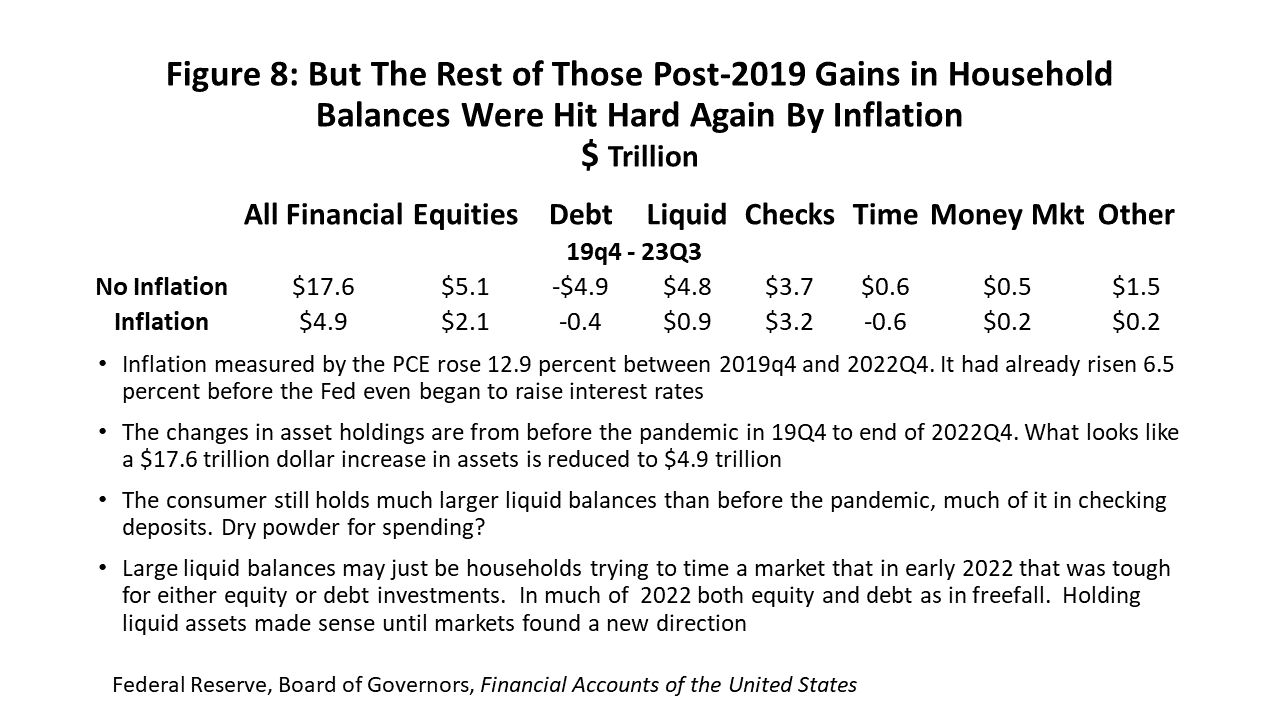
This certainly leaves the impression that the US consumer is awash with financial assets that could power spending for years to come. But once we factor in inflation, this picture changes substantially, as inflation as measured by the personal consumption deflator rose 12.9 percent from 2019Q4 to 2022Q4. In Figure 8 we find the inflation-adjusted financial gains after 2019 fall from $17.6 trillion to $4.9 trillion. This is still a healthy gain of 5.3 percent above pre- pandemic levels.
The use of the deflator in this context makes sense in terms of a householder looking to transform these assets into spending at the grocery store. But what can stop the consumer’s current spending? From the broader perspective of total financial holdings we want to see lower asset values or less wealth, and reducing assets values is about more than just waiting for the consumer to spend money – we have to factor in potential financial losses and inflation. Consumer spending is probably the smallest factor playing on asset values in recent years.
What could wipe out $4.9 trillion? It is not that hard. Choose any two on this list of three events: another eight months of spending at current levels, six months of continued inflation, or a 10 percent decline in equities. The countdown started in late 2022 and all three factors are still at work early in the year.
What about the high levels of liquidity remaining in the financial system through late last year, with nearly $2.7 trillion sitting in checking and other liquid accounts even after accounting for inflation? Was this cash really meant to be dry powder for household spending? Or did households in 2022 find themselves just with nowhere else to invest, as Fed policy briefly left both the stock and bond market in freefall?
The seeming end of the 60/40 allocation for stocks and bonds briefly became a hot topic for investors last year, and holding liquidity made sense until the market found a new direction. The latest 22Q4 data shows $1.4 trillion had already begun moved to out of other assets – including the liquid accounts – and was headed into the short-term debt market to earn some meaningful 4-5% interest on two-year treasuries.
Economists have expected consumers to pull back for some time – including this economist – and we have been repeatedly disappointed as spending by households remained very strong through the fourth quarter of last year. But the Federal Reserve Bank of New York’s latest Quarterly Report on Household Debt and Spending showed that financial stress is finally emerging as debt levels rose 4.4 percent in the quarter, and credit card balances were up 15.2 percent – or the largest one-quarter jump since 1999.
Recession Ahead? Reason 2: We Are Looking for a Downturn in the Wrong Places
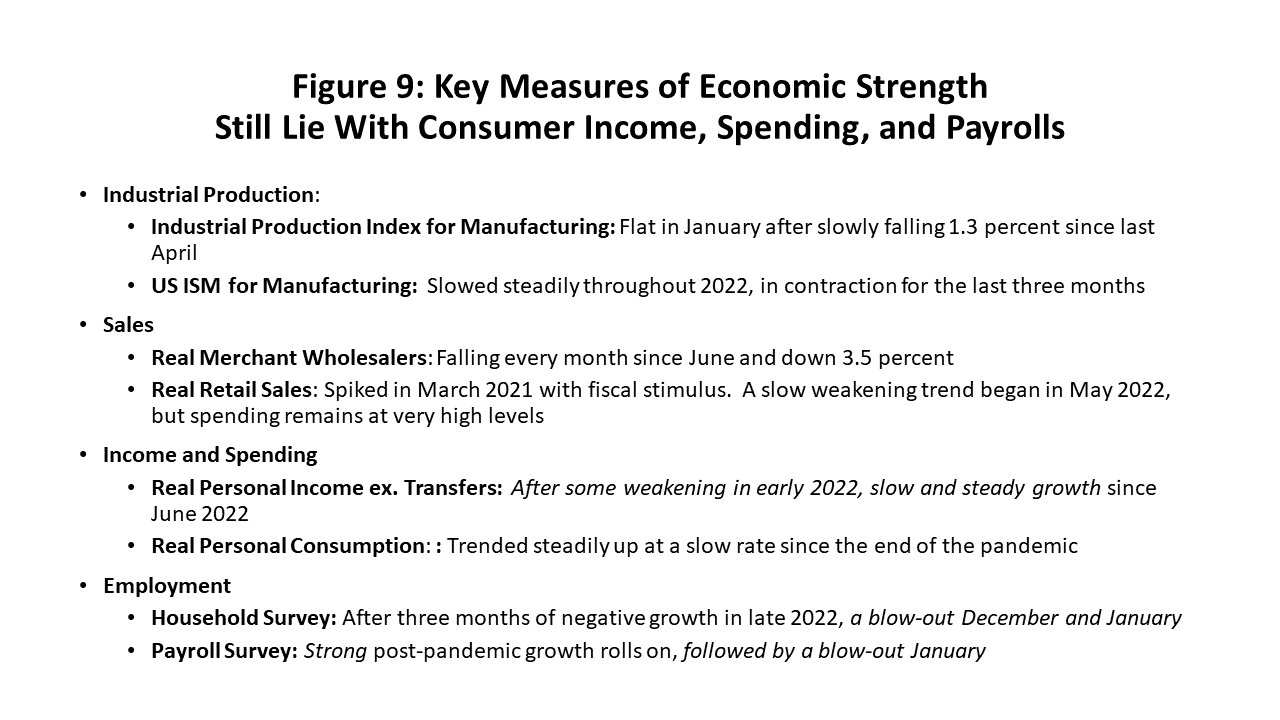
The consumer is the chief barrier between the Fed and an economic slowdown or recession. Every measure of consumer activity seems to point to real strength – employment, income, spending, claims for unemployment, job openings, etc. Is it realistic to expect a recession under these conditions?
The list of variables in Figure 9 overlaps strongly with (1) a list from the National Bureau of Economic Research that best defines a recession once it arrives and (2) a list of variables found in the Index of Coincident Indicators from the Conference Board. The focus here is cyclical measures that indicate strength in the economy now. Despite the Fed’s efforts to date, the only weakness in these key cyclical indicators is in manufacturing and business sales. Consumer income, spending and the job market remain strong, clearly reflecting households helped by left-over pandemic financial assets and savings.
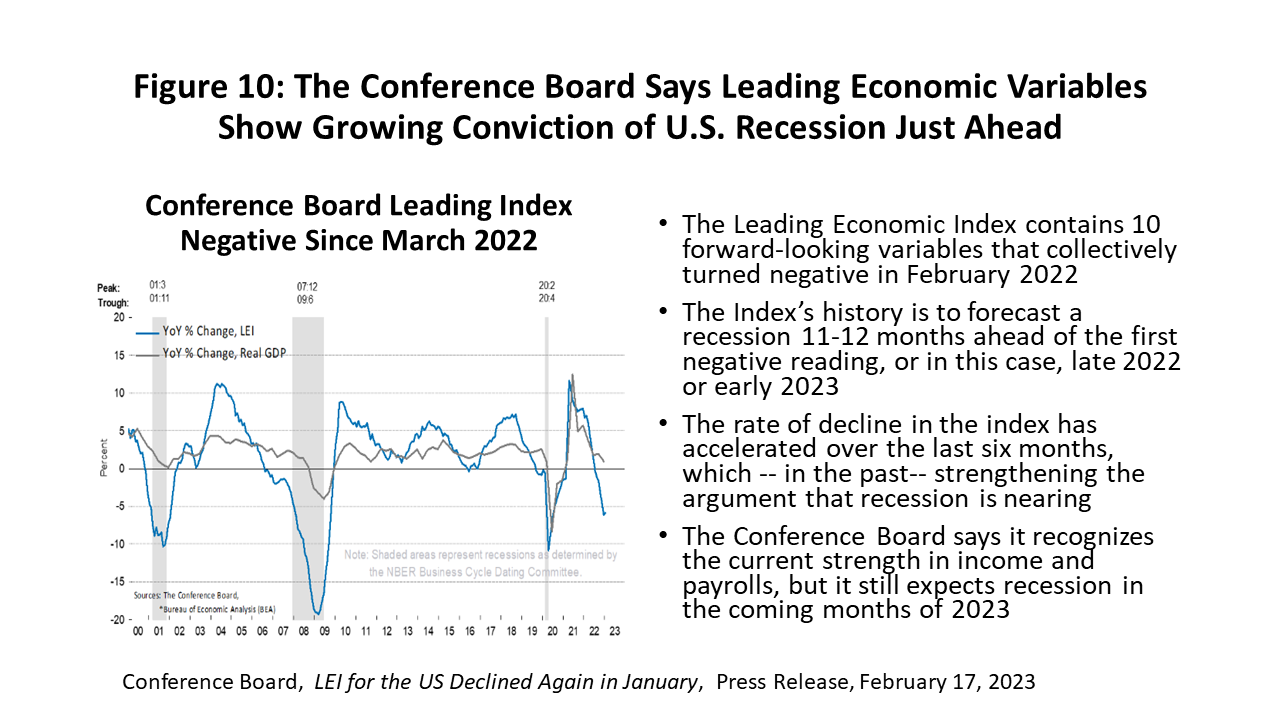
So, when is the recession? To answer this question, we need another set of variables to let us look 12-18 months ahead. The best known of these forward-looking indicators is the Conference Board’s Index of Leading Indicators that includes new orders for consumer or capital goods, the ISM Index of new orders, stock prices, an index of credit conditions, hours worked in manufacturing, building permits for private housing, consumer expectations for business, initial claims for unemployment insurance, and the slope of the yield curve.
Together these indicators turned negative in February 2022, a month before the Federal Reserve’s first rate increases. See Figure 10. Such a decline has in the past been the signal for a recession coming 11-12 months after the first negative reading, implying that the recession should arrive in late 2022 or early 2023. The rate of decline in the index has accelerated in recent months, an event that in the past has served to confirm more strongly that recession is on the way.
Both financial and nonfinancial variables in the leading index are making a large contribution and helping to steer the index toward recession. Measures making the least contribution are stock prices, the yield curve, new orders for manufacturing, and initial claims for unemployment insurance. The current strength of the labor market is explicitly recognized and discussed in the Conference Board’s latest press release, including the weak performance of initial claims – the only jobs measure in its index. However, they point to other jobs-related variables that are not in the index but are in fact pointing to a downturn like temporary help.
Recession Ahead? Reason 3: The Fed Can Make It Happen
The only way out of the Fed forcing a significant slowdown or recession is that inflation somehow disappears from the core measures that the Fed follows, with no need for more action from the Fed. This unlikely scenario is sometimes called the Immaculate Disinflation. After a year of raising short-term rates at the fastest pace since the early 1980s, it is probably too late for the central bank to avoid such damage anyway, as the Fed has moved inside the 12- 24 month window when monetary policy goes to work and slows the economy.
The central bank was embarrassed by letting the inflation genie out of the bottle in 2021 and professional reputations and personal legacies are now at stake. The target now is the household. Don’t count on much easing before the labor market and consumer spending have clearly cracked. It is a matter of when … not if. The longer it takes, the higher the terminal rate, and the worse the economic outcome.
Where does inflation go from here? See Figure 11. The Fed has a critical interest in where the public believes inflation is headed and their expectations for price change. They want business and consumer expectations to return to its two-percent policy goal and stay well-anchored there. If expectations move higher, demands for wage increases can become embedded and kick-off a wage-price spiral. Figure 11 contains several measures of expectations that -- so far – indicate that in coming months the Fed can and will bring core inflation back toward two percent annual rates. All the numbers cited in Figure 11 are for headline inflation.
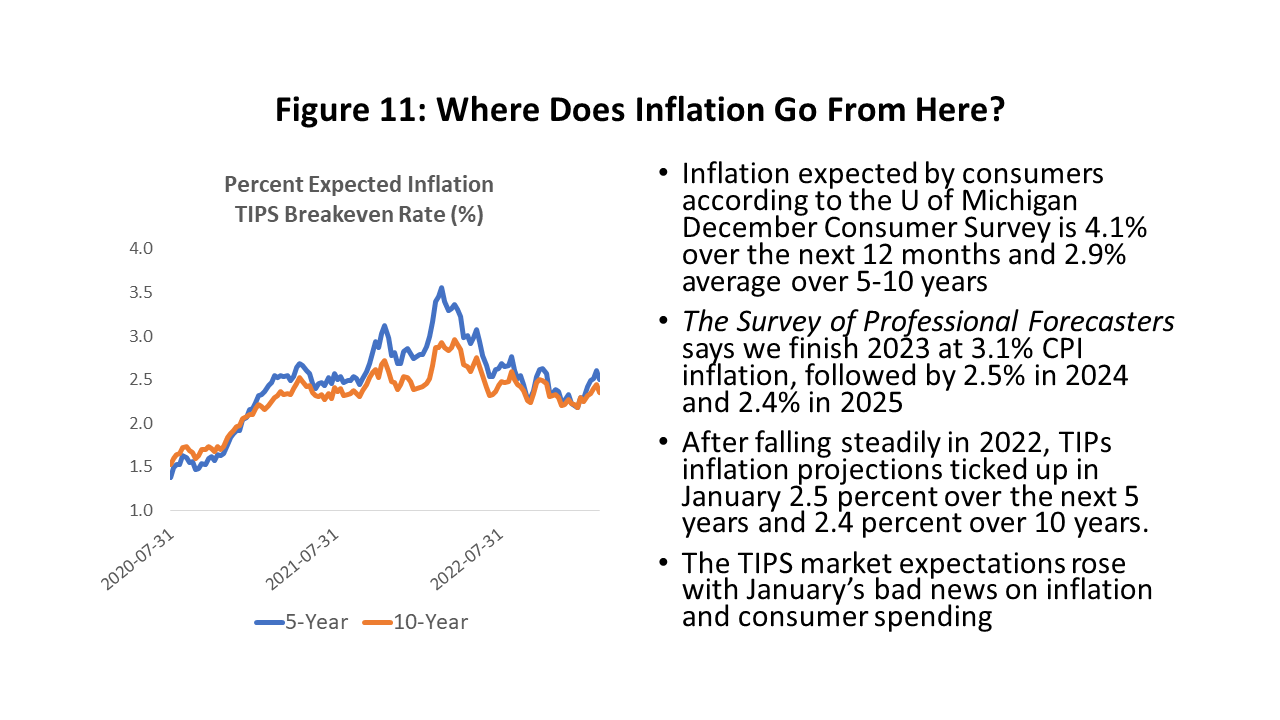
Consumer expectations as measured by the University of Michigan’s widely followed survey says prices will rise 4.1 percent over the next twelve months and 2.9 percent annually over five years. Consumer expectations for inflation have a long history of being too gloomy, but continued cuts to their outlook favor inflation falling under control.
Alternatively, if we look at the headline CPI outlook from the February Survey of Professional Forecasters assembled by the Philadelphia Fed, we see 3.1 percent inflation in 2023 and 2.5 percent in 2024. The longer-run projections to 2032 fall to 2.4 percent.
Over the coming five years the CPI estimated by financial markets – based on the breakeven inflation rate implied by Treasury Inflation-Protected Securities (TIPS) – indicate 2.5 percent inflation annually over five years and 2.4 percent over 10 years. After falling steadily through 2022, these expectations also have risen in recent weeks on a string of adverse news about inflation and household spending.
Certainly, the continued fall over time in expectations in all surveys sets a positive tone. All the inflation estimates listed in Figure 11 include food and energy.
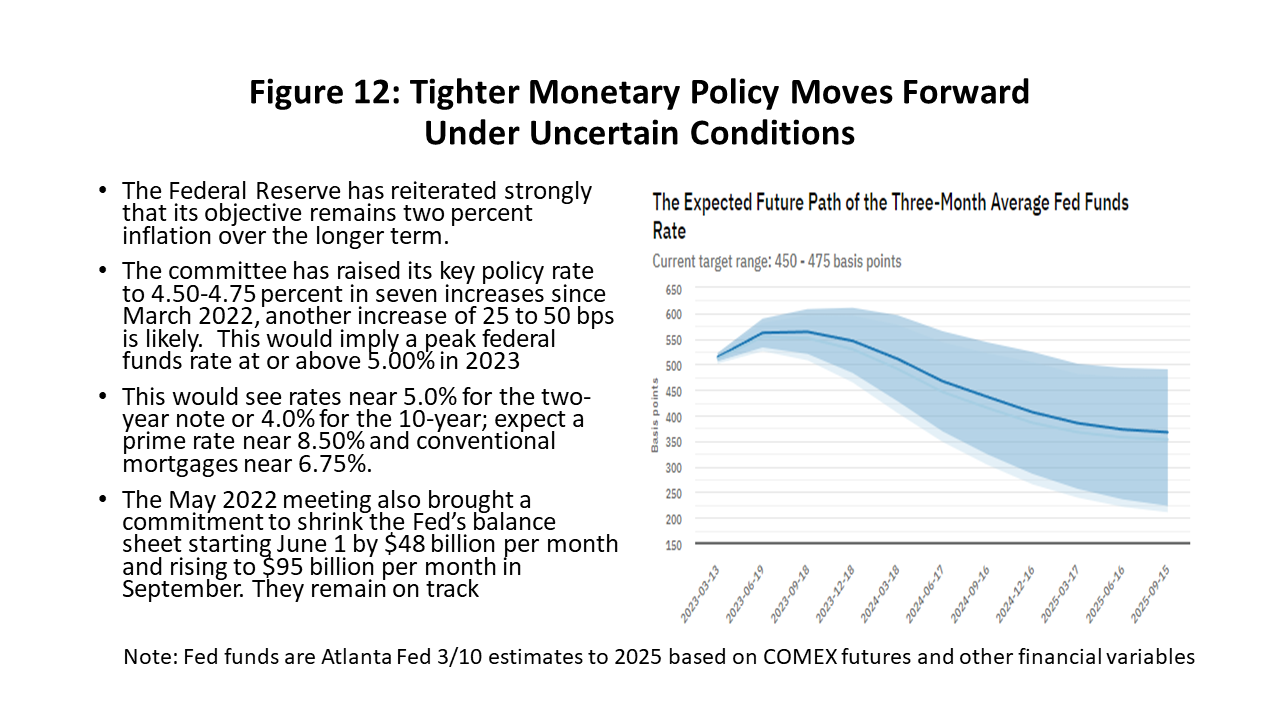
The Fed’s policy committee has now raised its target fed funds rate seven times since March 2022 to a range of 4.5 to 4.75 percent. Markets have priced in another rate increase this month of 25 or 50 basis points. A forecast of fed funds from the Atlanta Fed based on COMEX futures and other market variables sees the federal funds rate peaking near 5.5 percent this summer, and staying high through year-end as the Fed commits to keeping its policy rate high and stable through year-end. The fed funds rate then falls back slowly to 3.5 percent by 2025. The era of zero interest rates is apparently over.
Looking through various bank forecasts, the two-year note might peak at 5.0 percent and the 10-year near 4.0%. The 10-year is widely used as a key rate for mortgage determination and many other important financial decisions. Conventional mortgage rates could rise to 6.75 percent and the prime rate to 8.25 percent.
The Houston Outlook
There is no question that Houston’s payroll employment has produced extraordinary growth numbers in recent years. Its 2019 total payroll growth was right on a typical trend pace of 54,500 or 1.7 percent. Then came the pandemic and the loss of 183,900 jobs, then the return of 172,100 in 2021, and finally another 148,700 last year.1 Since the pandemic jobs were all recovered last April, Houston moved into a new economic expansion and added 116,000 new jobs.
But we need to be careful in how we interpret these job gains. Houston’s growth has been right in line with the post-pandemic recovery seen across the nation. Like the nation, local job growth and spending by Houston households are the strength of the current business cycle and drivers of solid economic expansion.
At the same time, we have not shared fully in the Texas employment boom, lagging the state and all of its other major metro areas. Blame this on oil which has been an on-going drag on local growth since 2014, just as it has been for other oil-dependent cities across the state.
A recent history of Houston’s payroll employment losses and recoveries are shown in Figure 13, with a lockdown decline of 363,700 jobs or 11.4 percent. This compares to 21.9 million U.S. jobs lost or 14.4 percent. Houston’s decline was smaller thanks to a less restrictive lockdown policy in Texas, and the stronger initial U.S. recovery was a strong bounce back as heavier COVID sanctions were lifted. For most of the recovery, however, Houston and the U.S. were on virtually the same track, but with Houston surging ahead in 2022. By April, Houston had added back all of the lockdown losses, plus since then another 116,800 jobs through this January. The U.S. completed its job recovery two months later in June.
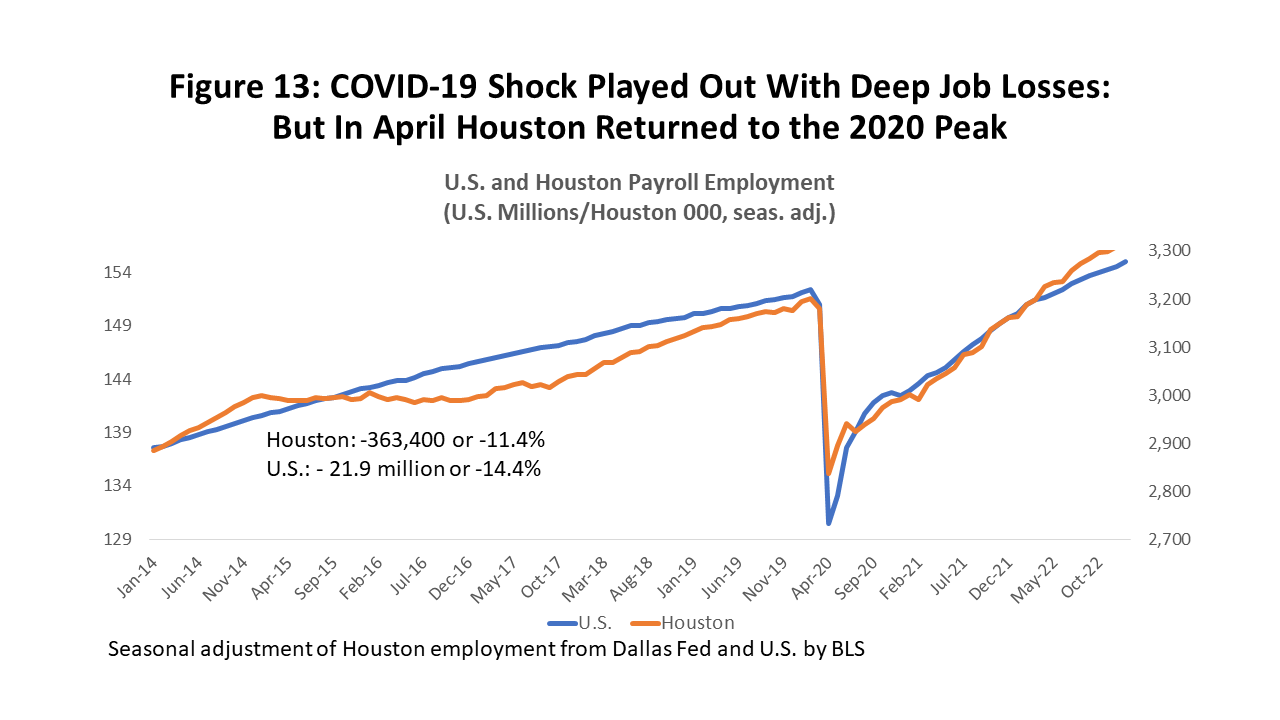
The differing stringency of lockdown rules complicates comparisons of the U.S. and Houston recoveries, as the U.S. brought jobs back at a faster rate but from a lower level. Comparison to other Texas metros is much clearer in the sense that we had the same public health and lockdown rules imposed across the state.
Figure 14 shows the five major Texas metros in the upper part of the chart, and the first column shows the date at which recovery was completed, i.e., when all the COVID jobs were back.
Houston lagged the state as a whole which recovered in October 2021, and it lagged every one of the other major metros.
Column two shows the number of jobs added by each metro after they had returned to pre- COVID levels in February 2020. This is also, of course, a measure of all of the growth in employment since February 2020. Because of the differences in metro size, the percentage employment increases for each metro is in the third column. And after 35 months of recovery, column four shows the annualized growth rate of job growth over the last three years.
In terms of the total new jobs added since COVID, Dallas leads the state with 270,200 and more than doubles the number for Houston. Austin’s number of new jobs also exceed Houston, and it had the fastest growth rate at 13.4 percent. Meanwhile, Houston’s 3.7 percent growth is the slowest, and probably the only one that falls well below its long-term trend growth rate.
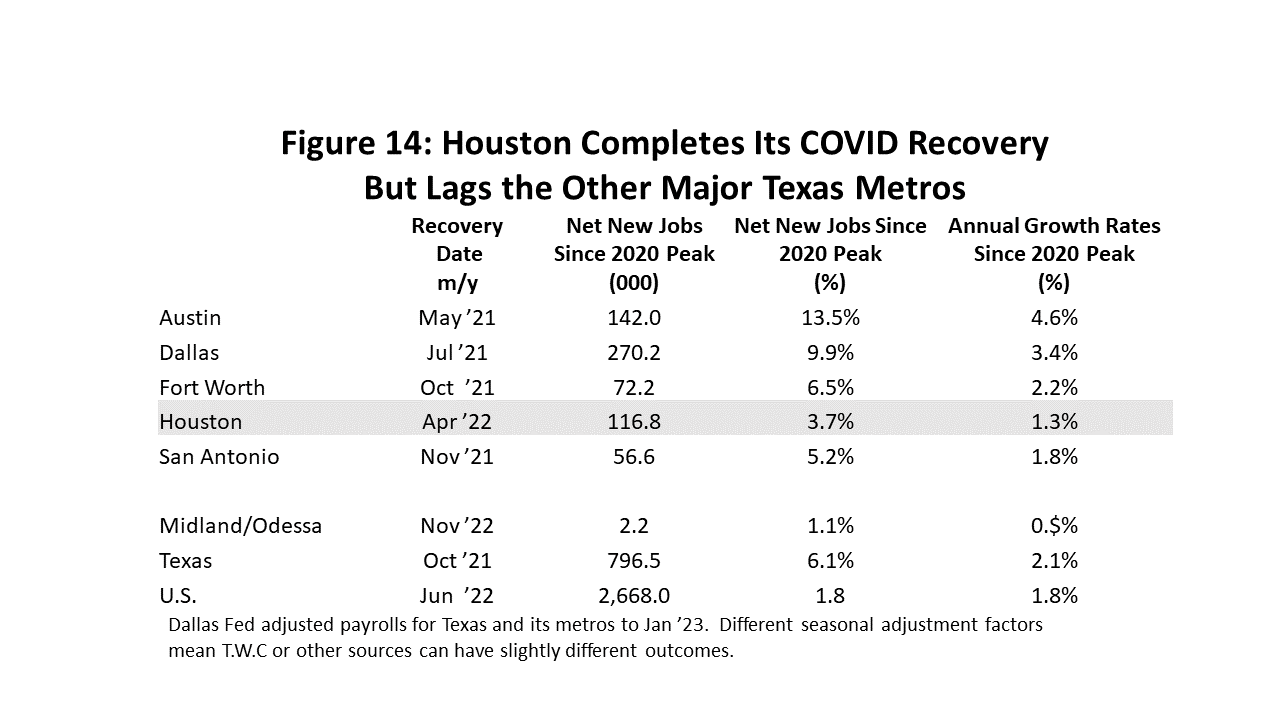
Why has Houston lagged? Note in Figure 14 that Midland/Odessa only managed to complete its recovery in November and has since added only 2,200 jobs. This is the heart of the state’s oil producing region, and these cities -- like Houston – are highly dependent on oil-related jobs.
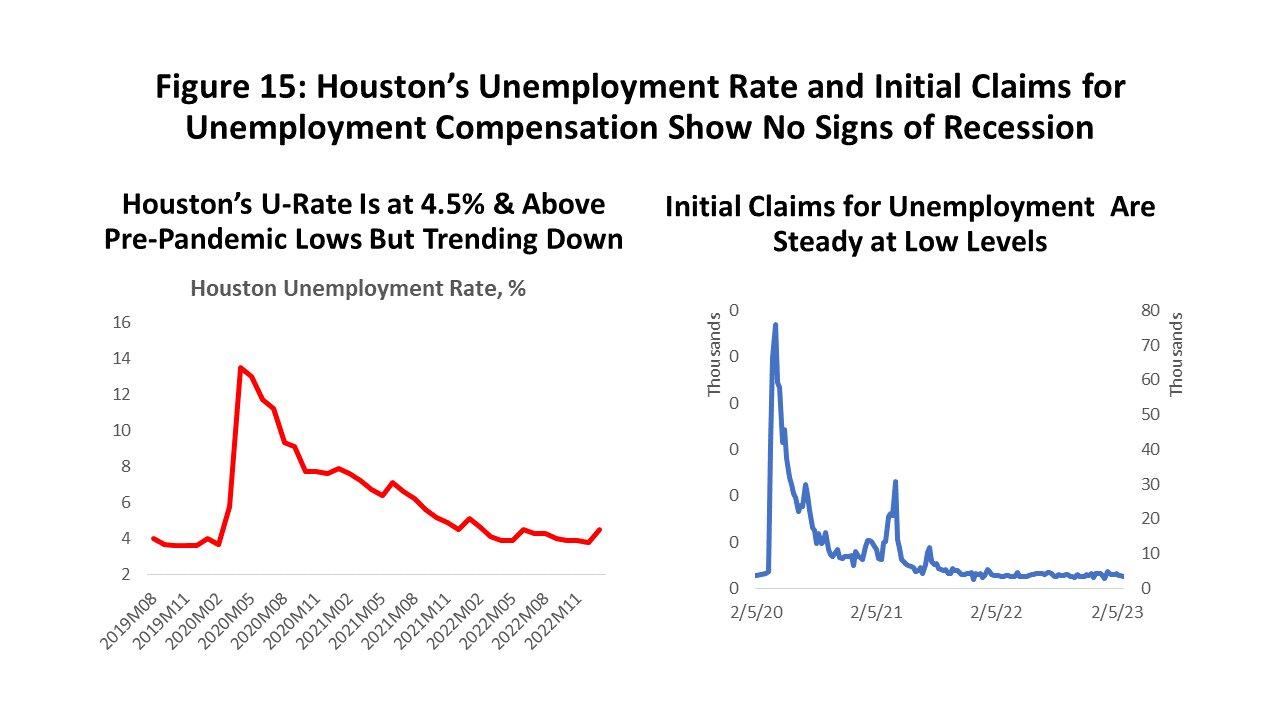
While Houston has other sources of growth apart from oil, we can strongly infer that Houston’s relatively slow recovery is centered in its large oil sector. But Houston’s payroll data is well in line with the rest of the nation, which means there is significant strength. And there is no sign of a local cyclical slowdown ahead based on other measures in the household sector. The right side of Figure 15, for example, shows a post- pandemic unemployment rate that has fallen back to 4.5 percent and still trending downward. Various rules-of-thumb for cyclical weakness emerging from the unemployment measures show no negative signals. The right side of the figure shows the pandemic history of initial claims for unemployment which have fallen back to pre-pandemic levels, remain at low levels, and also show no sign of cyclical weakness.
But also like the U.S., once we move away from households and the labor market we see a much softer economic picture. For example, Figure 16 shows the history of the U.S. and Houston ISM or purchasing manager indexes. The U.S. index is for manufacturing, while the Houston index has begun to diversify away from manufacturing and into a wider base. For now, this diversification has probably served only to give a softer edge to oil, refining, chemicals, plastics, fabricated metals, and machinery. The comparison to U.S. manufacturing is still fair.
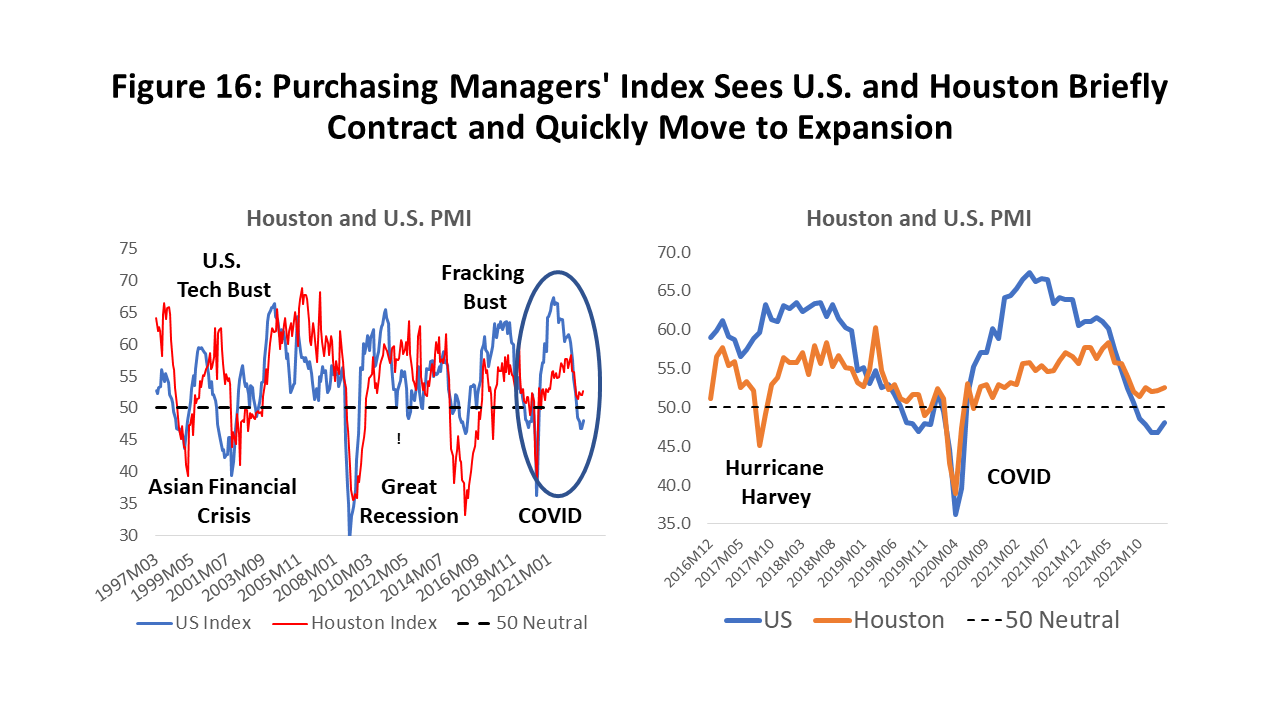
The U.S. ISM saw a quick recovery from COVID to high levels, a peak in April 2021, and an accelerating decline beginning with the first rate hikes in early 2022. We have now seen negative readings and contraction in manufacturing for the last four months. In Houston, the ISM recovery was slower because of the drag from the oil collapse that accompanied the COVID crisis, and the recent decline in the index came in May 2022 along with the Fed rate increases. The Houston index has flirted with contraction but now only indicates very slow growth.
The regional economic base is another way to ask how badly the pandemic downturn hurt Houston to see the state of local recovery. This puts total payroll employment aside and looks for a select group of key employment sectors that drive expansion and contraction in the local economy.2 These basic industries are those that export their goods and services to the rest of the state, nation, or world. Their exports bring fresh revenue and income into the metro area, drive local expansion, and create growth opportunities among secondary, inherently local activities like bars, restaurants, retail, dry cleaners, barbers, or most of health care.
When COVID struck most of the impact of social-distancing fell on these secondary industries. The local base industries, meanwhile, were initially little concerned with Houston’s lockdown. After all, base customers were not here but scattered across the state or around the world. But when the lockdown restrictions turned national and global, affecting every U.S. and many global cities, the local base jobs were suddenly part of the COVID crisis.
Figure 17 shows that through the past 32 years about half of Houston’s economic base stemmed from oil and gas, while the other half is comprised of local export-oriented industries that depend on the national business cycle. The right side of the figure shows that during the pandemic the total base – oil plus not oil -- lost 87,700 jobs among these important cyclical drivers. The trough was found in January 2021, as both oil-related and the other base jobs turned up at the same time.
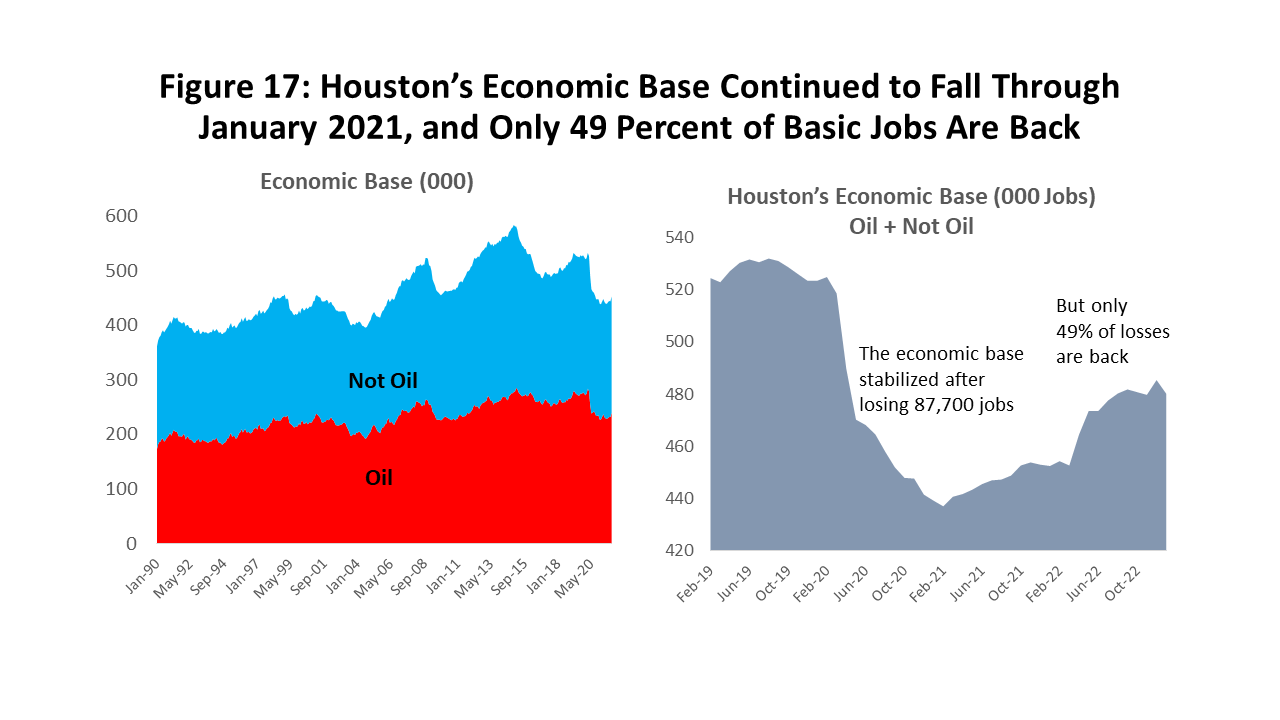
The pain from base losses was shared as non-oil industries that sell to the rest of the nation or world accounting for 49,900 lost jobs, while the oil base fell by 37,700. The table below shows that only about half the losses in each sector had been restored by January 2023. A meaningful part of the oil sector was not expected to fully recover because of the new financial model that oil producers have adopted, but the slow and partial recovery of the non-oil jobs is concerning.
TABLE: --Base Not Oil Oil Non-Basic COVID Losses (000) -87.7 -49.9 -37.7 -172.5 Recoveries (000) 43.0 24.4 17.9 329.2 Net Losses (000) -44.6 -25.5 -19.8 156.7 % Recoveries 49.1% 48.9% 47.4% 190.8%
Further, look at the non-basic sector in the table which has added 156,700 new jobs since 2020, which is supposed to be made up of secondary jobs or the followers in the business cycle. These are jobs that should wait for the base recovery before they can grow again: bars, restaurants, barbers, beauticians, private schools, retail stores, entertainment, etc. By nature they are inherently local and require personal contact, and they were badly hurt by social distancing in the COVID downturn. They should have had a strong recovery as vaccines arrived and COVID restrictions began to be lifted in early 2021, but how do they out-strip the performance of the base by such a large margin?
This secondary job growth is unsupported by economic fundamentals., i.e., by adequate growth in the economic base. Sound familiar? This is job growth that almost certainly accompanied the stimulus, excess savings, and spending discussed earlier in the report, i.e., spending that was similarly unsupported by economic fundamentals. For Houston this implies a large number of secondary jobs that are currently supported by a financial base that is rapidly being eaten by inflation, and free-spending consumers fooled by the money illusion.
Oil Now a Smaller, More Stable Force for Houston
We have repeatedly stressed in past reports that the future impact of oil on Houston will be smaller but more stable. The fracking industry has realized it is a high-cost source of oil and that it can no longer rely on high oil prices and rising equity values as a means to attract investment and finance oil-field activity. Instead, it has committed to using 30-40 percent of its free cash flow to attract investors. This means substantially less activity in the oil fields at every prevailing oil price than would have previously been expected.
One loose analogy to producer behavior as they now move through the oil-price cycle is that they now are treating their balance sheet as a rainy-day fund. In place of pouring their cash into drilling activity every time the price of oil rises, they use part of it to fortify their balance sheet and reward their investors. Then they can better weather low oil prices based on their financial strength. The producers benefit individually, and the Houston economy benefits from their collective actions to stabilize the industry over the oil cycle.
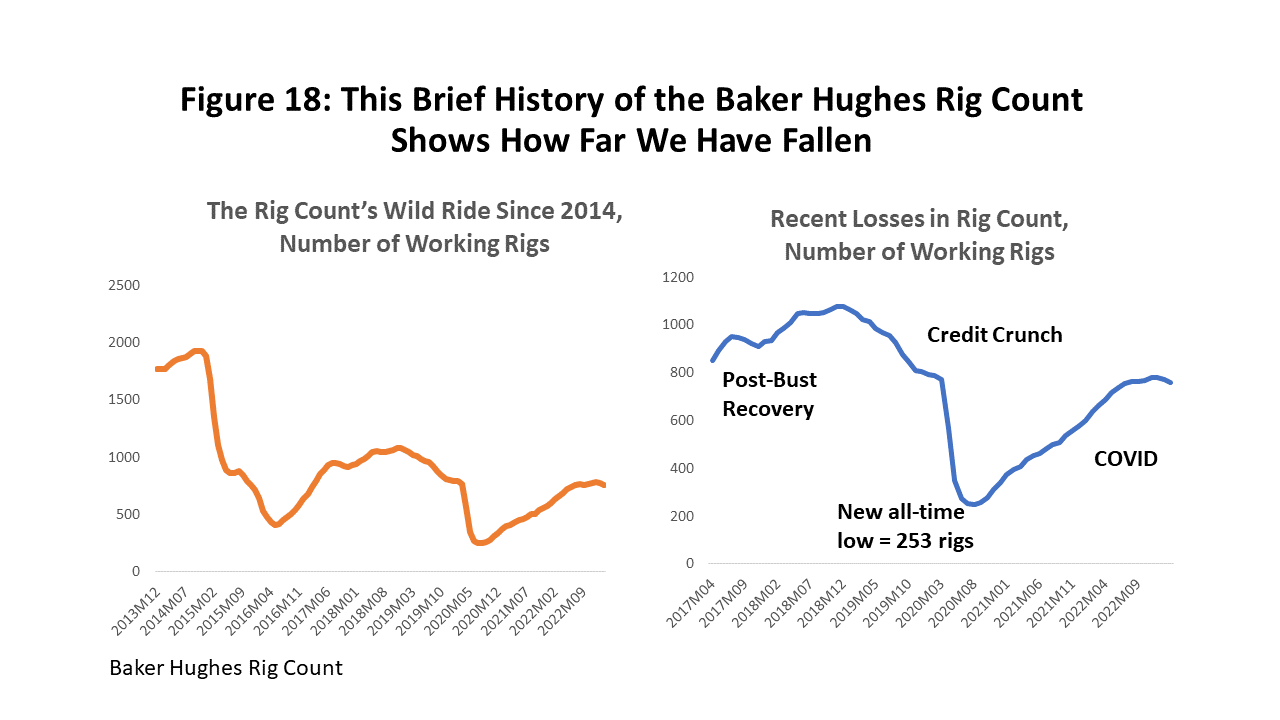
Both the reduced levels of activity and the end of a boom/bust mentality are well illustrated by looking at the rig count in Figure 18. The rig count reached a blow-out level of 2000 working rigs in the fracking boom years before 2014 that were driven on $100 oil; this fell to 1000 rigs after the fracking bust recovery in 2018; and now seems to be settling in at 760 rigs in recent months. This is despite oil prices that continuously have been $70 per barrel or higher since late 2021.
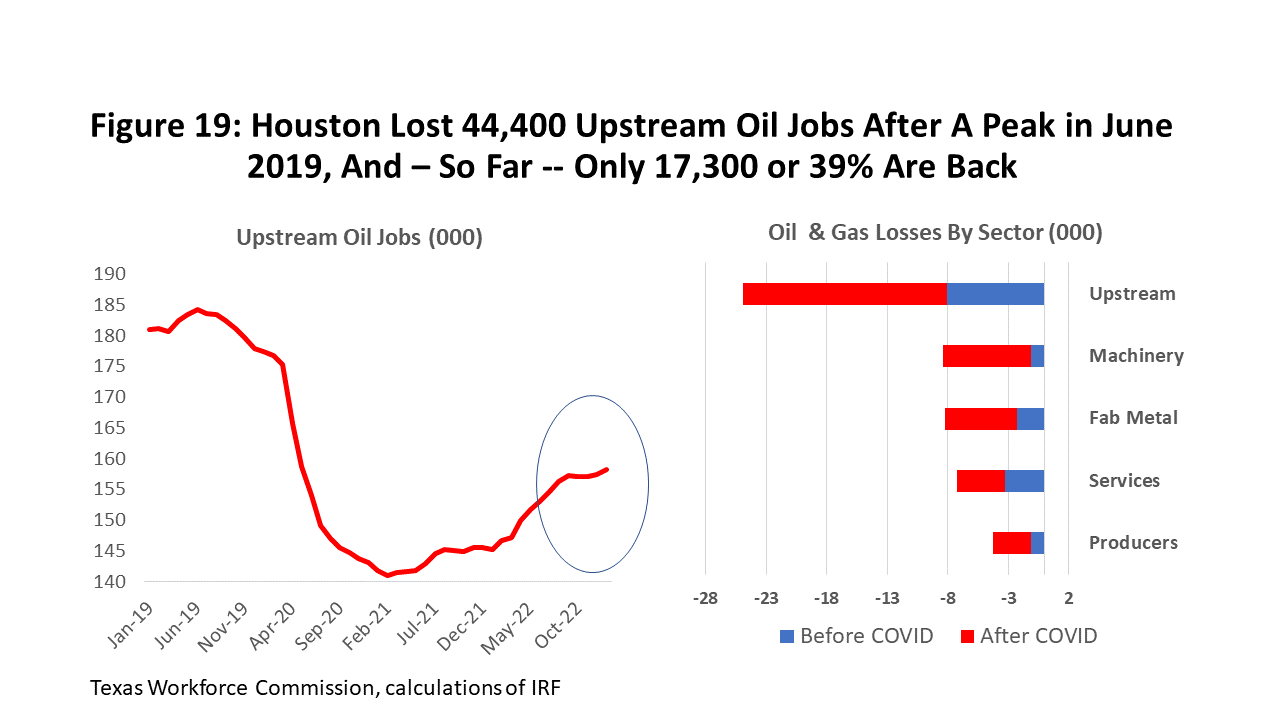
Oil-related employment in Houston has behaved in much the same way – slower and lower in spite of the healthy oil prices. See Figure 19. After losing 44,000 upstream oil jobs to the COVID pandemic and Saudi/Russian oil war, the return of these jobs stalled last fall with Houston still over 25,000 upstream jobs short of pre-COVID levels. If we begin counting from the end of the fracking boom in 2014, Houston has now lost 77,200 oil-related jobs, with growth in other oil sectors helping offset the loss of 80,500 in upstream activities.
Oil has sometimes acted as a counter-cyclical force for Houston, but more often has reinforced the local cycle – high oil prices are driven by economic booms and low oil prices by slow growth or recession. This time we expect better producer behavior than in the past, with slow growth or modest recession pulling oil prices down from the current $75 to $65. It means a limited slowdown by the industry and few job losses.
Houston’s Employment Outlook
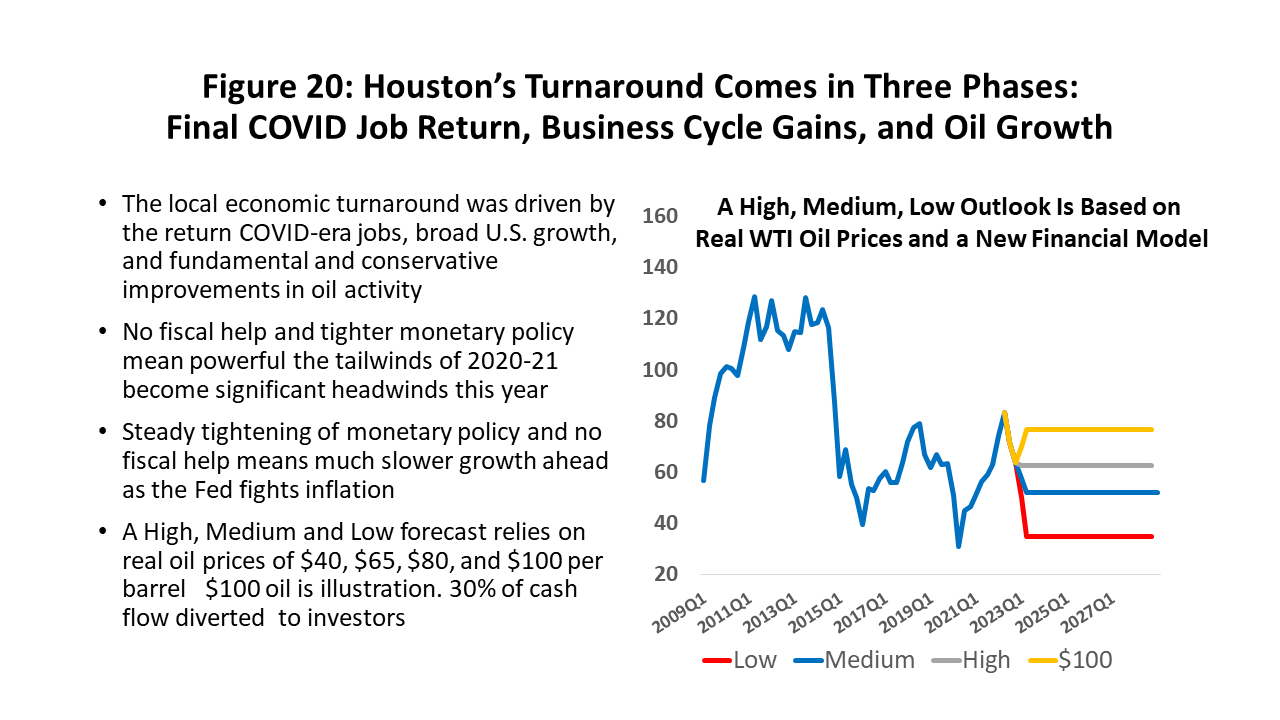
To pull the forecast together, we use a high, medium, and low outlook for planning purposes. We use the oil prices in Figure 20 as a vehicle to spread the outlook from high to low employment levels. For current planning, high oil price is set near $80 per barrel and the low is $40. The medium or most likely price is $65 per barrel or the long-run marginal cost of oil. In all cases, we use the new financial model with 30 percent of oil industry free cash flow diverted to investors or used to fortify the firm’s finances. This smaller industry and slower-growing limits our expectations for oil-field expansion and regional growth.
Figure 20 adds to the forecast the impact of $100 oil prices. With the on-going war in Ukraine, this price may prove briefly relevant again. But it is primarily an illustration of how a prolonged period of $100 oil will probably never again mean what it once did in Houston.
With COVID behind us, 2023 sees economic fundamentals return to the driver’s seat as oil and the U.S. economy take control, while the hangover from fiscal/monetary stimulus will disappear – either with or without the Fed’s help. Employment and spending with both take a one-time hit as the artificial help from stimulus disappears.
We follow the lead of the Survey of Professional Forecasters in assuming a slowdown in U.S. growth to a near standstill in 2022Q2 and average monthly growth of only 37,000 jobs through the last nine months of the year; this is followed by 43,000 jobs in each month of 2024. This number of jobs is probably 25-30 percent of normal for an economy that has put COVID well behind it. There is no recession -- just a prolonged slowdown -- and growth picks up quickly and moves above trend in 2025.
As long as the price of oil is $65 or above, we assume that U.S. oil producers act on the $65 price level -- and very cautiously at any higher price -- for their production and employment decisions. They use oil’s new financial model and divert at least 30 percent of free cash flows to investors or to strengthen company finances.
Figure 21 shows how these economic fundamentals play out over the long run for Houston payrolls in the low, medium, high, and $100 cases. This is our forecast of Houston’s future as far as calendar year 2027. We see the COVID lockdowns end and recovery to pre-pandemic employment levels and beyond, a sharp slowdown in 2023 that barely skirts zero growth, followed by 2024 as a second slow year. We a bounce back well above trend in 2025 before reverting to long-run norms.
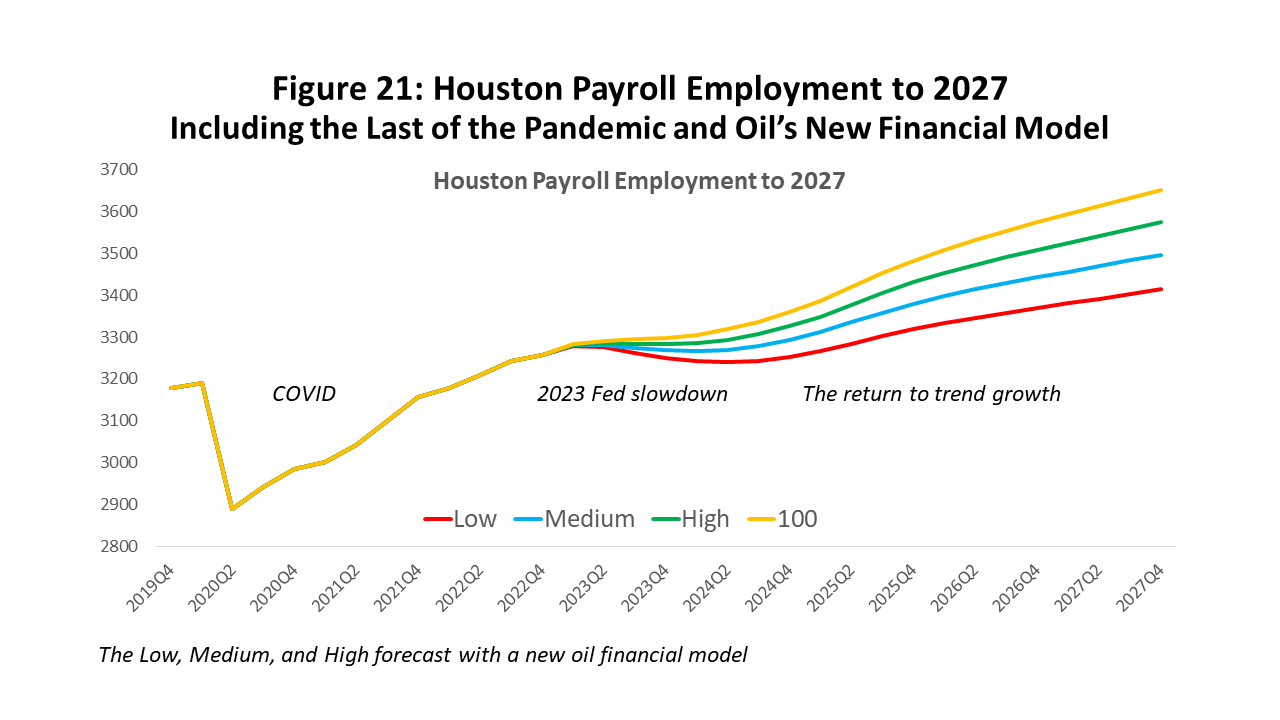
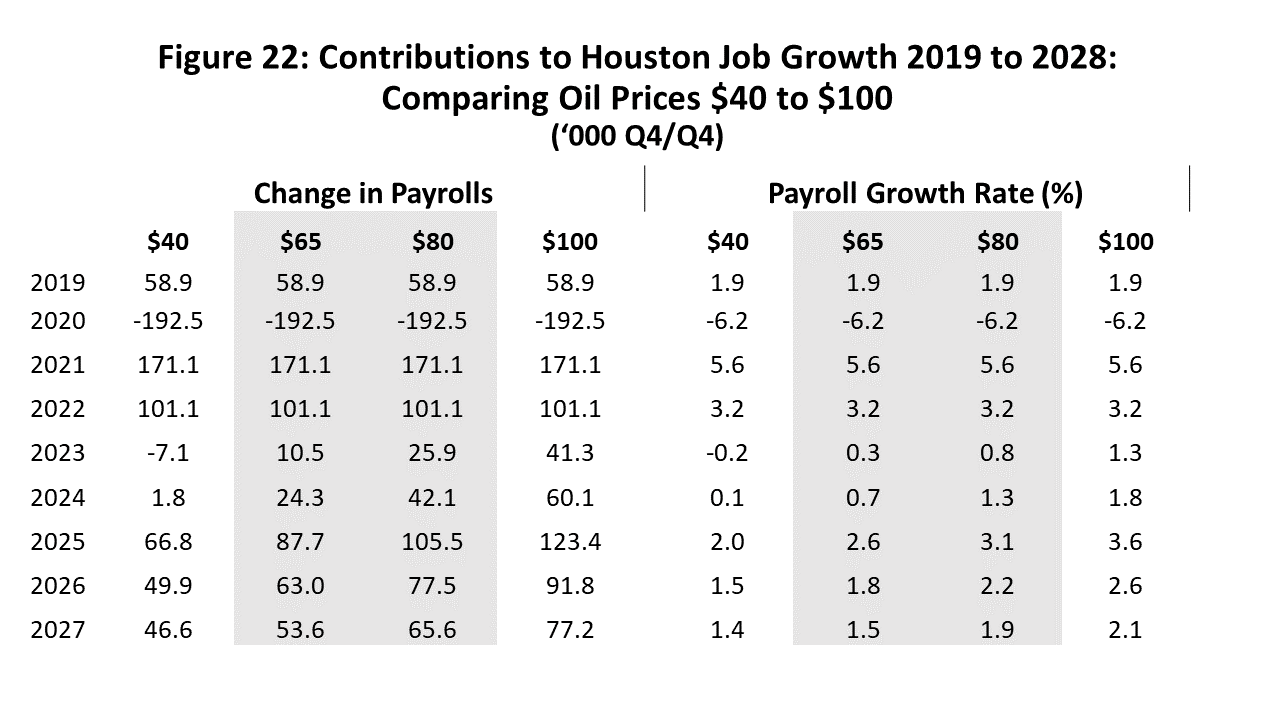
Figure 22 is this same forecast of Houston’s payroll employment to 2027 stated in annual changes measured from Q4 to Q4 each year. The focus for the outlook should be the medium and high forecasts with oil currently near $75 per barrel but assumed to fall back to $65 along with the growth slowdown that comes this year.
We saw the loss of 192,500 jobs in the lockdown year of 2020 or a 6.2 percent decline in payrolls. This followed by the return in 2021 of 171,100 jobs led primarily by the return of contact-sensitive secondary jobs. Then come a strong 101,100 new jobs in 2022 or 3.9 percent.
This year sees a major slowdown in job growth to between 10,500 and 25,900, depending on a price of oil between $65 and $80. This is followed by a 24,300 to 42,100, again depending on oil price. This would make 2023-24 sub-par years that run below trend, but 2025 and the years beyond reflect a return to near trend growth.
Written by:
Robert W. “Bill” Gilmer, Ph.D.
Director, Institute for Regional Forecasting
March 17, 2023
University of Houston
C. T. Bauer College of Business
1 The 148,700 figure for last year was just revised down from 179,000 in early March, and more downward revisions seem likely. Revisions are based on moving from a preliminary sample of employment to administrative records. Payroll employment is a count of the number of workers eligible for unemployment compensation, and the records finally provide a count instead of just a sample. The records are then repeatedly revised. I found the latest downward revisions were strongly indicated by the new records and probably should have been pushed even lower. Also, the fourth quarter of last year is still unrevised (sample data only) and these sample figure now look well out of line with the first three quarters. My guess is that once all the final revisions to 2023 payroll employment will show a figure nearer 100,00 than 148,700. The 100,000 would still be a solid increase at this point in the pandemic recovery. I have used the 100,000 jobs for 2022 as the starting point for the 2023 forecast.
2 Houston’s economic base contains upstream oil (producers, services, machinery, and fabricated metals) and downstream oil (refining, chemicals, and plastics). There are also pipelines, non-oil manufacturing, and selected sectors in construction, professional and business services, wholesale trade and air transportation. Calculations use location quotients for excess employment as drawn from a typical textbook. Also see Scott J. Brown, N. Edward Coulson, and Robert F. Engle, “On the Determination of the Regional Base and Regional Multipliers,” Regional Science and Urban Economics,” (1992), vol. 22, pp. 619-635.