Houston Updates
-
Archive
- June 2025
- March 2025
- December 10, 2024
- September 14, 2024
- May 21, 2024
- March 19, 2024
- December 9, 2023
- June 16, 2023
- April 6, 2023
- March 17, 2023
- Dec. 19, 2022
- Sept. 14, 2022
- July 4, 2022
- March 27, 2022
- March 9, 2022
- September 2021
- April 2021
- March 2021
- September 2020
- August 2020
- June 2020
- April 2020
- March 2020
- January 2020
- December 2018
- June 2018
- March 2018
- February 2018
- January 2018
- September 2017
- September 2017 Post-Hurricane
- June 2017
- March 2017
- January 2017
- September 2016
- March 2016
- December 2015
- September 2015
- June 2015
- March 2015
- December 2014
- June 2014
- March 2014
- November 2013
- September 2013
Houston's Outlook for 2017: Is the Worst Behind Us?
January 2, 2017
As we celebrate the New Year, 2017 has delivered much better news about oil markets and Houston’s economy. Oil markets appear to be moving toward rebalancing, with oil prices currently holding in the $50-$55 range. Further improvement in the price of oil is the key to Houston’s near-term future, and nothing is assured yet. We saw similar gains fall apart over the summer of 2015, and have not yet reached the $65 per barrel that would assure a healthy and moderately-growing North American fracking industry.
The mix of factors that drive Houston’s economy right now are quickly changing. Momentum from rapid growth in the fracking boom has largely dissipated after two years of no job growth; the eastside petrochemical boom is ending; and upstream drilling jobs are not yet returning. The U.S. economy remains the one stalwart, helping out, just as it has throughout the downturn. We must hope that drilling continues to make substantial progress in the coming year, bringing back some of the 70,000 oil-related jobs lost in the last 24 months. It will take a very quick and strong turnaround in drilling activity to bring significant payroll job growth to Houston in 2017.
Oil in Recovery
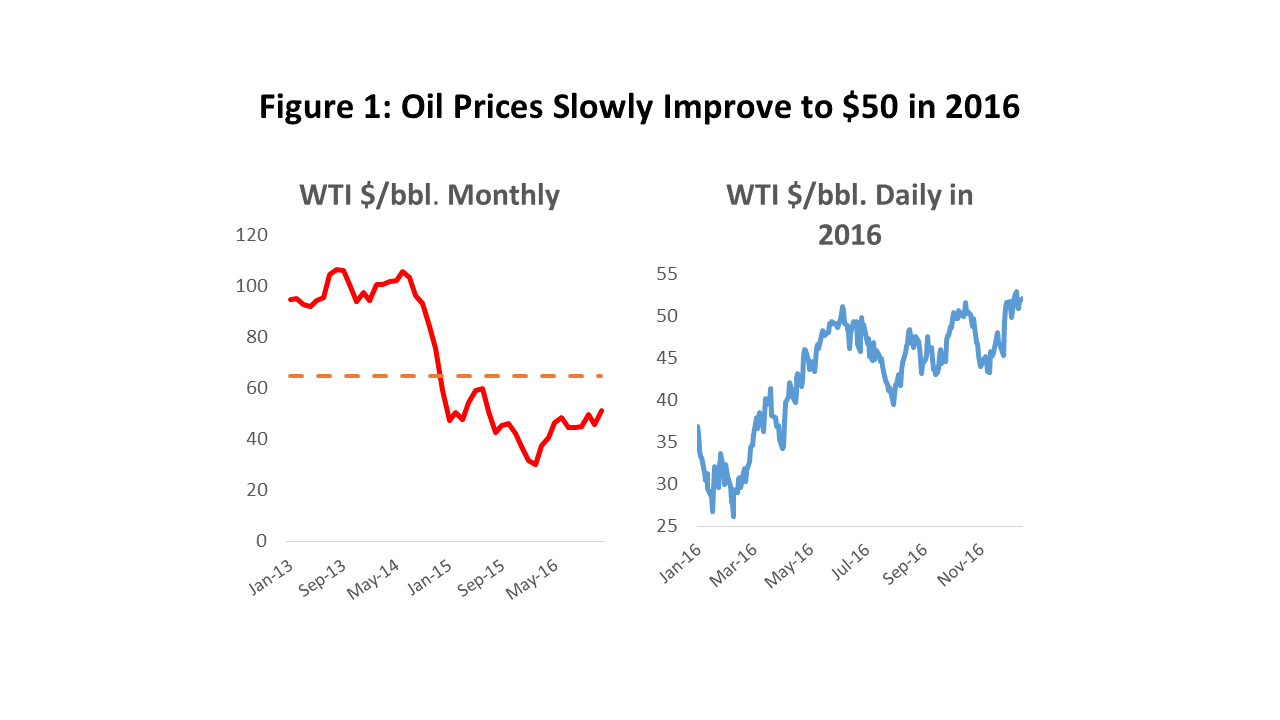
Optimism has crept back into oil markets as the price of oil has slowly improved over the course of 2016. We began the year with a collapse in the price of West Texas Intermediate (WTI) to below $30 per barrel, but have seen it slowly return to near $50 in recent months. Along with better oil prices, consensus is building that the Houston economy may also have seen the worst of this drilling downturn, and that better times are just ahead. There is still plenty of room for caution about both oil markets and Houston’s economy, however, as the progress to date counts only as a good start on the road to recovery. Similar gains in early 2015 evaporated on adverse developments in the global economy, and the current oil price still remains well short of the $65 per barrel needed for full recovery in U.S. drilling activity.
Figure 1 shows the recent history of WTI prices. The latest price rout began on Thanksgiving Day 2014, when OPEC withdrew as the swing producer in world oil markets. OPEC announced they would no longer remove surplus oil from world markets by reducing their production, and passed that job to the high-cost producer -- U.S. fracking and Canadian tar sands. In the summer of 2015, it looked like we might see an early end to the oil bust, with oil prices pushing back to $60 per barrel in June and July. Markets seemed to be rebalancing as inventories fell and drilling activity briefly turned up. Then Iranian oil returned to world markets in July, on the heels of the Iran Nuclear Agreement, and the Chinese signaled weakness in the global economy when they devalued in August. Hope for a near-term recovery evaporated, and the price of oil fell below $30 per barrel by late 2015.
Oil prices made further gains this fall with an apparent agreement among OPEC members, Russia, and several other non-OPEC producers to remove 0.5 to 1.0 million barrels per day from global output. This effort reversed OPEC’s prior commitment to withdraw as swing producer, as it clearly was intended to speed the rebalancing of world oil markets. This reversal was partly because North American production proved more resilient than expected, and also because OPEC member fiscal budgets were under growing pressure. The future success of the agreement remains an open question. The pact was difficult to draw up, and the devil remains in the details of how well it is implemented. Incendiary possibilities remain among key parties to the accord, with Saudi Arabia engaged in two proxy wars in Yemen and Syria, with Iran and Russia on the other side in both cases. A new crown prince in Saudi Arabia has turned the Saudi/Iran conflict into a Sunni/Shia confrontation. History suggests that these agreements will work only as long as Saudi Arabia tolerates the inevitable cheating among many of its OPEC partners.
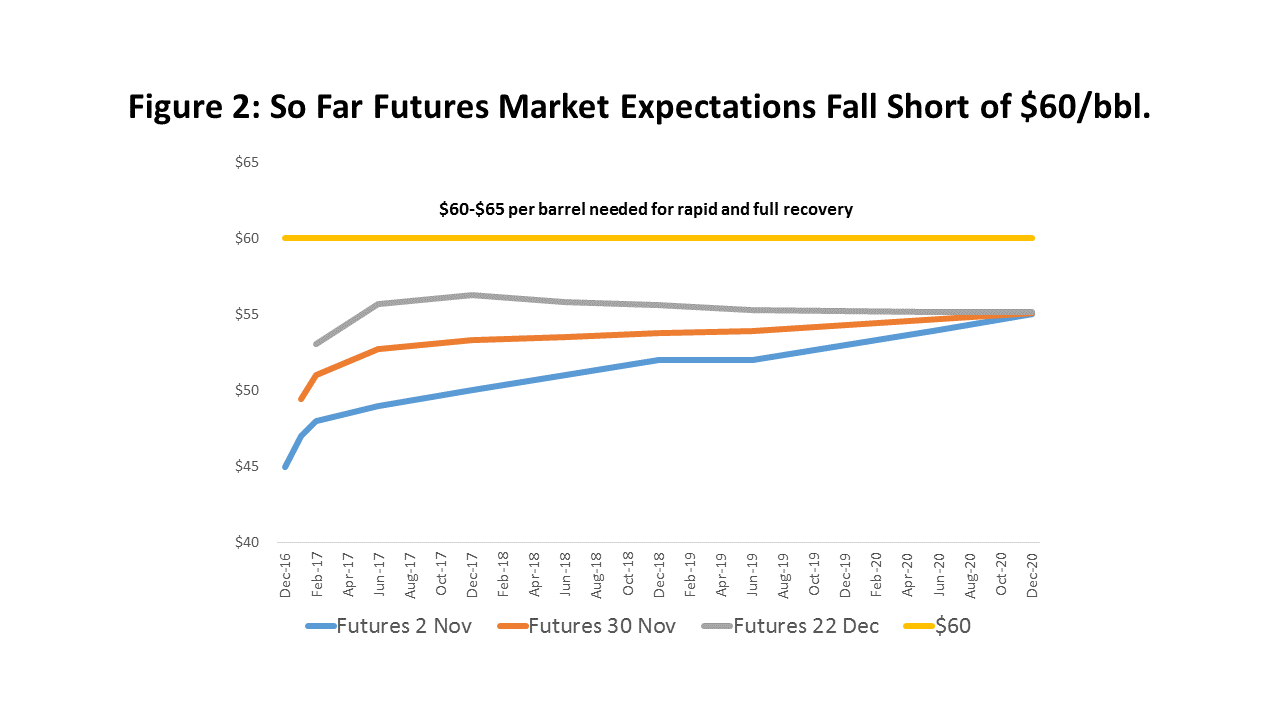
With the OPEC agreement helping rebalance world oil markets, the outlook for oil prices continues to improve. Figure 2 shows the futures curve for WTI prices on November 2, just before the agreement was announced. By November 30, the curve had moved up, reflecting improved sentiment after the OPEC and Russian agreement could be digested by financial markets. It was higher again by December 22 after several non-OPEC members joined in. The agreement provides higher prices, but also medium-term confidence to U.S. producers that a floor is in place for oil prices. However, if $60-$65 is the price needed to assure a healthy U.S. drilling industry, we are not there yet.
A Serious Decline Now Behind Us?
The collapse in the rig count was caused directly by the fall in oil prices in 2014 and 2015. Oil producers are the key decision-makers in the oil market, deciding what to drill for, where to drill, financing the project, and assuming the risk of failure. They may be large integrated companies like Shell, BP, or ExxonMobil, or independent producers like Apache or Anadarko. Oil service companies (Baker Hughes, Halliburton, Schlumberger) are hired to execute the project, and to carry out the drilling, testing, and completion of the well. Many service companies also are important manufacturers of drill bits, drilling fluids, and oil-field machinery.
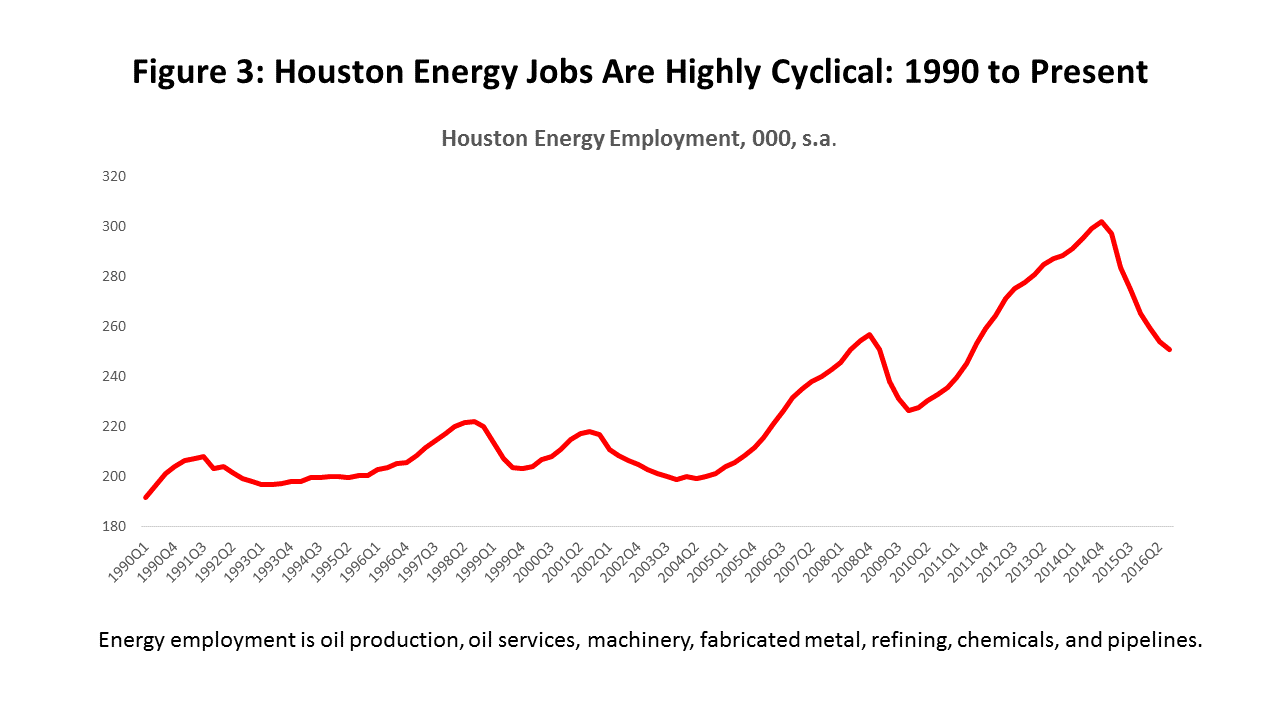
The oil producer’s primary asset is its oil and natural gas reserves, and falling oil and gas prices hurt its balance sheet as the net present value of production from these reserves is marked down. But current cash flows are hit directly and immediately, forcing oil producers to reduce operational levels, cut capital spending, and lay off employees. Capital spending primarily means the replacement or expansion of the producers’ oil and gas reserves, and the number of rigs actively drilling for oil or natural gas can fall precipitously along with oil prices. The oil service companies and their manufacturing operations are early and direct victims of these drilling cuts, both as they lose work at the well head and as demand collapses for their manufactured goods. Figure 3 shows that oil-related jobs in Houston – ground zero for global oil operations and manufacturing –are subject to wide swings, but the current downturn is out of proportion to anything seen in the recent past. A wide variety of other suppliers to the energy industry (wholesale trade, transportation, engineering, professional services) will also find themselves caught up in the ups and downs of the industry.
The level of the oil price matters, as industry economics deteriorate with each leg down in prices. The long-run marginal cost of oil production in North America is about $65 per barrel, and it is the price necessary to keep U.S. fracking and Canadian oil sands active and enjoying moderate growth. A price well above $65 is only a temporary market signal to expand reserves and oil production, and the higher price enables producers to profitably turn to high-cost drilling prospects. A price below $65 is a signal to reduce capacity, and to pull back from higher-cost wells. In a deep downturn such as we have just experienced, producers were force to retreat to only the very best and cheapest drilling prospects, the sweetest of the sweet spots in their portfolio.
As price falls, oil service companies are frequently willing to negotiate lower prices for their services and products. As the oil industry’s economics move from bad to worse, any price above the short-run marginal cost of delivering the service can be attractive, generating some positive cash flow, and allowing these companies to keep staff and crews intact for the coming recovery. This is not a strategy that provides for the long term, however, failing to generate enough cash to cover the replacement of capital equipment. Through the downturn, service companies continue to consume machinery and other equipment, but often fail to maintain or replace it. Cannibalizing moth-balled machinery for replacement parts becomes standard practice.
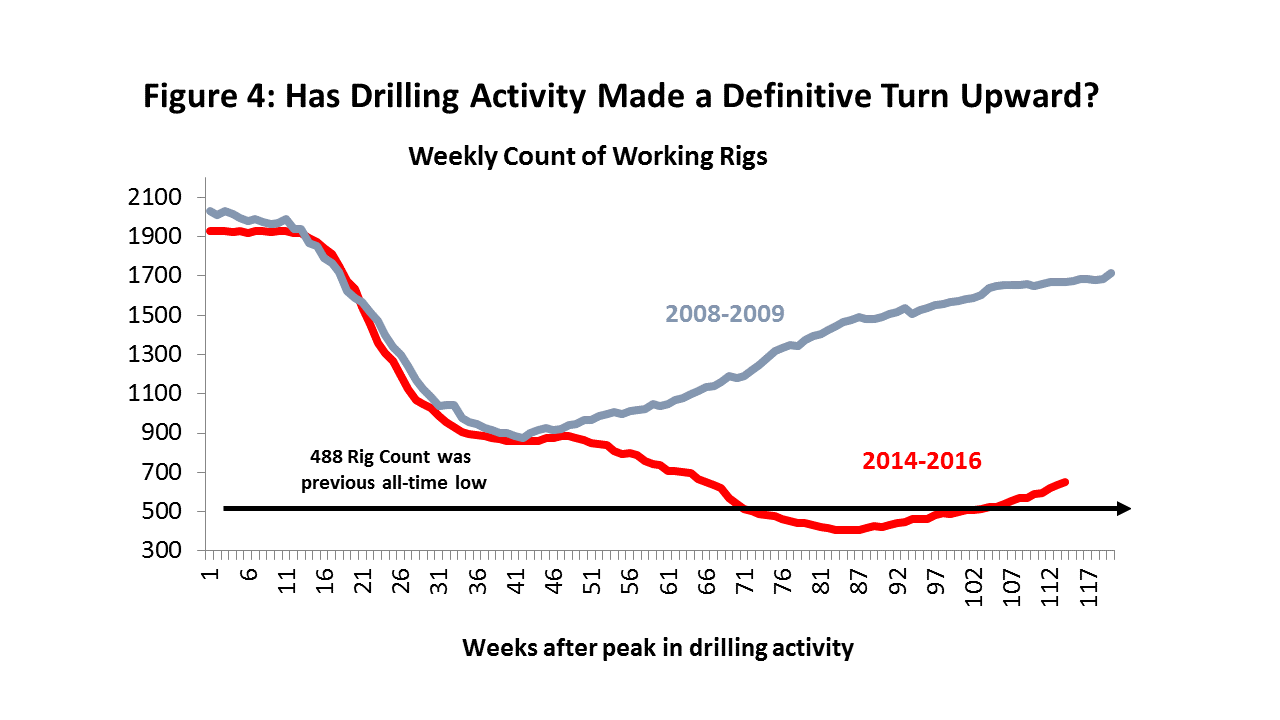
We can now hope that we have completed the downturn phase of the current drilling cycle. It was probably the worst in the history of the U.S. oil industry. The rig count fell to 404 working rigs in May, the smallest number of working rigs In the U.S. since the initial weekly Baker Hughes rig count was taken in 1944. The rig count fell by 75.4 percent in 18 months, short of the 82.4 percent decline seen in the 1980’s, but measured by the decline in capital spending, the fracking bust was three times worse than that experienced in the 1980’s.
Figure 4 compares the fall in the rig count in 2014-16 to drilling activity in the oil price collapse that accompanied the global financial crisis in 2008-09. The aborted recovery in mid-2015, if it had continued, would have seen this upturn closely match the timing of the 2009 revival, but instead we saw renewed collapse, and decline that lasted another 40 weeks. It appears that drilling may have found a definitive bottom in the spring of this year. The slow and steady improvement in oil prices has allayed fears that the initial turn up was nothing more than a brief bounce after a very long and brutal fall.
Moving to Recovery
Recovery marks the return to a high level of drilling activity, but it is a process – not an event. All past drilling recoveries have been impeded by shortages of equipment and personnel, and this recovery will be no exception. The depth of the recent downturn means this recovery has more than the usual amount of lost ground to make up. To the extent that Houston’s economy depends on a return to high levels of drilling, some patience is required as recovery slowly takes hold, and as these gains slowly spill into the local economy.
As drilling activity moves up, the damage from the downturn is slowly reversed. Higher oil prices improve producer cash flows and balance sheets, capital spending improves, the rig count rises, oil service companies become more active at the wellhead, and the demand for machinery and fabricated metals improves. This will not unfold as smoothly and simply as this description makes it sound.
- As in past downturns, drilling costs fell sharply this time. The press and public have been quick to describe this decline as technologically-driven improvements that make fracking much more productive and competitive at low oil prices. The implication is often drawn that these cost savings can somehow be sustained as the recovery proceeds. While some productivity gains will materialize, the majority of the cost reductions in the downturn were described above – short-term price concessions by oil service companies and a move by producers to their very best and cheapest prospects. While there may be some permanent cost reductions attributable to past R&D, the recent depression-like financial environment was simply not conducive to research that brings big productivity gains. Instead, we have seen recent work shift to plain-vanilla fracking jobs, with producers demanding that there be “no science experiments on my jobs.”
- Higher oil prices are necessary to compensate producers for moving to higher-cost prospects, and to reimburse the oil service companies for their capital spending. The oil service companies put this price at $65 per barrel, the level needed for both producers and service companies to enjoy healthy balance sheets.1 At today’s $50-$55 per barrel, we still have a way to go to assure the fracking industry’s long-term financial health.
- So far, the Permian Basin in West Texas has led this current drilling recovery by a wide margin. Since May 27, when the U.S. rig count bottomed out at 404 rigs, nearly 250 rigs have returned to work across the U.S., and the Permian Basin has provided more than half of that improvement. It is still operating at about 50 percent of its 2014 peak level of 568 rigs, but it is already running into serious shortages of fracking sand, machinery and equipment, and crews. Oil service costs are rising. The quick and easy part of the recovery is already over in the Permian Basin, and other oil basins will inevitably follow the same path as recovery spreads. The initial bounce in drilling is just the start of a longer and much slower process.
- In summary, this recovery will follow a road we have been down many times: a quick and easy bounce off the bottom, slowing sharply as it runs into equipment, material, and personnel shortages, and a rig count that grows only as long as incentives remain in place to expand drilling. An oil price of $65 is likely needed to assure a healthy and moderately-expanding fracking industry.
No Good Model from the Past?
There is no good historical precedent for how this recovery will unfold. This is the fifth significant decline in the rig count since 1980, and Figure 5 shows how a drilling recovery unfolded after each of the past downturns. In each case, it shows the improvement in the rig count after a definitive rise in the oil price. It seems likely that the February 2016 WTI average of $30.32 marked the bottom for oil prices, and it has set up the final move into continued recovery.
We can quickly dismiss two past recoveries as inappropriate models for drilling improvements in 2017 and beyond. No recovery ever occurred after the 1982-86 oil bust, at least not in the sense of the rig count returning to near previous highs. The following decade saw both oil prices and the rig count bounce along a shallow bottom. This was the direct result of OPEC’s efforts to prop up oil prices from 1982 to 1986, as they watched oil’s price slowly drift down from today’s equivalent of $140 to $60 per barrel. Acting as a cartel, OPEC held ever-increasing amounts of its own oil production off the market, but by 1986, OPEC woke up to find that its global market share had fallen from 49 to 28 percent. New oil had poured onto the market from the North Sea, Alaska, and Nigeria. Realizing they had played a fool’s game, OPEC dumped their excess reserves back onto world markets, and this oil effectively supplied the planet with another decade’s worth of oil. Oil prices crashed and remained low for years, a clear signal to producers that there was no compelling need to explore for oil for a long time to come. The quick reaction by the Saudi’s and OPEC to the fracking surplus building in world markets in 2014, and their withdrawal as swing producer, was a result of learning this lesson well in 1986.
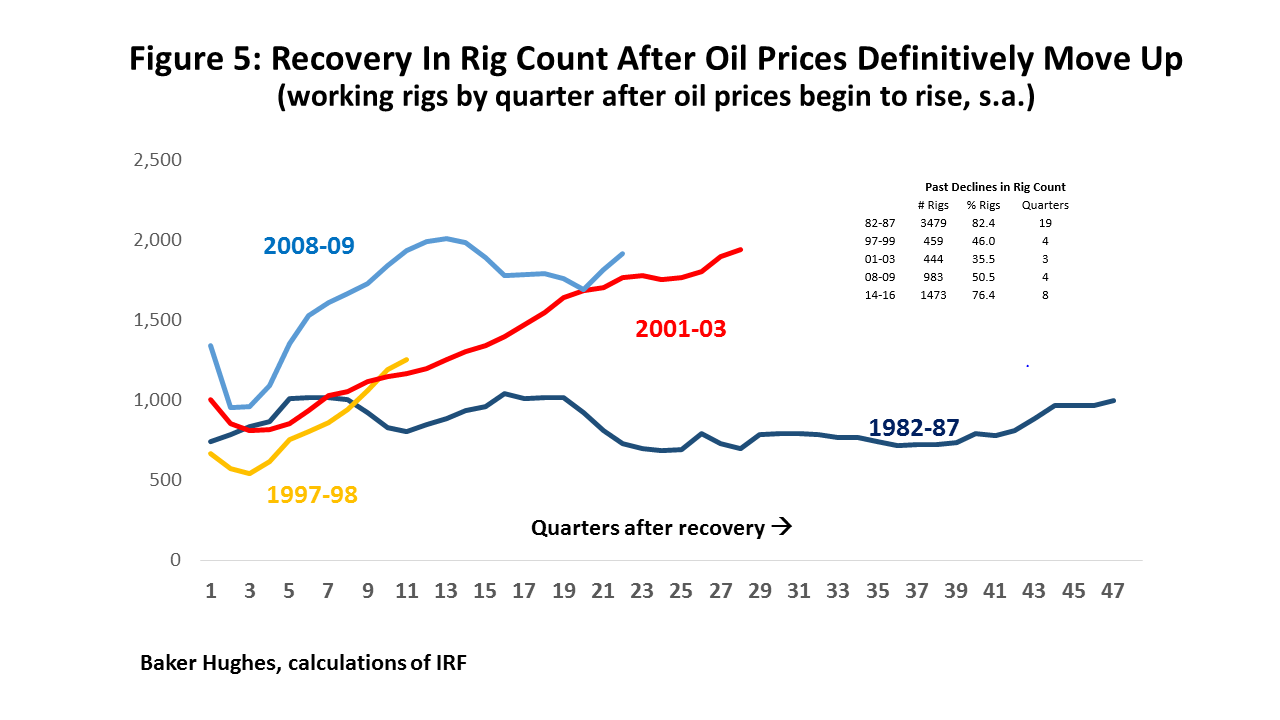
The 2009-09 recovery is also a poor model for 2017. The financial crisis and global recession came near the end of a commodity boom that began around 2003, driven by a surge in economic growth by emerging markets. As late as 2009, however, economic growth in China, India and Brazil remained strong, and this growth propelled oil prices back to $80 per barrel by mid-2010, and over $100 per barrel by 2011. Renewed drilling activity followed, with the rig count returning to high levels very quickly. The near-term price incentives will likely be closer to $60 per barrel this time, and the recovery accordingly slower.
The small chart in the upper, right-hand corner of Figure 5 describes the drilling reversal that preceded each of these recoveries. If the recoveries in 1997-99 and 2001-03 are not good models for current events, it is the because of the relatively short and mild downturns that preceded them. The drilling decline in 1997-99 accompanied the Asian Financial Crisis, with the rig count falling 46.0 percent over 4 quarters. The decline that accompanied the Tech Bust and U.S. recession in 2001-03 was even milder, with a 35.5 percent reversal over only 3 quarters. The 2001-03 recovery was relatively long at 11 quarters, despite the fact that the path to recovery was short. The current recovery, if it holds, will follow the deepest and longest setback to modern drilling since the 1980’s, and it will likely require a long time to make up lost ground. As we see below, it may take 13 to 17 quarters before the rig count finds a new equilibrium, even if drilling snaps back quickly in these historical comparisons.
Three Scenarios
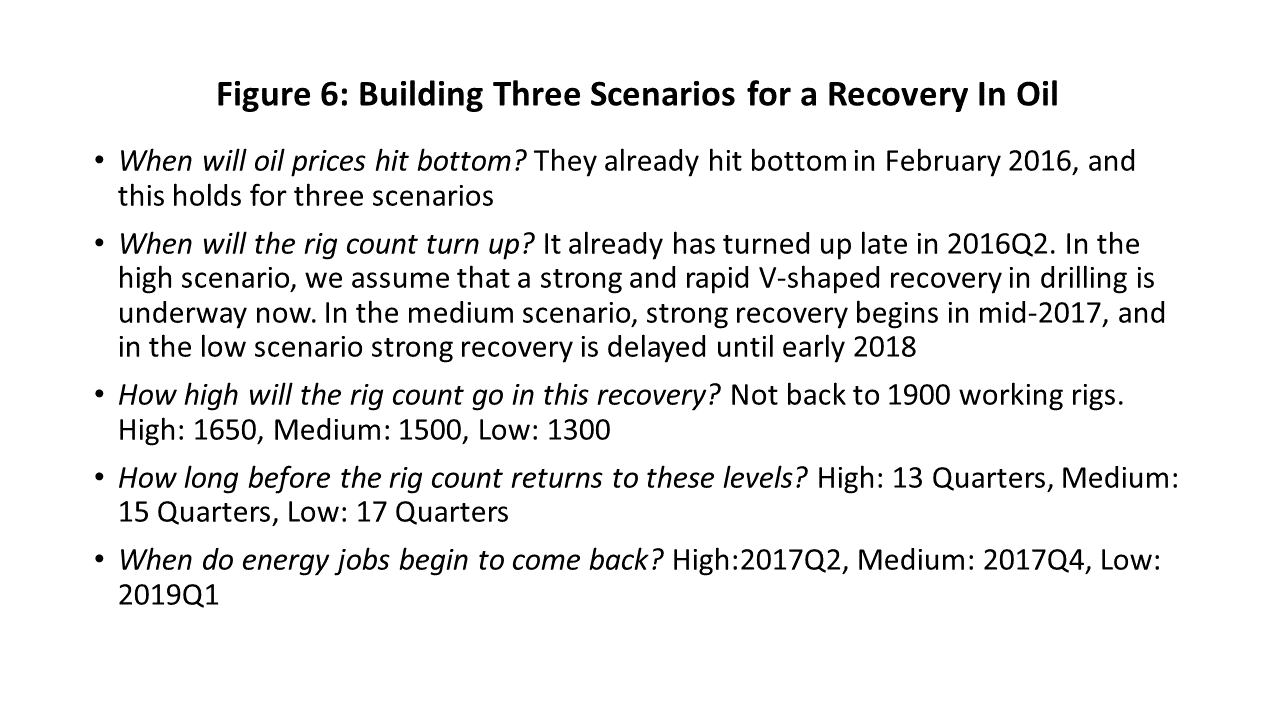
If history doesn’t provide an obvious model for what is unfolding now, we have selectively chosen parts of history and reassembled them into three scenarios: high, medium, and low. The results are summarized in Figure 6. These scenarios are used to simulate the response of Houston job growth under three different drilling recoveries. The low scenario is chosen to be quite pessimistic, specifically to illustrate the impact on the local economy of a late, slow, and low return to high levels of drilling.
- We assume that oil prices hit bottom in February 2016, and have now made a definitive turn upward. We further assume oil prices continue to improve to $65 per barrel with no substantial or prolonged deterioration in price.
- The rig count turned up in late May of this year. The earnings reports from the major oil service companies (Baker Hughes, Schlumberger, and Halliburton) have all declared that we are now past the trough of the drilling bust, and that their customers were showing renewed and growing optimism by mid-year. However, they also qualified this enthusiasm, reporting that improvement was confined to U.S. land, with international and offshore drilling still lagging, and that no rapid, V-shaped recovery was yet underway.
- Our high forecast runs counter to this, and assumes that a V-shaped recovery has actually fallen into place, and rapid and prolonged recovery is already underway. The medium scenario assumes that this same recovery is postponed until mid-2017, when drilling activity begins to return rapidly. The low scenario assumes no reversal in activity, but that a clear path to recovery does not emerge until 2018Q1.
- How high will the rig count go? A recovery to 1900 working rigs seems unlikely, since this prior peak was built on $100 oil. Drilling incentives in this recovery are more likely to be $60-$65 per barrel, but not much higher. We assume the high scenario sees the rig count top out at 1650, the medium at 1500, and the low only returns to 1300 working rigs.
- Even with recovery running at historical rates in terms of adding back rigs, the depth of the downturn makes recovery a long process. It takes about 13 quarters from today for the rig count to return to 1650 rigs in the high scenario, 15 quarters for the later-starting recovery in the medium case, and 17 quarters in the low case.
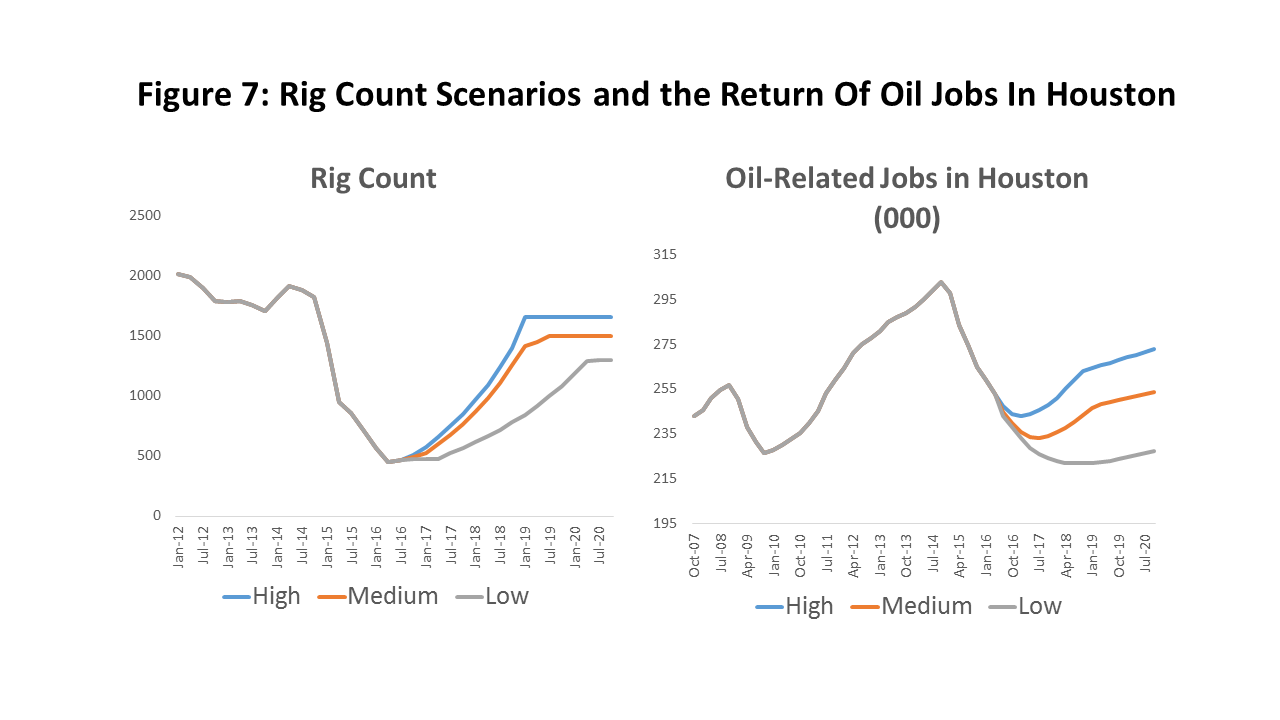
- We statistically related Houston’s oil-related employment to the rig count, with an explicit adjustment for rising labor utilization per rig after 2003. This increased utilization may seem surprising, given much discussion about oil-field automation and falling labor needs in the drilling process, but this is about work at the well head. The modern Houston region sees virtually no oil or gas drilling activity.2 Houston’s work is in planning, financing, and engineering projects around the world, and shipping crews and machinery to the drilling site. The labor requirements per rig in Houston have been increasing slowly but significantly throughout the fracking boom, and are projected to continue into the future. 3
- Figure 7 shows the assumed rig count, and the associated number of oil and oil-related manufacturing workers required in Houston. The return of oil-related jobs lags the rig count, since companies often hoard labor over the cycle, trying to keep valuable staff and crews together through the tough times. This means there is room for early growth in oil-field activity without calling laid-off employees back or hiring new workers. In the high scenario we do not see an upward turn in Houston’s oil-related employment before 2017Q2. In the medium scenario it is late 2017 before workers return, and in the low it is late 2019.
- In Figure 7, after the rig count peaks out in each scenario, note that labor needs continue to rise, but more slowly. This is the post-2003 boost to local labor requirements per rig and due to fracking, which we assumes continues through 2021. Note that total labor requirements never return to levels of the 2014 fracking boom, mainly because of the lower future rig counts.
U.S. Economic Expansion
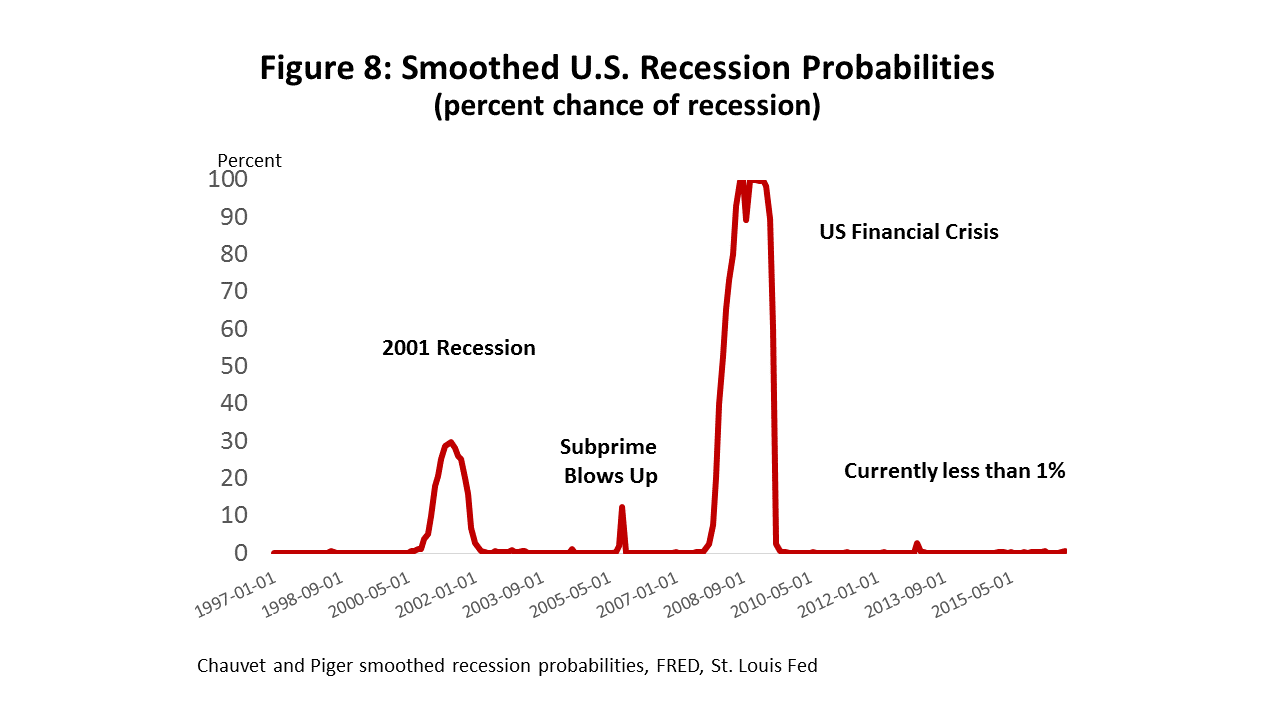
As in other recent economic updates, moderate growth in the U.S. economy is expected to continue through the forecast horizon. Recent U.S. growth has been an important factor in helping Houston to grow and avoid significant recession during the drilling collapse. Typically, a collapse in oil prices and drilling is led by a U.S. or global recession, but Houston has avoided the double blow this time. The only previous time that Houston has avoided recession during a major fall in the rig count was during the 1997-99 Asian Financial Crisis, when the U.S. economy continued to expand rapidly. There are no current signs of national recession on the horizon according to the respected Chauvet-Piger recession probability index shown in Figure 8. The recent election has injected substantial optimism into financial markets and the business community, with growing confidence about further near-term growth.
Concern is frequently expressed about the age of this expansion, which began in June 2009, and is now 90 months old. This is well past the average of 58.4 months for the 11 recessions we have experienced since 1945. Fortunately, recessions don’t die of old age, but of speculative excesses that build up in financial, housing, auto, or other markets.
The current expansion began as a long period of healing from the housing and financial excesses of the early 2000’s, ending badly in the worst recession in 70 years. After a financial crisis, the necessary economic repairs almost always lead to a long subsequent period of very slow economic growth, and this recovery was no exception. Restoring the capital base of financial institutions and normal credit conditions is always the essential repair, but considerable time was also needed to deleverage the consumer, put the housing market back on track, and fix the property and sales tax base of state and local governments. This healing process was probably completed only in the last 24-36 months, and this period makes a better measure of the age of this expansion – marking the point where strong growth and speculative excesses might build again in the economy.
A second concern often heard about current U.S. growth is the wide gap between measures of output like GDP and employment growth. In late 2015, U.S. GDP growth slipped under 1.5 percent and remained there for three quarters, before recording a solid 3.5 percent increase in the third quarter of 2016. At the same time, U.S. job growth accelerated to a pace of well over 200,000 jobs per month. The difference could be explained by weak productivity growth, but the productivity problem would have to be much worse than we have measured. (See Figure 9.)
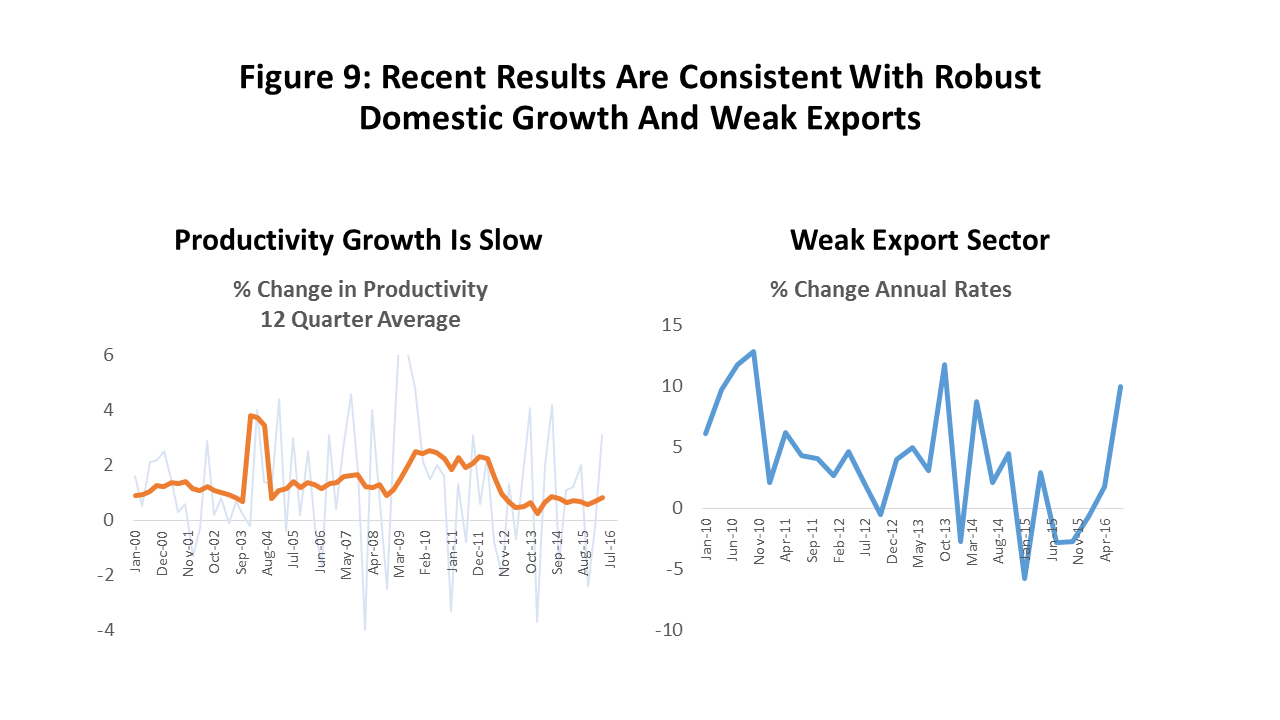
More likely, a stronger dollar slowed the U.S. export sector as it appreciated by more than 20 percent after July 2014. This would hurt international sales, falling particularly hard on manufacturing, implying that the split between production and employment is a divide between a weak export sector and a robust domestic economy. The difference seemed to fade over the last few months, but the dollar has recently strengthened again as the post-election economy turned more robust. It also has put the Federal Reserve on watch to raise interest rates more quickly than previously thought.4 This export/domestic divide may well re-emerge in the months ahead, and should not be seen as a threat to growth, but as a mark of the success of the U.S. economy relative to the rest of the world.
The Petrochemical Boom Ends
Along with U.S. economic strength, a major boom in petrochemical construction provided substantial support to the Houston economy during the recent drilling downturn. Profits in the downstream oil processing industries (refining and petrochemicals) often run counter to upstream drilling, with high oil prices representing an adverse increase in feedstock costs. High feedstock costs force higher product prices, and usually mean lower profit margins. When energy prices fall, however, feedstock costs fall and refining and petrochemical profits are boosted. Integrated oil companies like Shell, BP, or ExxonMobil find better balance in their profits over the oil-price cycle by having significant holdings in both upstream production and downstream processing.
Among major metro areas, and even among large oil centers, Houston is unique in having such large upstream and downstream operations. Comparable to Beaumont/Port Arthur or New Orleans, Houston is a major Gulf Coast refining center. The Houston Ship Channel is the largest and most important point for U.S. petrochemical production. The refiner turns crude oil into oil products like gasoline, kerosene, or jet fuel, while the petrochemical producer makes intermediate products that become plastic and synthetic rubber. Houston’s size and balance between upstream and downstream operations makes its oil-related activity analogous to integrated companies like Shell or ExxonMobil, while drilling and production centers like Midland, Odessa, or Tulsa would better compare to independent producers like Apache or Anadarko.
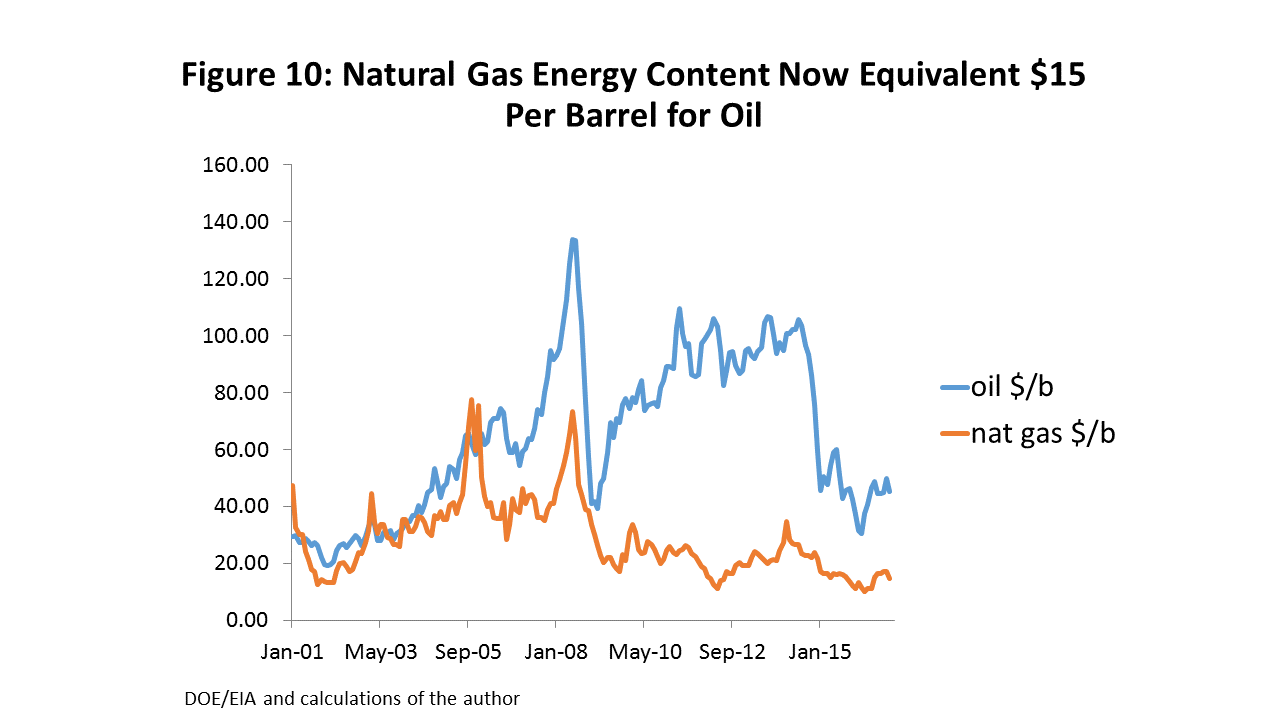
The source of the current construction boom has been described at length in past reports. U.S. natural gas prices collapsed in 2013, and set up a substantial difference between the costs of energy derived from oil versus natural gas. Figure 10 shows both oil and natural gas prices, with gas valued at its energy-content equivalent in terms of dollars per barrel. In late 2014, for example, oil was at $100 per barrel and natural gas was priced at the equivalent of $20 per barrel.
This is important because North American producers use natural gas liquids as the primary feedstock for plastics, while the rest of the world uses oil-based naphtha. The gas liquids (propane, butane, and ethane) are priced much like natural gas, and naphtha is priced like oil. This set up a period of enormous competitive advantages and profits for North American chemical producers, who immediately began to expand capacity. Chemical companies from Europe to South Africa realized that they could no longer compete with the Gulf Coast from their home base, and that their future demanded a North American, natural gas production base. The cost advantage of natural gas liquids has narrowed with the collapse in oil prices, but once oil returns to $65 per barrel, the Gulf Coast competitive advantage again becomes very wide.
The American Chemistry Council estimates that over $170 billion in new U.S. industrial construction has been driven by fracking and low-cost natural gas, most of it occurring on the Texas and Louisiana Gulf Coast, and over $50 billion of this construction was in east Houston and along the Ship Channel. The construction boom has been a temporary but timely addition to Houston’s economy. The breakout of construction data from the Texas Workforce Commission (TWC) and Bureau of Labor Statistics (BLS) provides limited insight into the size of the workforce engaged in these projects. Workers building major industrial facilities are counted as putting up another “building,” and their count is mixed with residential housing or commercial construction. All construction trades are counted separately by occupation, with no indication of what building activity these contractors are engaged in. We do know that a major decline in apartment and office construction jobs in Houston has been partly offset by industrial projects. Despite the downturn in drilling, Houston construction employment did not peak until January 2016 at a seasonally-adjusted peak of 224,600 jobs. Through November 2016, there has been a decline of only 13,100 jobs construction jobs.
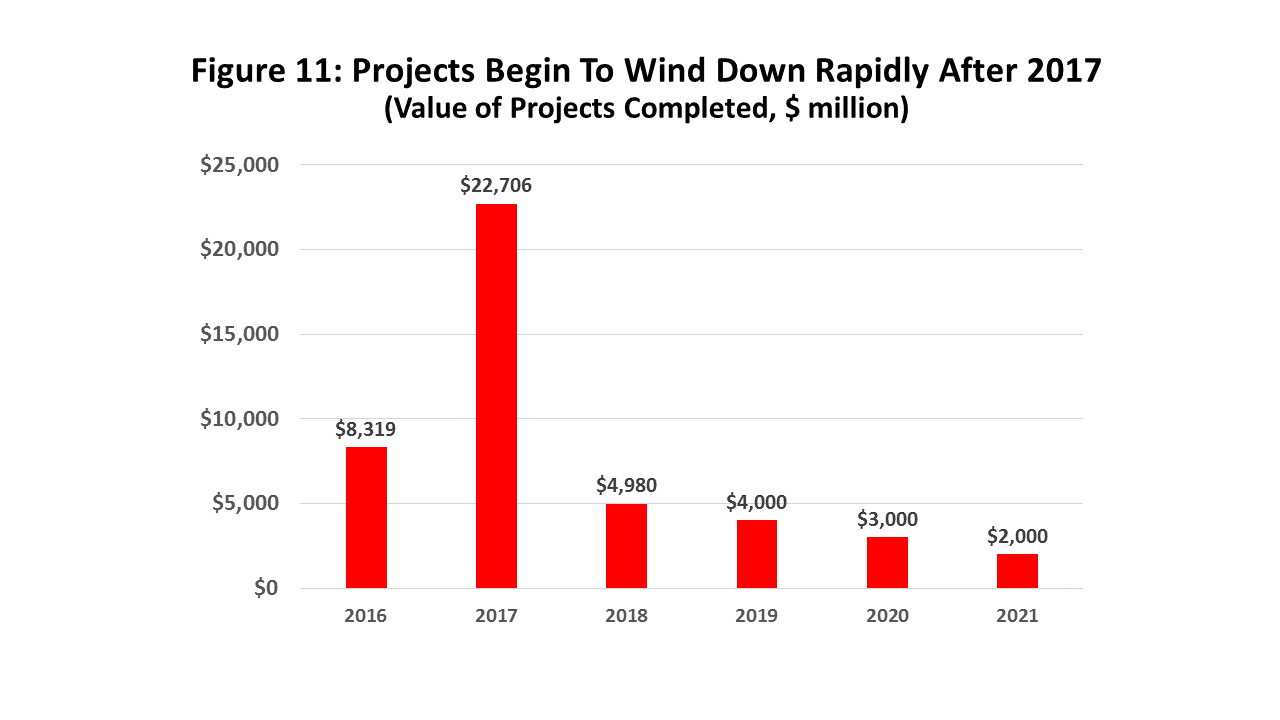
Today’s most important news about this industrial construction is that it is rapidly winding down. Figure 11 shows the value of construction projects ending each year from 2017 through the end of 2021. Private surveys of the number of Houston-based construction workers needed in 2017 indicate that 15,000 to 20,000 may lose their jobs. Again, how do we divide these losses between commercial and industrial/petrochemical construction? It matters because the industrial workers count as a temporary part of the energy base employment in the city, and function as a temporary driver for growth. Local commercial construction is secondary industry, a reaction to past growth.
- What has been a large and positive offset to drilling-related job losses becomes a negative in 2017, as the number of construction workers declines. Using some informed and motivated guesswork, we have added thousands of construction workers to the economic base on the upside of the construction boom, and now remove them as it winds down.
- We assume about 12,500 industrial construction jobs will be lost next year. When added on the upside, this was not as big an economic contribution as it might sound, nor will it be as bad as it seems on the downside. We assume about 10 percent of these jobs are held by local residents who remain in the metro area and find other work. The rest are temporary workers drawn from across the Gulf Coast, living in Houston in their RV or maybe sharing an apartment with four other workers for as long as the job lasts. They send money home, live off fast food, and will move on to the next job in Lake Charles or Corpus Christi when this one ends. The multipliers for these workers are assumed to be only half that of a local resident. They were counted as individually having a limited impact on the forecast as the boom built up, and are counted similarly as the projects wind down.
- There are many other industrial and petrochemical projects under consideration by various companies, and a few are still being announced. These new projects will slow the decline, but there is nothing on the horizon that can remotely offset the coming loss of $50 billion in construction. We assume the job losses continue into 2018, but at less than half the pace of 2017. After 2018, a resumption of residential and commercial construction, plus the rapid return of upstream oil, should reduce petrochemical construction losses to a relatively minor factor in the Houston metro economy.
Houston Area Job Growth
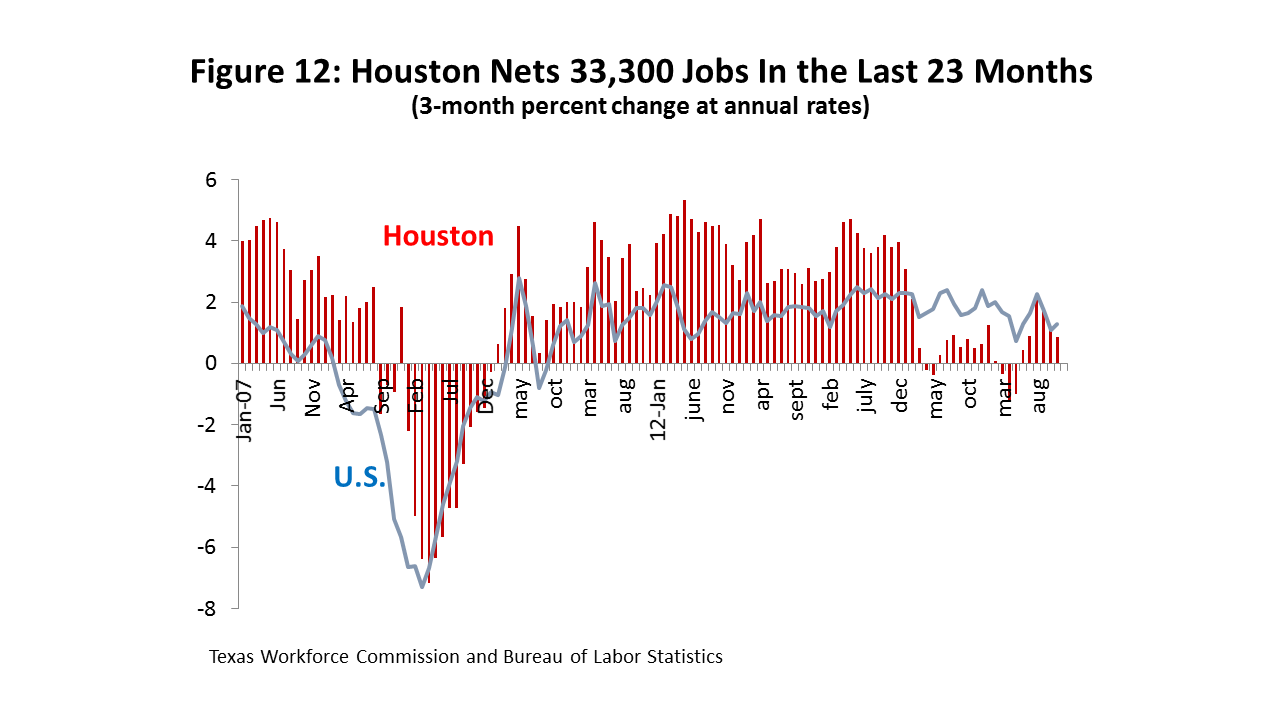
Since December 2014, when the fracking bust began in earnest, official figures for Houston’s payroll job growth show it to be slow but positive. In that time, Houston has added 33,200 jobs, divided into 20,700 jobs in 2015 and 12,500 through November of 2016. Figure 12 compares Houston’s job growth to the U.S., showing that Houston outperformed the U.S. by a wide margin in the years after the Great Recession. However, once the price of oil fell hard in early 2015, their relative positions were quickly reversed, and local job growth ended abruptly. The rule of thumb should be that the difference in economic performance between Houston and the U.S. depends on the price of oil – both for better and for worse.
Houston’s latest economic boom began in 2003-04, and was driven by a combination of new fracking technology and the rising price of oil. Emerging markets in China, India, and Brazil began to grow much more rapidly, and put pressure on the price of a variety of metals, foodstuffs, and agricultural raw materials, as well as oil. From December 2003 to December 2014, Houston added 698,000 jobs, roughly the total number of jobs found in New Orleans or Oklahoma City. In the last three years of the boom from 2012 to 2014, job growth averaged 108,700 jobs per year. This boom-time employment and population growth generated tremendous forward momentum, as the metro area fell behind in schools, hospitals and most basic infrastructure. This momentum played an important role in keeping Houston’s economy moving forward through the early stages of the drilling bust.
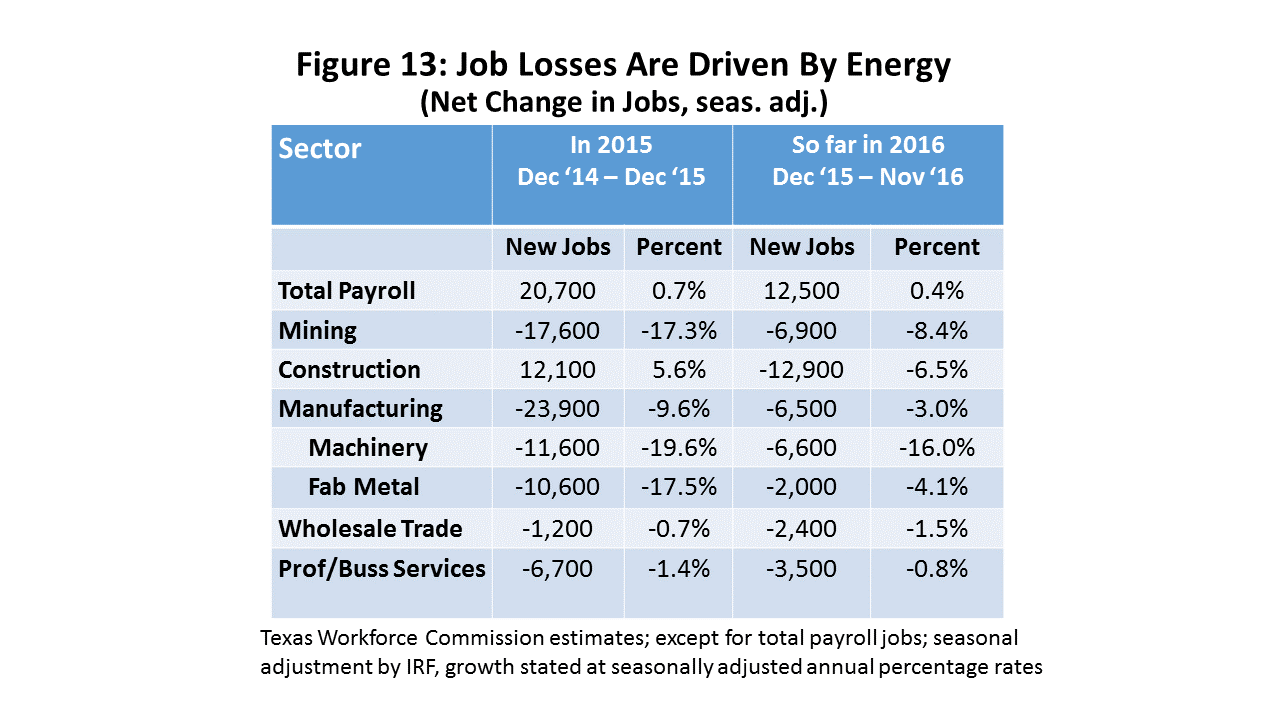
Figure 13 shows that the major source of recent job loss in Houston has been related to oil production, oil services, machinery and fabricated metals, wholesale trade, and some professional services. These oil-related jobs are among the most skilled and highly compensated in Houston. Oil-related job losses reached 47,700 in 2015, and slowed to 25,900 in the first 11 months of 2016. Looking back at Figure 3, it is apparent that this is the largest number of oil jobs lost to any cyclical event since 1990.
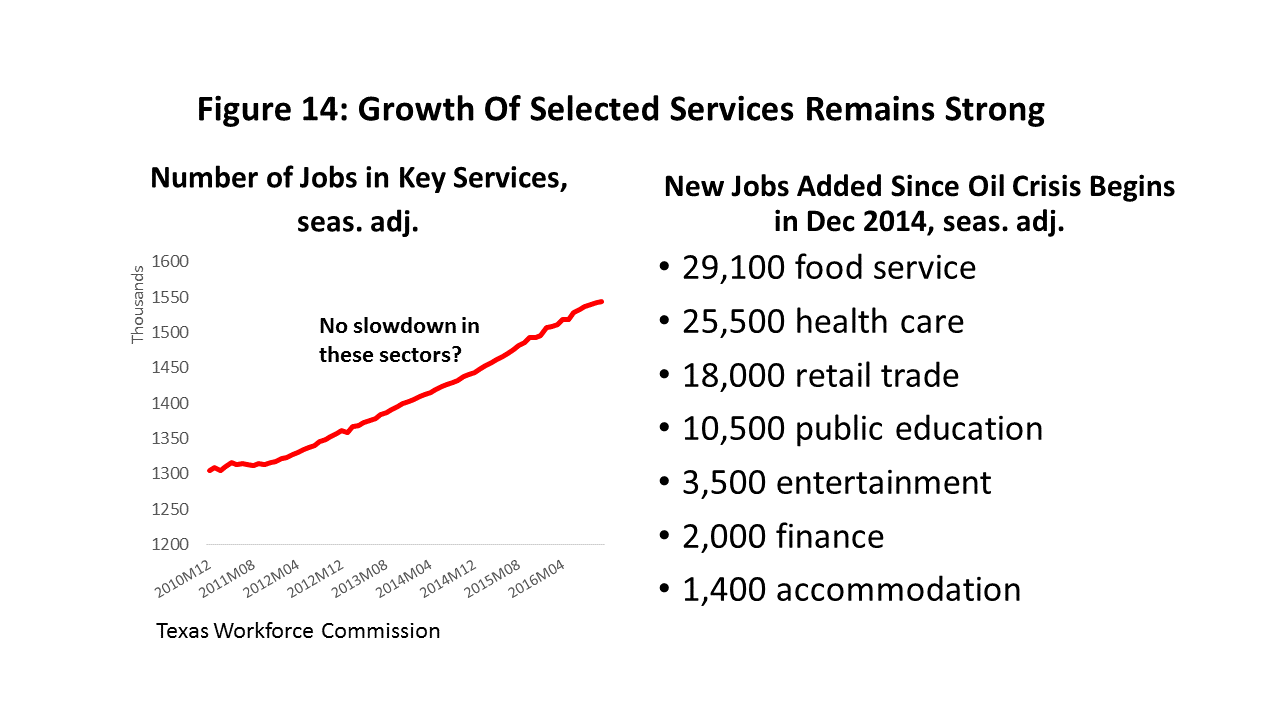
Offsetting oil losses, and keeping Houston’s job growth positive, has been strong growth in service sector jobs. Figure 14 shows that growth in food service, health care, retail trade, and public education have led the metropolitan area’s job growth since late 2014. These are not jobs that you normally think of as driving the economy, but secondary industries that trail growth and provide inherently local services. Past momentum from the boom years is one obvious source of these jobs, along with continued U.S. expansion, and the east Houston construction boom. But 24 months into this slowdown, momentum is running on fumes, the eastside construction boom is over, and drilling jobs have not yet returned. What now drives this growth in bars, restaurants, retail stores, and hospitals?
One possibility for these strong job figures is that they are over-reported. In counting payroll employment, the TWC and BLS are trying to estimate the number of local employees protected by unemployment insurance. Initial monthly employment estimates are drawn from a sample of local employers, and the BLS stops the process in March of each year to publish major benchmark revisions that can sometimes stretch back for 30 months. However, over the course of the 12 months following these revisions, administrative records on unemployment insurance accumulate, and we begin to see possible or likely revisions that will officially wait until next March.5 The Federal Reserve Bank of Dallas, however, uses these records to publish preliminary estimates of the coming March benchmark revisions. Currently, their preliminary revisions are available to supplement or replace the sample data through 2016Q2.6
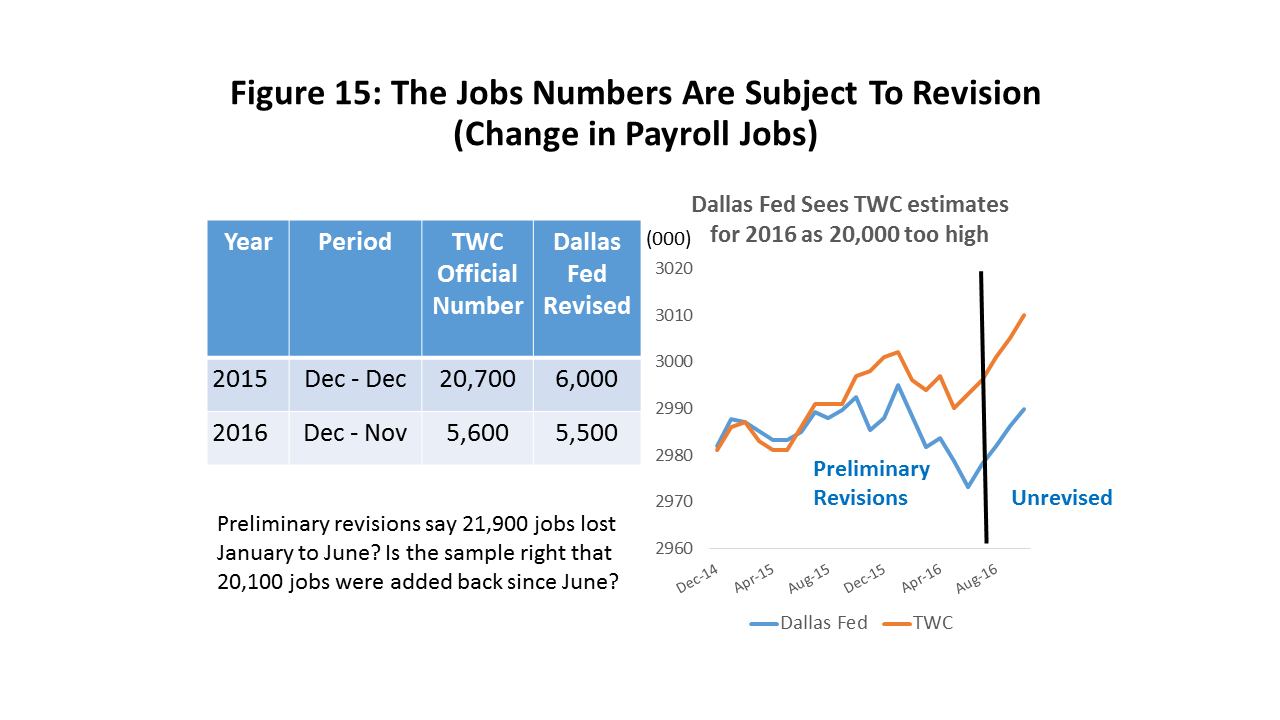
The Dallas Fed revisions are compared to the current TWC estimates in Figure 15. The Dallas figures show a possible markdown of 2015 job growth from 20,700 to 6,000. The 2016 job growth is right on track to match the TWC estimate of 5,600 jobs, but the revised path to that figure over the course of the year is very different from TWC. These revised Dallas Fed figures show that Houston lost 20,000 jobs in late 2015 and early 2016, and it is certainly no coincidence that these were perhaps the two worst quarters in the history of the American oil industry. The current TWC figures show a much smaller decline.
The latest revised data are for May, and both the TWC and Dallas Fed figures reflect the TWC sample for the last 5 months. As the local oil sector stabilized, these data show a quick return to the growth in secondary services that has kept job growth in positive territory for the last two years. The key question is: Can this latest data can be trusted, or are again relying on a poor sample?
If we estimate our model through the second quarter using the revised figures, and ask its opinion about Houston’s job growth in the second half of 2016, it forecasts job growth of 3,000 to 6,000 jobs, depending on the scenario. This is not close to the 21,900 new jobs currently found in the TWC estimate. For our forecast, we have used the preliminary revisions and model estimate of 2016Q3 rather than the official TWC figures. Hence, figures shown later in the report for 2016 job growth are an estimate of the re-benchmark to be published next March. They certainly will not match the January publication of TWC data through December, and its first pre-revision 2016 job growth figure.
Looking Forward
How does all of this add up? To estimate near-term job growth, we used the three drilling scenarios described above. The high scenario assumes a full-blown recovery is already underway in the oil patch, with a definitive and historically-strong increase in the rig count that can be sustained for the next few years. The medium term scenario is similar, except the historically-strong recovery is delayed until mid-2017. The low scenario is deliberately set quite low, and meant to illustrate the impact on Houston of a long, slow, and weak oil industry recovery. Add to this list our assumption that U.S. employment growth remains strong, plus use of the Dallas Fed preliminary revisions to the Houston payroll employment data.
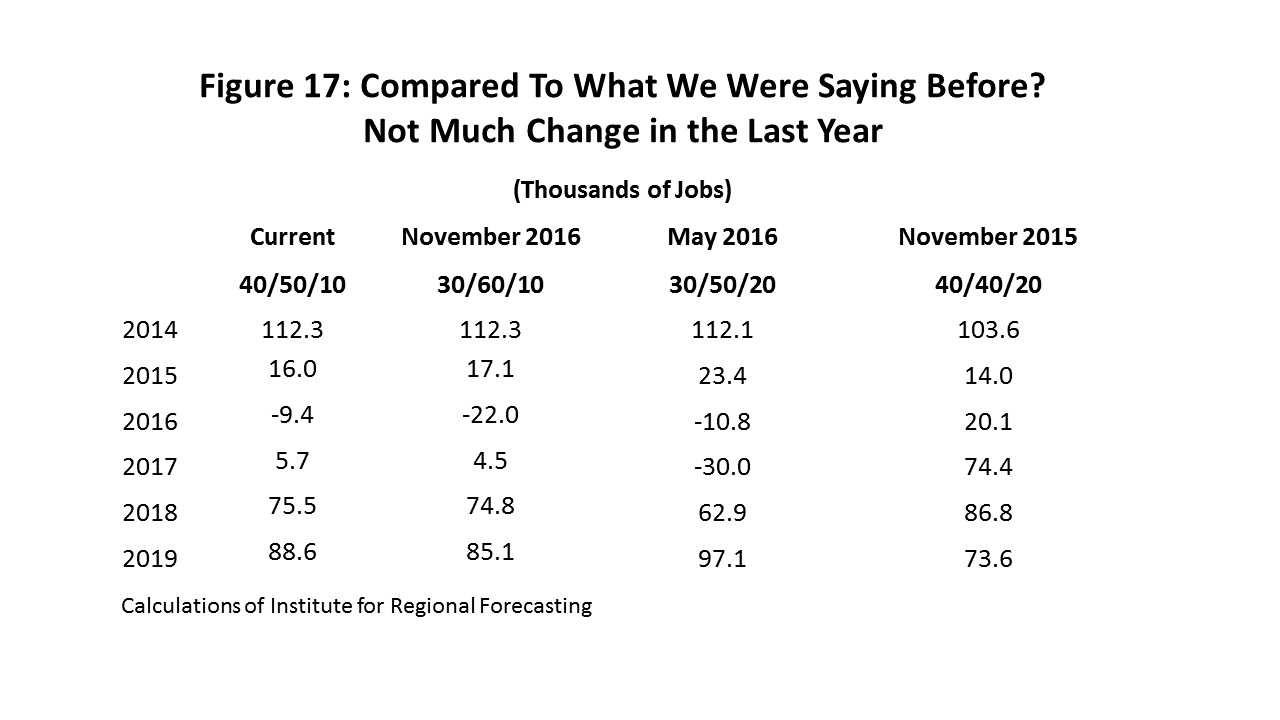
Figure 1 shows the resulting outlook for Houston employment. Our three scenarios are not really forecasts – just estimates of what the Houston economy would do under very specific scenarios and circumstances. To forecast, the last column weights the possibility of each scenario at 40% for the high, 50% for the medium, and 10% for the low. The probabilities reflect my assessment of current events, but can be easily moved around as new events emerge over the next few months. For example, the high becomes more likely if the rig count continues to accelerate, or the medium more likely if OPEC cheating emerges in coming weeks.
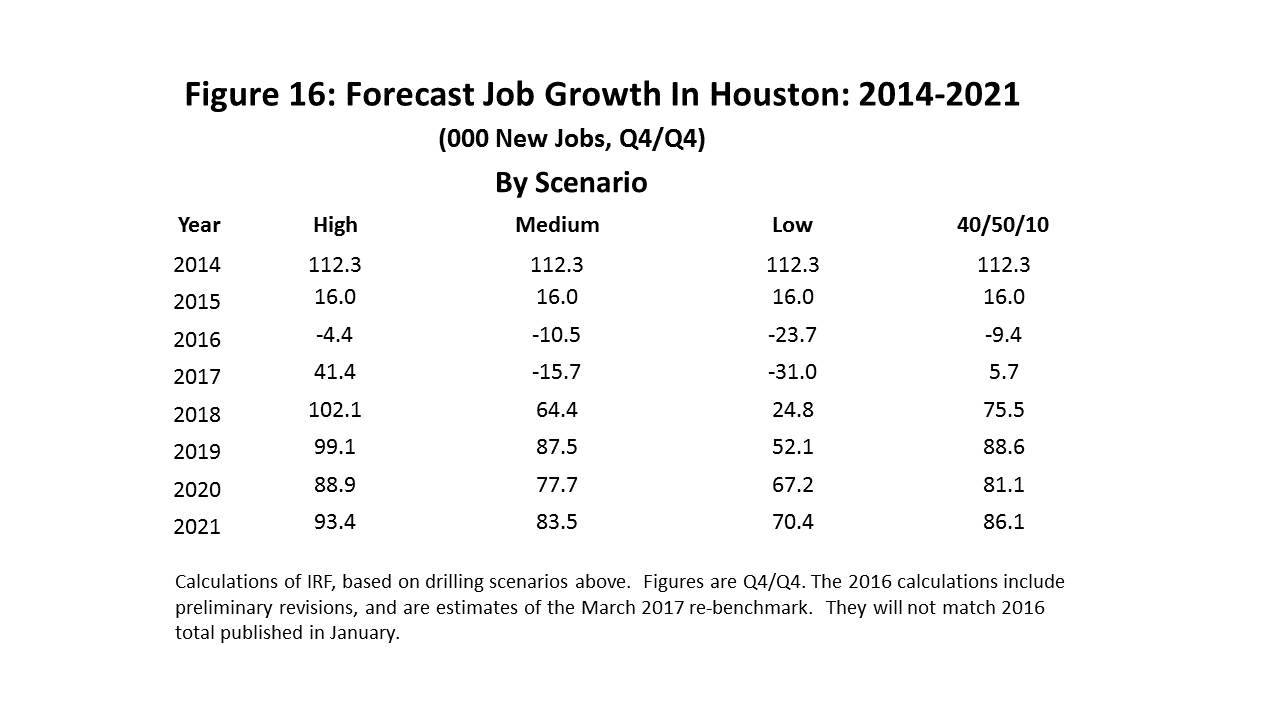
Using the 40/50/10 weighted average, 2017 is another weak year with only 5,700 jobs. The early return of drilling jobs in the high scenario brings positive job growth, but any delay in the rapid return of upstream activity -- and the return of drilling jobs to Houston -- results in job growth being overwhelmed by the loss of Ship Channel construction jobs. By 2018, however, both the high and medium scenarios have local economic recovery falling solidly in place. The strong out-year growth in the high and medium scenarios reflects growing confidence the recovery of exploration and production could fall into place sooner rather than later.
A possible measure of the risk in the scenarios is the difference between high and low job growth, and both 2017 and 2018 are quite risky based on this measure. For 2017, the difference between high and low is a possible swing of 72,400 jobs, and for 2018 it is 77,300 jobs. This early-year risk is mostly due to uncertainty about whether the oil market recovery is definitively underway or not. Despite many positive signs, we have seen a similar start fall apart in the summer of 2015. By 2020, in comparison, the difference between high and low is only 21,700 jobs.
The low scenario carries little weight in our calculations, but illustrates what happens to the broader Houston economy if the drilling recovery is far slower and much lower that most reasonable observers think. The oil-related job loss and economic damage from the drilling downturn is mostly behind us, but the slow return of oil jobs in this scenario translates into historically slow payroll job growth. Houston’s payroll employment over the past 25 years has grown about 2 percent annually, or 60,000 jobs per year measured on the current base of 3 million jobs. The low scenario shows that positive job growth begins in 2018, but does not move above the historical average until 2020. It should however allay fears that Houston is on the brink of a 1980’s-style bust.
Figure 17 compares the employment forecast over the past two years to what we are saying today. The biggest difference is between the outlook in November of 2015 and everything that comes after. I failed to see the U.S. oil industry falling into complete capitulation in early 2016, and into perhaps the worst 6-month period in the history of American oil. Since that time, the improved outlook for 2017 has been built on a slowly-growing consensus that the global oil market is moving back into equilibrium for supply and demand, and that price can be soon restored to the $65 range. The changes back and forth in the 2016 figures are based on the Dallas Fed preliminary revisions, as well as subsequent revisions to those revisions.
Maybe the most striking thing about Houston’s recent job growth -- and the forecast presented here -- is the difference between the performance of the oil market and Houston’s economy. This is arguably the worst downturn ever for U.S. oil – but certainly not a serious downturn for Houston. If revised data should somehow show the loss of enough jobs in late 2015 and early 2016 to count as a recession, it will in all likelihood be the mildest local downturn since the 1970s.
Did industrial diversification shelter Houston from much worse economic damage in this downturn? The model we use to estimate job growth says no, that there has been no structural change in Houston since 1996. That is, any given change in oil jobs or the U.S. economy will provide the same impetus to the local economy today as it did in the mid-1990s. Sometimes the oil industry does particularly well when the U.S. economy is struggling, like during the weak U.S. recovery from 2010-2014, making it appear that Houston’s economy is dominated by the oil market. Other times, like the late 1990’s, the oil industry struggles mightily while the U.S. economy performs very well. On the surface, this looks like rapid diversification. But in each case, the channels of influence into Houston’s economy for oil and the national economy were unchanged, it was just the relative performance of these outside factors that made the Houston’s growth patterns look very different.
What did help Houston this time? It was mostly the luck of the draw. First, the oil price collapse was a supply-side event that was not driven by a U.S. or global recession. The U.S. economy is important to Houston’s growth, just not more important than 1996, and it continued to work well for us. As recently as 2009, we got an important lesson in what can happen when both oil and the U.S. economy fail us badly, with the quick loss of 100,000 jobs. Second, the timing of the petrochemical construction boom was almost perfect, providing tremendous and unprecedented momentum from downstream processing at the moment it was most needed. The balance between upstream and downstream in Houston’s oil sector worked just as it should over this price cycle.
There has been considerable surprise from the public at large at Houston’s economic performance, especially by those who don’t live or work here, and who expected a tremendous crash like the 1980’s. That crash was never in the cards this time around, even if modest luck had not been on our side. There were serious speculative excesses in oil this time around, and some overbuilding in Houston’s residential and commercial real estate. But careful comparisons of the 1980’s to today make it clear that THIS oil bust never had the opportunity to spill into Houston’s real estate and banking sectors the way it did in the ‘80s. It marks the fourth major drilling downturn to affect Houston since the 1980’s, and we are still waiting to see if it will be the third oil-driven recession or not.
Written by:
Robert W. Gilmer, Ph.D.
Institute for Regional Forecasting
January 2, 2017
1 See Halliburton’s recent 2016 earnings reports, for example.
2 Houston’s upstream oil activity is legacy of the 1900 Spindletop well in Beaumont, the first salt dome discovery and the first oil gusher. The trail of salt domes ultimately led from Beaumont to the Houston metro area in Humble, Texas. The Texas Company was formed at Spindletop and moves to Houston, and the Humble Oil Company later becomes Exxon. Houston became the major source of labor for the new industry, and as the area’s primary telegraph and railroad center, it made the logical headquarters location. Oil exploration has moved on, but the labor pool and headquarters remain in Houston.
3 The number of rigs in the recovery should be considered today’s “rig-equivalents.” Despite the warning above that many of the widely-touted productivity gains in fracking have been from cyclical pressures, there is no question that the modern drilling rig has become more technologically advanced and more productive. Baker Hughes has recognized this by shifting its weekly count of the number of working rigs to a count of the number of wells they drill. The second quarter earnings report from Halliburton has a forward-looking discussion of how 900 rigs will become the new 2000, with a much smaller number of rigs consuming all the horsepower in the market. We don’t know how many rigs will actually be drilling at various stage of the recovery, but the figures used here are today’s equivalent in terms of the number of wells drilled or horsepower consumed.
4 A third possibility is mismeasurement when GDP is the output measure. Gross Product is always difficult and elusive concept to measure, particularly among the rapidly growing service industries. However, the Bureau of Economic Analysis recently released a statement on problems with the way they have managed the incorporation of time series data provided by other agencies. They may have introduced unknown biases into all recent GDP estimates, the extent of the problem is unknown, and the problem can’t be fixed before mid-2017. See Brent R. Moulton and Benjamin D. Cowan, “Residual Seasonality in GDP and GDI: Findings and Next Steps” https://www.bea.gov/scb/pdf/2016/07%20July/0716_residual_seasonality_in_gdp_and_gdi.pdf
5 The data is from the Quarterly Census of Employment and Wages, https://www.bls.gov/cew/
6 Federal Reserve Bank of Dallas, https://www.dallasfed.org/research/econdata/tx-emp.aspx#tab2