Houston Updates
-
Archive
- June 2025
- March 2025
- December 10, 2024
- September 14, 2024
- May 21, 2024
- March 19, 2024
- December 9, 2023
- June 16, 2023
- April 6, 2023
- March 17, 2023
- Dec. 19, 2022
- Sept. 14, 2022
- July 4, 2022
- March 27, 2022
- March 9, 2022
- September 2021
- April 2021
- March 2021
- September 2020
- August 2020
- June 2020
- April 2020
- March 2020
- January 2020
- December 2018
- June 2018
- March 2018
- February 2018
- January 2018
- September 2017
- September 2017 Post-Hurricane
- June 2017
- March 2017
- January 2017
- September 2016
- March 2016
- December 2015
- September 2015
- June 2015
- March 2015
- December 2014
- June 2014
- March 2014
- November 2013
- September 2013
Slower Growth Ahead as the Fed Lowers the Hammer: Houston Economic Update 2022-2028
September 14, 2022
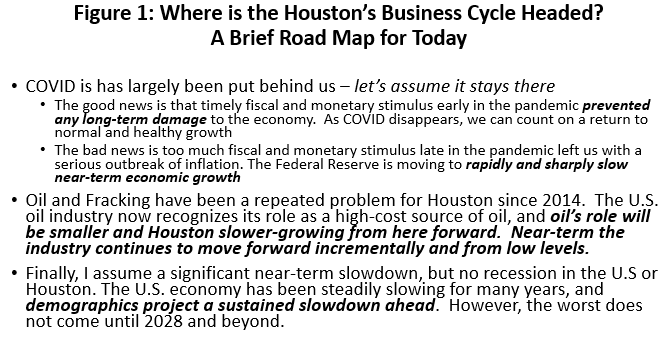
This report is an update of our outlook for Houston’s economy through 2028. See Figure 1. The biggest change in the outlook is the result of continued high inflation in the U.S. and the Federal Reserve’s aggressive response. We follow the lead of the Survey of Professional Forecasters in expecting a significant slowdown in the U.S. in 2023 but no recession. Houston’s growth in 2023-24 falls below trend but does not bring an economic reversal.
Despite the recent decline in oil prices to the mid-$80 range, the local oil outlook is more positive than last July. This is only because producers – still operating at relatively low levels -- have become more comfortable with moderate increases in oil-field activity and production. As OPEC finds itself short of capacity, prices remain well above oil’s $65 long-run marginal cost of production, and producer finances remain solid, there is increased willingness to move forward incrementally. Investor pressure keeps any response to prices higher than $65 well off the table.
Because Houston’s future oil industry is now smaller, we continue to expect slower and more stable long-term growth in the Houston metro area. Local growth in payroll employment will average 1.6-1.7 percent per year through 2028. This is below the 2.1 percent Houston enjoyed for 1990-2019, but still significantly better than the 1.1 percent in the U.S. economy over the same period. After softness in 2023-24, the local economy should move onto this longer-term path. Later in the decade, however, this path will narrow further for both U.S. and Houston as weak population growth is followed by slower labor force growth.
The Houston Economy in the Pandemic
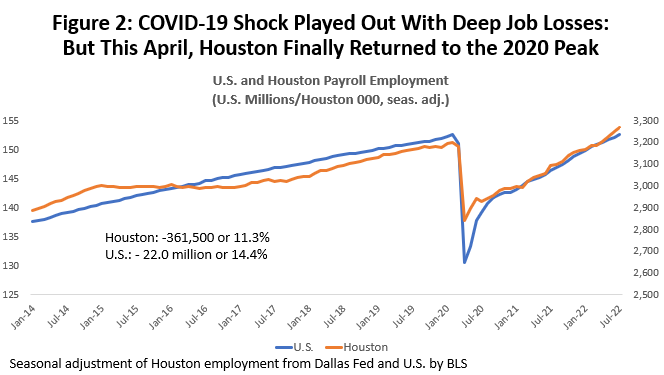
Houston’s COVID recovery brings very good news, although still accompanied by significant on-going and some new economic concerns. Certainly, the good news is that in April of this year the Houston metro area added back all of the jobs lost to COVID since the April 2020 lockdowns, and U.S. payrolls reached the same milestone in July. The recovery in both cases gained momentum in spring 2021 as vaccines became widely available, as many COVID restrictions were dropped, and with extra spending induced by the second and third round of fiscal stimulus.
COVID has become much less pressing, but some local economic hangover lingers. Although Texas has led the nation in job gains, until very recently Houston’s recovery was a serious laggard among the state’s major metro areas, especially compared to Austin or Dallas where most of the state’s widely-noted population gains and corporate relocations to Texas have occurred.
Houston’s payroll employment losses and recoveries are shown in Figure 2, with a lockdown decline of 361,500 jobs or 11.3 percent. This compares to 22.0 million U.S. jobs lost or 14.4 percent. Houston’s decline was smaller thanks to a less restrictive lockdown policy in Texas, and the stronger initial U.S. recovery was a strong bounce back as heavier national COVID sanctions were lifted. By this April, re-benchmarked and revised employment data showed that Houston had added back all of the lockdown losses, and now stands at 118.8%, i.e., all of the jobs are back plus 18.8%. The U.S. in July finally added back 100.0% of these losses.
The differing stringency of lockdown periods complicates comparisons of the U.S. and Houston recovery, as the U.S. brought jobs back at a faster rate but from a lower level. Comparison to other Texas metros is much clearer in the sense that we had the same public health and lockdown rules imposed across the state. Figure 3 shows COVID lockdown period losses and recoveries through this July for major Texas metro areas. Austin has recovered 178.2% of losses or all the losses plus 78.2% more. Dallas stands at 177.6% of jobs returned, Fort Worth at 119.1%, and San Antonio at 118.3%. The statewide recoveries are at 137.7%.
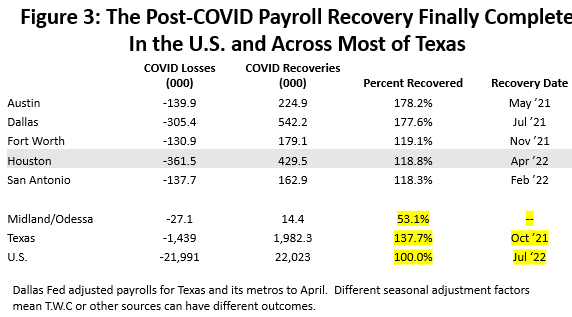
Note that Midland/Odessa have added back only 14,400 jobs since the lockdown or 53.1% percent. This is the heart of the state’s oil production region, and these cities -- like Houston – are highly dependent on oil-related jobs. This strongly infers that Houston’s relatively slow recovery was centered in its large oil sector.
How does the vaccine play into the broader economy? The immediate, huge job losses to lockdowns was led by jobs in sectors sensitive to close contact, social distancing, or heavily affected by COVID public health regulation. Nine local sectors are listed in Figure 4 that are sensitive to such contact (bars and restaurants, health care, retail sales, accommodation, etc.), and which together made up 41.9 percent of all Houston employment in 2019. They are important because they also collectively accounted for 65.5% of the lockdown-period job losses.
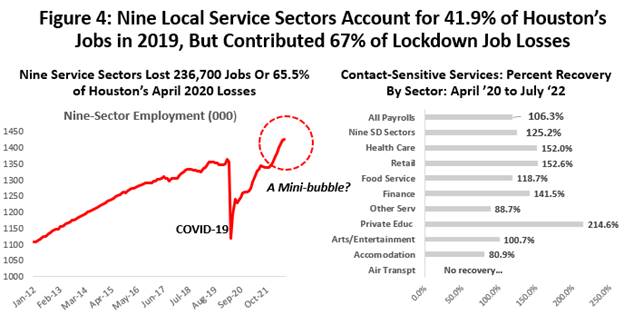
The key point about the vaccines is that they led a strong surge in contact-sensitive jobs, This surge was led by the arrival of the vaccines in spring of 2022, and then greatly bolstered by two large stimulus packages that totaled $2.5 trillion. As the city became more comfortable with public settings, and had the wherewithal to spend, these jobs sprinted forward. By July of this year, all of the lockdown losses in these nine COVID-sensitive sectors were restored plus another 25.2%. Compare this to 118.8 percent of total Houston payrolls, although these service jobs led the recovery by a far greater margin until just the last few months.
Sector-by sector gains came as COVID damages tied immediately to the virus and many public health regulations were reversed by vaccines. The largest three sectors – health care, retail, and food service – have high recovery rates at 152.0, 152.6, and 118.7 percent.
We will count several mini-bubbles as we move through this report – others in spending and housing, for example – and several of these contact-sensitive sectors appear to have surged to levels out of line with total employment gains and seem unlikely to be sustained in the short-run as the economy cools. Our forecast anticipates a turnaround in some of these jobs in 2022 with the loss of perhaps 10,000 by the end of this year.
The End of COVID Stimulus
Fiscal stimulus was an enormous injection of cash into the economy that is rapidly coming to an end, and it now must be replaced by local economic growth. The stimulus came in two waves of about $2.5 trillion dollars each, first in early 2020 during the lockdown period, then followed by two more rounds in late 2020 and early 2021 that totaled the second $2.5 trillion. Two and a half trillion dollars was about $16,800 per U.S. household in 2020, and each round saw about half of this cash flow to individuals directly or indirectly -- but quickly and as needed. The money went into the bank accounts of individuals and businesses mostly through economic impact payments, the paycheck protection program, and enhanced unemployment checks.
In Figure 5, the blue line shows the pandemic-period track of total personal income (including stimulus) and the red line is the wages, salaries, and income of the self-employed (no stimulus). Each point compares these measures to pre-pandemic levels in February 2020. The initial round of stimulus came against a backdrop of consumer shock and lockdowns, and a ten percent drop in early wages and salaries that was immediately matched by ten percent jump in personal income via stimulus. These cash payments appeared to quickly right the economic ship by mid-year by offsetting wage losses and delivering record levels of income. Pre-pandemic levels of wages and salaries were fully restored by November 2020.
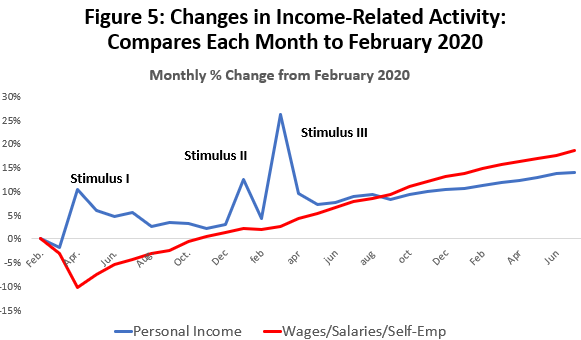
The lockdown month of March 2020 was the only month that U.S. personal income fell below pre-pandemic levels, telling us that consumers have had the wherewithal to spend if they chose to do so. In fact, Americans collectively were never before been so well off financially as during the pandemic.
Figure 5 also shows us an economy is now expanding on its own. The red line for wages and salaries has been growing rapidly since late 2020 and now stands 18.6 percent above pre-COVID levels. The blue personal income line has been steadily slowing as the stimulus recedes, although it is still being carried nicely by wages and salary growth and remains 14.0 percent above pre-COVID levels.
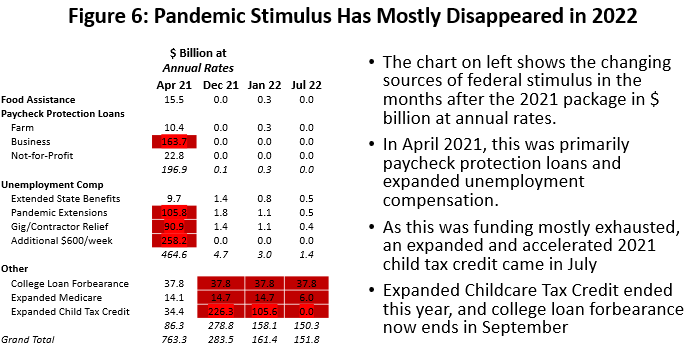
Figure 6 shows how the stimulus has slowly disappeared over the last year. The first column for April 2021 is just after the final round of stimulus, and it shows that the paycheck protection program and enhanced unemployment compensation programs dominated spending, running at monthly $763 billion measured at annual rates. Almost all of these programs ended last fall, and by January fiscal spending was only $161.4 billion at annual rates, mostly via expanded Medicare, college loan forbearance, and a new enhanced child tax credit that came in July 2021. The expanded childcare tax credit has ended and college loan forbearance now ends in September.
How will the Houston and U.S. and Economy Replace the Stimulus?
The stimulus payments had a big impact on spending in Houston and the U.S. Figure 7 shows the obvious timing of a jump in U.S. retail sales following each round of fiscal help; first, there is returning retail activity to pre-pandemic levels by June 2020, followed by an added sharp pick up in spending that comes in March 2021, pushing it well above pre-pandemic levels, and which has stayed at high levels through this year
However, inflation is taking a substantial toll. Consumer prices including food and energy rose 6.2 percent measured fourth quarter to fourth quarter of 2020 and at a 10.0 percent annual rate in the first two quarters of 2022. The bite that inflation has taken from spending is the difference between the blue and red lines of Figure 7.
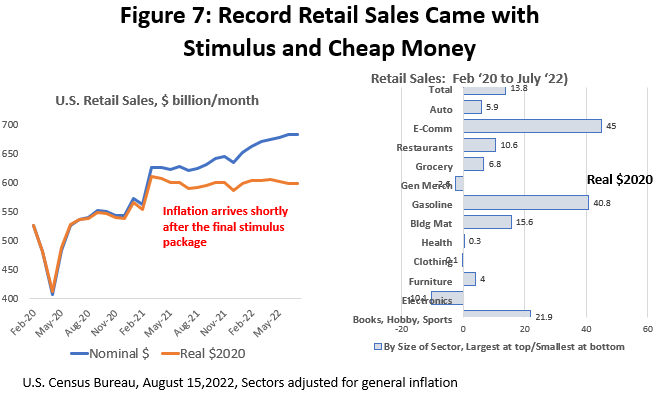
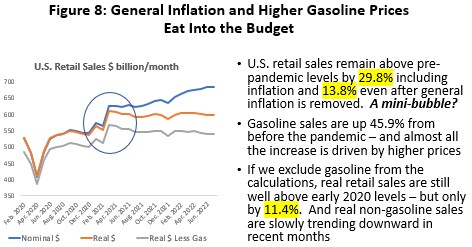
Figure 8 sharpens the focus on inflation. Retail sales are now 29.8% above pre-COVID levels, and even with inflation subtracted out consumer spending remains 13.8 percent above pre-COVID levels, and it still 8.2% above February 2021 and before the last stimulus checks were sent out.
One argument might be spending is still high because gasoline prices are up, that gasoline is an essential item in many budgets with no easy way to substitute for it. Gasoline sales are up 45.9 percent from before the pandemic, and almost all is price increases. But if we take gasoline out of the calculations, consumers are still keeping spending on other goods 11.4 percent above pre-COVIS levels. This looks suspiciously like a retail spending mini-bubble driven by the 2021 stimulus.
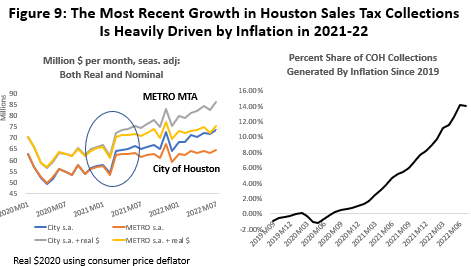
There is no reason why Houston has not been a full participant in the stimulus payments and in any resulting local mini-bubbles. High levels of sales local tax revenues continue in the most recent collections by both the City of Houston and METRO MTA. Figure 9 shows the COVID history of sales tax collections based on both in current and inflation-adjusted dollars. Before COVID, City of Houston revenues in 2019 had been trending upward at near $60 million per month, only to fall back to $49.5 million in the April lockdown. Allocations stabilized and improved with the first stimulus, but significant levels of strong recovery do not come until March 2021, following the lead of the U.S. economy, vaccines, and further stimulus.
After March 2021, inflation-adjusted allocations earned by the City jumped by $5.0 million per month or 5.0 percent above 2019 pre-COVID levels, and – inflation adjusted -- they remain at or near those highs through the most recent data. This is despite the fact that Houston’s economy continued to struggle until this April to simply return to 2020 pre-COVID levels of employment. This high level of local spending holds for METRO also.
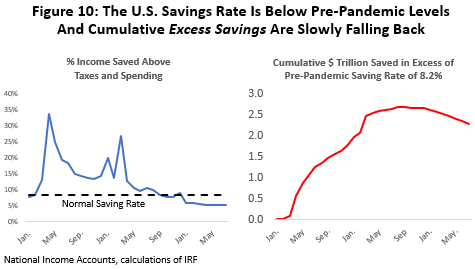
How do allocations stay high with the stimulus now largely depleted? The key for the consumer is that the pandemic stimulus was not all spent and much was saved. “Savings” as defined by the National Income and Product Accounts is simply the difference between after-tax personal income and outlays on goods and services. If 8.2 percent of after-tax income is a comfortable past level of saving, Figure 10 shows that savings rates were far higher throughout the pandemic. The saving rate finally slipped below 8.2 percent only early this year and has fallen to about 5.0 percent in the most recent data.
The right side of Figure 10 shows that these savings are a huge amount of money, with “excess” savings above the 8.2% mark reaching $2.7 trillion in September of last year, and still around $2.3 trillion in July.
You must be careful with the definition of savings, however. It includes anything that is not spent on goods and services included in “outlays.” New homes, existing homes, upgrades of existing homes would be in savings, along with any financial investment like stocks and bonds. Liquid investments like in checking, savings, or money market accounts were substantial, however, and the amount is important because they are the dry powder that can still drive spending forward. It is unclear exactly how dry power is available, i.e., how easily illiquid investments be converted to cash? And how does this question change by income level?
Economists have been expecting a decline in real consumer spending for some time, and so far, they have been disappointed. High levels of spending will continue as long as the consumer is willing and able to dip into liquid savings. There are signs of the low income consumer beginning to struggle, with credit-card use rising, for example, although bills are being paid on time. But high inflation, rising interest rates, and a slower job market will accelerate arrival of spending cuts. And it is not a matter of “if” spending pulls back … just a question of when it happens.
Other areas have been subject to similar COVID-driven minibubbles. The sales of local trucks and autos for example have remained relatively subdued, mostly due to shortages of chips and other supply chain issues that left dealer lots empty. But we have seen sharply rising car prices in place of the number of sales, with prices quickly moving up 25% and reaching over $50,000 for the typical Houston truck or auto.
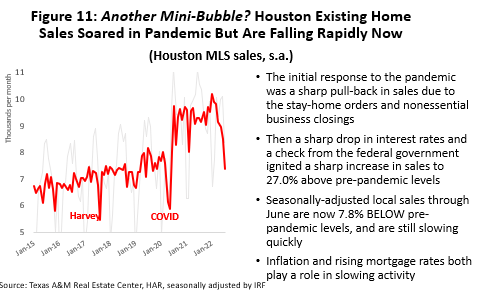
Also, Houston’s existing home sales and prices soared with successive rounds of stimulus. This mini-bubble began early in the pandemic and was helped by low interest rates as well as fiscal spending. Existing home sales spiked as much as 27.0% above pre-pandemic levels, prices rose 35.6%, and inventories fell to a 1.2 month supply. Figure 11 shows that seasonally-adjusted sales have been in full retreat since early this year. Prices have leveled out, and inventories are slowly rising. Higher mortgage rates have been the primary lever in this reversal.
Inflation Changes the Outlook
Inflation is often described as too much money chasing too few goods. The current outbreak of inflation is significant and almost certainly results from both too few goods (a still-incomplete COVID recovery and continued supply chain disruptions as exemplified by on-going Chinese lockdowns) and too much money (the large 2021 fiscal packages that arrived after such support was seriously needed). The Federal Reserve also gets its share of blame for reacting too slowly to the inflation threat and arriving too late with aggressive policy measures.
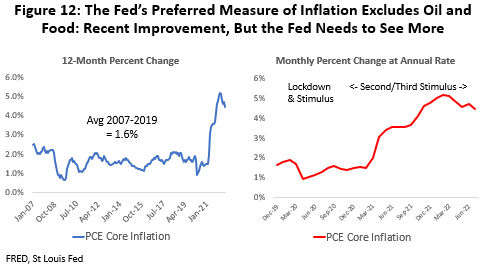
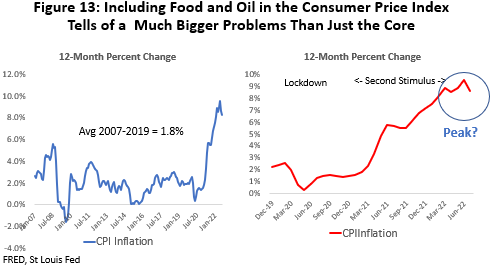
The Federal Reserve’s preferred measure of inflation is the Personal Consumption Expenditure (PCE) deflator excluding oil and food prices. Food, oil, and other energy products are excluded from the remaining core of goods because they are volatile and often dependent on noneconomic factors like war, embargoes, or crop failure. The Federal Reserve has no control over oil markets, weather or harvests, and for policy purposes it reacts only to the narrower group of goods that it can control.
By this measure, Figure 12 shows that 12-month inflation peaked at 5.2 percent last February and has since trended down to 4.5 percent. The Fed has acknowledged this only as a good beginning for policy and also has strongly and recently reiterated its 2 percent policy goal.
Once food and oil enter the equation, the consumer’s picture of inflation becomes much more pessimistic. Note that inflation began to pick up strongly in March 2021 and the Ukraine/Russia conflict begin in early 2022. Ukraine simply made an already-serious problem much worse. See Figure 13. Embargoes of Russian oil briefly pushed oil’s price as high as $125 per barrel and it remains near $90 today, and Ukraine – the Breadbasket of Europe – cannot plant or move many of its crops to market. Summer droughts in the U.S. and Europe added another layer of gloom. If we shift the previous chart to the more familiar Consumer Price Index (CPI), and include energy and food, then 12-month inflation peaked at 8.6 percent in June and recently fell back in July to 8.1 percent. It is the first small sign of progress in bringing headline inflation down.
Where is inflation Headed?
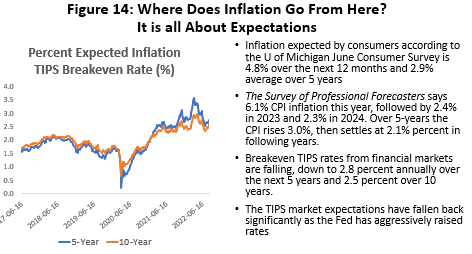
Where does inflation go from here? See Figure 13. The Fed has a critical interest in where the public believes inflation is headed and their expectations for price change. They want business and consumer expectations to be well-anchored at or near their two percent policy goal. If expectations move higher, demands for wage increases become embedded and can kick-off a wage-price spiral. Figure 14 contains several measures of expectations that -- so far – indicate that in coming months the Fed can and will bring core inflation back to two percent annual rates.
Consumer expectations as measured by the University of Michigan’s widely-followed survey says prices will rise 4.8 percent over the next twelve months and 2.9 percent annually over five years. Consumer expectations for inflation have a long history of being gloomy, but recent cuts to their outlook have favored inflation falling under control.
Alternatively, if we look at the Survey of Professional Forecasters outlook assembled by the Philadelphia Fed we see 6.1 percent inflation for this year, followed by a relatively optimistic 2.4 percent in 2023 and 2.3 percent in 2024. The longer-run projections fall to 2.1 percent.
Over the coming five years the CPI estimated by financial markets – based on the breakeven inflation rate implied by Treasury Inflation-Protected Securities (TIPS) – indicate 2.8 percent inflation annually over five years and 2.5 percent over 10 years. These expectations also have fallen back steadily in recent weeks as the Fed has become more aggressive in raising rates.
Certainly, the continued fall over time in expectations in all surveys sets a positive tone. All since the inflation estimates listed in Figure 14 include food and energy, and the core measures of inflation would look more positive.
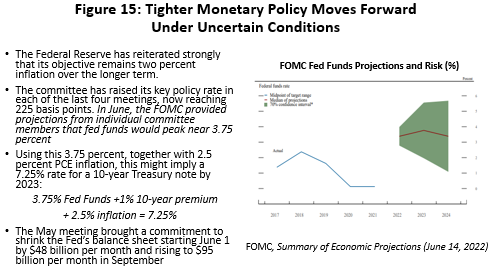
They Fed’s policy committee has now raised the target fed funds rate four times this year with increases of 25, 50, 75 and 75 basis points, and fed funds now stand at 2.25 percent. They are almost certain to raise rates another 50 to 75 basis points this month. The latest June projections from the Fed policy committee show fed funds peaking near 3.75 percent by next year. See Figure 15. One rule of thumb for the future rate of return on the 10-year note – based on the 3.75 percent fed funds rate, a 1.0 percent real premium for the 10-year note, and 2.5 percent inflation capitalized into the note -- would imply a 10-year Treasury note yielding 7.25 percent by next year. The 10-year is widely used as a key rate for mortgage determination and many other important financial decisions.
The current 10-year note is near 3.3 percent and the coming rate increases will slow consumer spending and home purchases as credit card and mortgage rates rise; they mean less investment by business, slower general construction, and falling capital spending for machinery and equipment. Higher interest rates typically hurt the stock market and bring capital losses for equities, and they reduce the value of existing fixed rate securities.
Policy is moving quickly as the Fed tries to make up for falling behind in its efforts to slow inflation, and a modest recession in 2023 has become a widely-discussed possibility. No recession is built into the forecast, however, as we follow the lead of the Survey of Professional Forecasters who see job growth of about 100,000 jobs per month over the next four quarters. Meanwhile, these forecasters say real GDP averages 1.8 percent. This is a substantial contrast to economic expectations from just a few months ago, which were for the end of the COVID pandemic to bring a smooth transition back to normal growth.
What $100 Oil Means for Houston’s Economy in 2022
The Russian invasion of Ukraine that began in late February continues as a hot war, and it has brought extraordinary market disruptions to oil, natural gas, wheat and many other global commodities. When oil and natural gas prices have soared in the past, they have typically brought long and enduring U.S. oil booms with rising rig counts and growing production. So far, the American oil industry has been reluctant to chase higher oil prices at all, much less buy into a sustained multi-year commitment to oil prices at $100. Indeed, it is unlikely that $100 oil will ever again mean what it once did to the American fracking industry -- or to Houston’s economy.
We start with a high-level perspective on the current state of the U.S. fracking industry.i This is not the same industry that responded to high oil prices from 2007 to 2014 with 2,000 working rigs in the U.S. Instead, fracking’s recent history is of an industry seriously damaged by a series of reckless investment decisions in the run-up to the 2014 fracking bust, by its continued bad investments after 2016 when was clear that fracking is a high-cost source of oil, and by repeated punishing price cuts from OPEC+ that have finally forced this high-cost reality on them.
- Growth of tight oil and natural gas exploded in the early 2000s, and it has since been boom and bust for American fracking. U.S. oil production boomed at 24.6 percent annual rates from 2004-2014 as a result of OPEC driving $100 oil prices, the Federal Reserve delivering zero interest rates after 2008, and speculative excesses by both the U.S. fracking industry and those who financed it. It was an oil boom that rivaled the 1980s.
- The fracking bubble burst in 2015-16 when OPEC slashed oil prices, but it took until 2018 and rising interest rates from the Federal Reserve before the last avenue of growth was cut off from this capital-intensive industry. With oil prices hovering at $50-$55 in 2018, the industry could neither improve equity values nor earn significant profits.
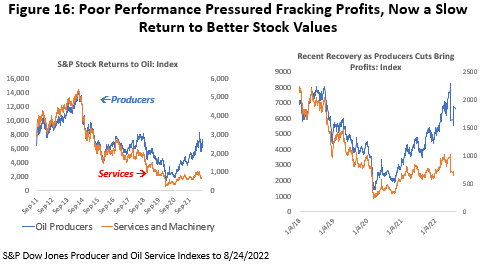
- In 2018-19 the fracking industry saw a severe industrywide credit crunch as Wall Street and the investor community turned its back on the fracking business. The S&P Producer Stock Index was over 14,000 in September 2014, but it had fallen to near 2,400 by August 2020. Even with the current oil prices near $90, producer equity prices have only returned to 2018-19 pre-pandemic levels. Oil services and machinery suffered even worse losses and have seen far less recovery. (Figure 16)
- COVID lockdowns and the Saudi-Russian oil war in May 2020 marked the low point for fracking – and posed a near-death experience for many companies. The rig count briefly fell as low as 267 working rigs, down from near 2000 in 2014, and it has only recovered to 730 in 2022Q1 compared to over 1000 rigs working in 2019.
- Before 2014 the fracking industry – with the support of $100 oil – was a high-flying growth stock. All its free cashflow could be directed to the oil fields and new production. However, the 2014, 2018-19, and 2020 reversals took $300 billion in oil producer, oil service, and machinery assets through the bankruptcy courts. Today a smaller and chastised industry is a value stock that can attract investors only by committing 30% or more of it free cashflow to potential investors through dividends or to rebuilding its financial position. This means a smaller and more slowly growing industry, and that any given oil price brings a smaller impact in the oil fields than in the past.
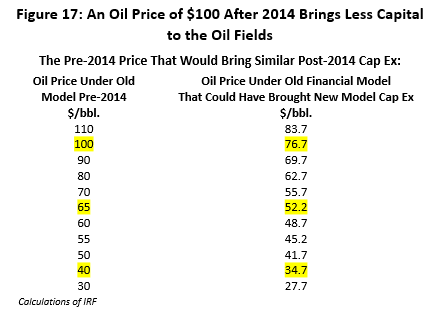
- How much smaller? Given the new financial model, how would the industry respond today to a WTI market price of $100? We know that the capital diverted to the oil fields under the new financial model will be less than before. Let’s ask the following “what if” question: Once we see the new lower capital spending level, what if we had been working under the old free-spending model? Back in 2014, what oil price could have delivered this new lower level of capital? The answer is in Figure 17, and we interpret it as saying that what $100 oil prices deliver today as oilfield spending could have been bought for $76.67 under the old financial rules. For $65 oil, think of it as today having the same impact on drilling as $52.70 would have in the boom days.
Time for Houston’s Oil Sector to Make Some Gains?
Putting current $100 oil prices aside, there is plenty of room for fracking to make some substantial gains in 2022-23. This was true well before the Russian invasion of Ukraine, and our forecasts from last year already included some meaningful increases in oil-field activity and local oil employment in 2022-23 based on financially responsible gains by the fracking industry as its economic health has improved.
Until recently, producers were reluctant to react to higher oil prices with more drilling as long as their financial position remained weak. Recent higher oil prices and stronger balance sheets, however, have offered producers the opportunity to respond with more drilling and production, although so far with limited results.
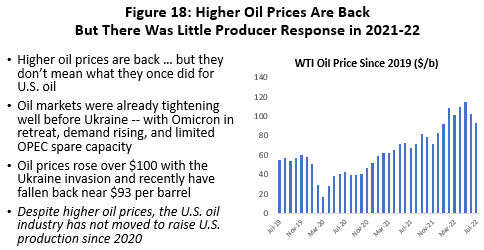
Even before the embargoes of Russian oil, oil prices had been over $70 per barrel for the previous six months (Figure 18), but we just learned from Figure 17 that $70 now has the same impact on drilling as $55.70 would have had a couple of years ago. But the producer response – based on the rig count or local oil employment -- has been weaker than even $56 would suggest.
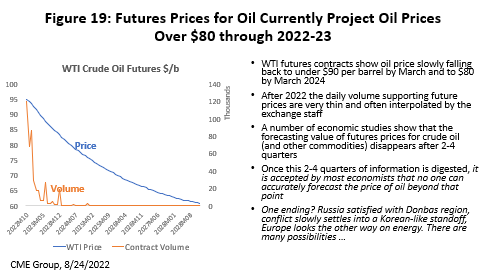
Caution is also justified because of skepticism about $100 oil. How long will it last? Figure 19 shows recent futures prices projected to hold at $90 per barrel through spring of next year. But the daily volume of contracts on which the futures prices are based become exceedingly thin past late 2022. Further, study after study of commodity markets conclude that there is virtually no information about the future in these prices past three to six months. Despite the army of consultants that has grown up to forecast oil price, studies repeatedly confirm that no one can predict the price of oil effectively past that 3-6 month point. Oil markets are too complex, are missing too much basic information, and repeatedly are subject to unforeseeable events like pandemics and European wars.
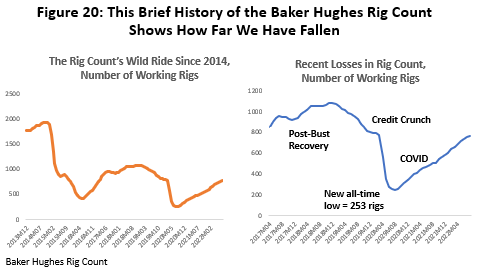
Slow and methodical recovery in the oil fields since 2020 is seen in Figure 20 and in the latest data on the rig count. Working rigs have made only limited progress over the past 18 months. The rig count fell from near 2000 rigs in 2014 to an all-time quarterly low in 2016 of 420. The pandemic and Saudi-Russian oil war then crushed that record in August 2020 with a further fall to 252 rigs. The rig count still shows a return to only 710 working rigs through this the second quarter of this year, well still short of the 1000 level briefly reached in early pre=pandemic 2019.
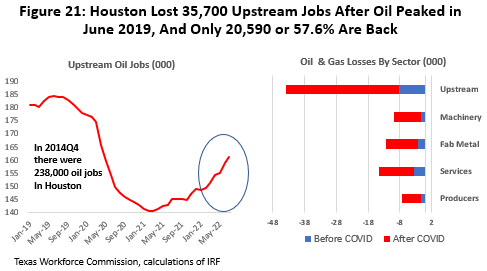
Houston’s recent trough in local oil-related employment came in September 2020 after losing 35,700 upstream jobs measured from its June 2019 peak. These are large losses but only half of the 77,200 oil-related jobs lost during the 2015-16 Fracking Bust. The 2015-16 collapse in Houston jobs resulted from a bubble that burst in U.S. fracking after oil prices fell hard in late 2014. Oil jobs hung on better this time because the local job market already had been substantially right-sized by early 2020.
Many of the oil jobs currently lost will return – but not quickly or soon. Figure 21 shows changes in upstream oil jobs: producers, services, machinery, and fabricated metal. They are measured from (1) the beginning of the 2018-19 credit crunch and before COVID, and (2) after the COVID-19 outbreak to the present. The data through July show a recovery of oil jobs that adds up to only 20,590 or just over half of the 2019 losses, and it leaves us at an employment level equivalent to that of the credit crunch period of late 2019.
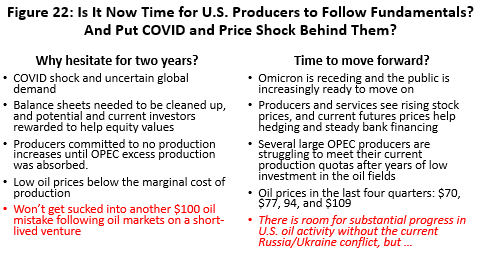
Time to Move Forward?
As a high-cost source of oil, fracking needed to completely rethink its financial model, and reconsideration has been underway since mid-2020. Amid the gloom, however, there is reason to think that perhaps the worst is over, and that it is time for U.S oil to respond better to higher oil prices than it has so far. Oil operated below fundamentals through the pandemic for good reason: COVID shock and uncertain global oil demand, the industry’s poor financial position, and because many U.S. producers committed to not increasing production until all OPEC excess reserves were absorbed. Producers were certainly unwilling – and remain unwilling -- to get sucked into another $100 per barrel venture that could lead to yet another short-lived mistake and another round of fracking bankruptcy. See Figure 22.
But now much of this damage has been repaired with COVID disappearing, great progress in financial positions, and OPEC struggling to meet production quotas even before the Ukraine invasion. The blue line in Figure 23 is the recent history of the rig count. The red line is where U.S. drilling would be if – apart from the new financial model – there was no structural change in the industry’s ability to take advantage of higher oil prices, and the rig count ramps up to respond to a $65 price target in late 2022 and after. This puts the pandemic shock behind us with a $65 price describing the industry’s new long-term niche in world markets. It is a price that makes sense for long-term capital investments, with remaining cash flow going to fortify finances, M&A, and to investor dividends.
This makes the red line our forecast for drilling. The blue line is the history or actual data up until 2022Q2. The short-term surge in drilling is the ramp up in activity to match $65 oil, and the broken blue line is to describe the still-uncertain path to describe when and where the recent past might meet the future forecast.
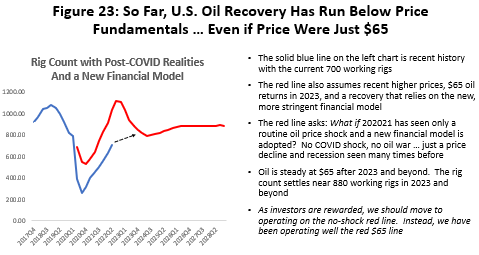
We have not been moving with much speed to fill the gap with a rig count stalled near 700 in 2022Q2. But the potential for improvement is back and is built into our forecast for the rig count and local employment. Our forecast is for the gap to close in mid- 2023 and drilling returns to long-run normal growth by the middle of next year. Then activity consistent with $65 oil prices will prevail, with a rig count near 850.
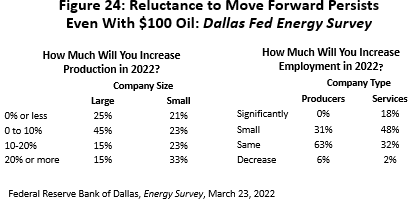
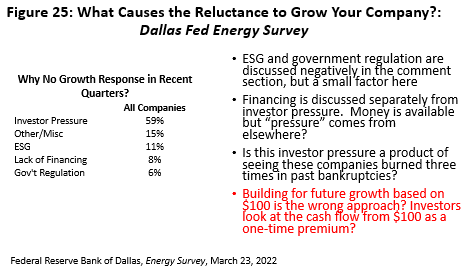
The March Dallas Fed Energy Survey asked why fracking producers have been so slow to respond to higher oil prices given the industry’s better financial and economic position described in Figure 24. They asked first what the industry’s plans were for production and oil-related employment this year and followed by asking why oil companies remained reluctant to move ahead with any vigor.
Figure 24 shows that 70% of large companies would increase production by 10% or less this year, while only 15% would entertain increases of 20% or more. Small companies – more often private – said 33% would be willing to consider larger production increases. And for employment, no producer was willing to consider more than a small increase in jobs, although the badly beaten down service industry said 66% of companies would consider at least a small increase in jobs.
When companies were asked why they were not moving forward more rapidly, ESG and government regulation were given surprisingly little consideration as factors that slowed them down, and lack of financing was no longer a significant issue. The dominant factor is simply continued investor pressure. Figure 25. Perhaps this is interpreted as follows: After watching the industry throw good money after bad in three round rounds of bankruptcy, investors are unwilling to even consider investments in $100 oil projects as a profitable way to spend company capital. It is better to steer the cash directly to investors or to fortify the company’s finances.
Our forecasts assumes that companies are finally able – and perhaps willing -- to move forward at a rate consistent with oil prices near the long-run cost of producing tight oil or $65 per barrel. This would push the rig count up to 850-900 rigs by the second half of 2023, and it would remain at that level as long as $65 oil price or better prevailed. Local oil-related employment should follow, also returning to pre-COVID 2019 peaks by late 2023.
Houston’s Employment Outlook
We know generally how payroll employment should perform over the next few quarters. We have seen the return of large numbers of COVID/contact-sensitive jobs since March 2021 and they have now likely surged well beyond pre-COVID levels with the help of stimulus. These jobs will fall back this year by 9,000 jobs as stimulus ends, while we see accelerated growth in the important jobs that drive the local business cycle. Houston has finally returned to pre-COVID total employment in April, and the U.S. followed to also match pre-lockdown employment in July. We expect gains in oil-related activity in response to improved financial health among producers, but drilling remains confined to a response to $65 oil as investors steer the industry away from any capital spending based on oil prices above the long-run marginal cost of production.
To pull the forecast together, we will use a high, medium, and low outlook for planning purposes. We use the oil prices in Figure 26 as a vehicle to spread the outlook from high to low employment levels. For current planning, high oil price over this time period remain near $80 per barrel and the low is $40. The medium or most likely price is $65 per barrel or the long-run marginal cost of oil. In all cases we use the new financial model with 30 percent of oil industry free cash flow diverted to investors. This smaller industry limits our expectations for oil-field expansion and regional growth.
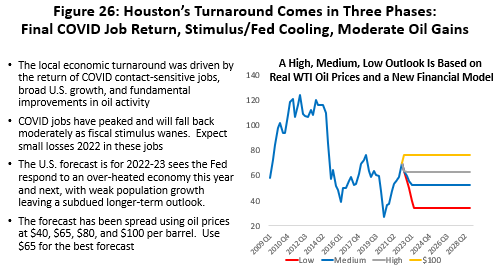
We have added to the forecast the impact of $100 oil prices in Figure 26 only to demonstrate their effect on the local economy if oil prices were to remain at that level for prolonged periods. The $100 oil price will never mean what it once did in Houston. As discussed earlier, the diversion of cash flows and reluctance to engage in high-cost drilling limit the future levels of oil-field activity.
We saw a return of all the Houston jobs lost to COVID lockdowns in the second quarter. We still have some further adjustments to be made with COVID contact-sensitive jobs falling back this year by 9,000 as the stimulus disappears. The net effect, however, is that 2022 sees economic fundamentals return to the driver’s seat as oil and the U.S. economy take control, while COVID and fiscal/monetary stimulus disappear and a stringent monetary policy guarantees a quick cooling off of the U.S. economy in coming quarters.
Figure 27 pulls this together in summary form. We follow the lead of the Survey of Professional Forecasters in assuming a meaningful slowdown in U.S. growth is just ahead, but there is not recession with both job growth and GDP moving ahead slowly. After 2023, growth picks back up in the U,S, but a moderate long-term rates as slow population growth limits job growth.
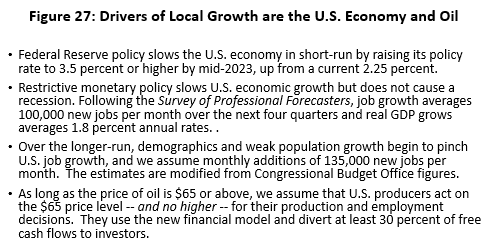
Figure 28 shows how these economic fundamentals play out over the long-run for Houston payrolls and in the low, medium, high, and $100 cases. This is our forecast of Houston’s future as far as 2028.
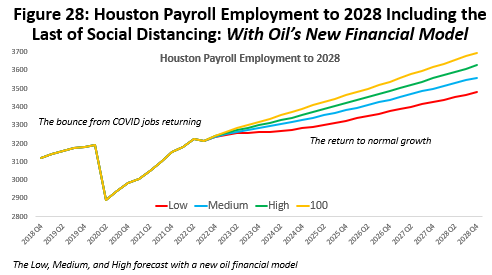
Figure 29 is this same forecast of Houston’s payroll employment to 2028 stated in annual changes that are measured from Q4 to Q4 in each year The focus is on the medium forecast and $65 oil. We see the loss of 193,100 jobs in the lockdown year of 2020, divided into 149,800 jobs lost due to social distancing and another 43.300 jobs lost to cyclical or economic base lossesii. This was a 6.1 percent total decline in payrolls. We see the return in 2021 of 167,600 jobs led by 158,900 contact-sensitive jobs joined by only 8,700 jobs from cyclical gains.
This is followed in 2022 by 82,500 new jobs, a combined 91,600 from cyclical gains and 9,1000 COVID-sensitive jobs lost in sectors like retail and food service as the pandemic recovery cools off. Oil jobs will contribute to Houston’s growth in late 2022 and 2023 and keep Houston running just below trend through 2023-24, even as the Fed efforts to slow inflation work to also slow national and regional growth.
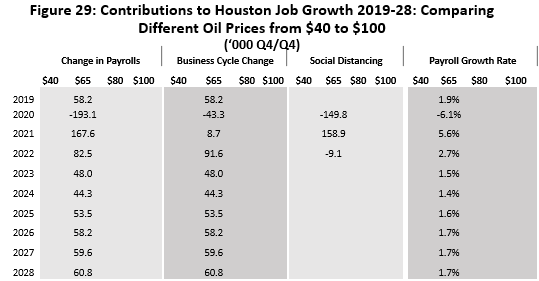
By 2024 we see payroll growth finally settle back to long-term trends at 1.6-1.7 percent annual growth rates. Houston’s history from 1990-2019 had been payroll employment growth of 2.0 percent annually. This downgrade of expectations to 1.7 percent is the result of the new financial model for oil and reduced expectations for the role of oil in the local economy. While Houston’s growth is slower than its past, expectations remains well above 1.1 percent job growth in the U.S. as seen over the same 1990-2019 period.
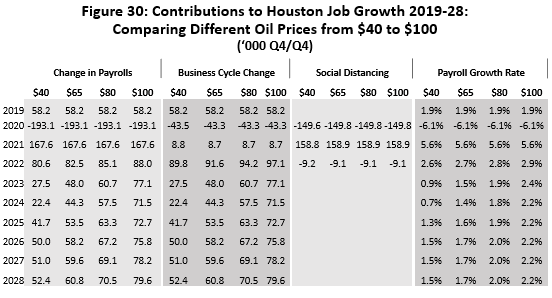
The results for high, low and $100 oil price forecasts are shown in Figure 30. The spread is the result if oil prices ranging for $40 to $100. If these oil prices were to (somehow) prevail into the long-term future they would imply growth in jobs ranging from 1.5 to 2.2 percent annually.
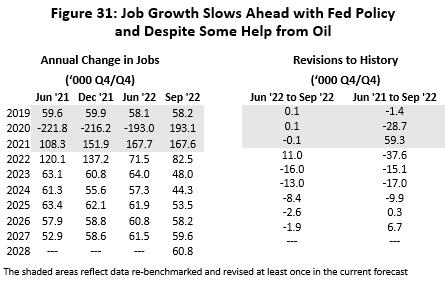
The current 82,500 jobs forecast for 2022 is a modest upgrade from the 71.500 expected last June. See Figure 31. A substantial change did occur in in the 2022 forecast for last June however, from the previous 137,200 jobs that was forecast last December to only 71.5. However, 39,000 of this reduction reflected large annual benchmark revisions made to 2020 and 2021 that show a downturn in 2020 that turned out to have 23,200 jobs fewer losses than expected, and upward revisions to 2021 data that added 15,800 jobs. In other words, there was a milder downturn and quicker recovery than previously estimated, and 39,000 future jobs that had to be taken out of the forecast.
The major current change to this round of forecasting is the work of the Federal Reserve is slowing Houston’s growth in 2023 and 2024, followed by a slower return to trend. It is the anticipated near-term help from oil that keeps us from skirting more closely with possible recession.
It is important to recognize that the number of returning jobs is exciting with 167,600 jobs last year and perhaps 82,500 jobs this year. But April 2022 only marked the return of the payroll jobs lost to the pandemic two years earlier, following on two-plus years of growth lost to recession and recovery. Recovery – a quick return of workers and with capital mostly in place – is the easy part of growth. The next phase of the cycle is expansion which requires a more difficult and slower process of training new workers and building new capital.
No matter what happens to oil prices in the near term, the new financial model for oil means that through years to come local economic expansion will be handicapped compared to the past. The response of oil will be relatively lackluster. The good news about oil is that the new financial model should make it a much more stable industry. The wild gyrations since 2014 – and its unpredictable economic impacts on Houston economy – could be behind us for a while.
Written by:
Robert W. “Bill” Gilmer, Ph.D.
Director, Institute for Regional Forecasting
September 14, 2022
University of Houston
C. T. Bauer College of Business
i We have produced several earlier reports and presentations with detailed discussion of the recent problems and dilemmas now faced by the U.S. fracking industry, including “Oil Picks Up the Pieces After Economic Shock: Recovery Now Begins for Oil Markets and Houston, Institute for Regional Forecasting, September 2020 and Adriana Fernandez and R.W. Gilmer, “Houston and the Future of American Fracking: March 2021.
ii Philadelphia Federal Reserve Bank, Survey of Professional Forecasters, Third Quarter, 2022