Houston Updates
-
Archive
- June 2025
- March 2025
- December 10, 2024
- September 14, 2024
- May 21, 2024
- March 19, 2024
- December 9, 2023
- June 16, 2023
- April 6, 2023
- March 17, 2023
- Dec. 19, 2022
- Sept. 14, 2022
- July 4, 2022
- March 27, 2022
- March 9, 2022
- September 2021
- April 2021
- March 2021
- September 2020
- August 2020
- June 2020
- April 2020
- March 2020
- January 2020
- December 2018
- June 2018
- March 2018
- February 2018
- January 2018
- September 2017
- September 2017 Post-Hurricane
- June 2017
- March 2017
- January 2017
- September 2016
- March 2016
- December 2015
- September 2015
- June 2015
- March 2015
- December 2014
- June 2014
- March 2014
- November 2013
- September 2013
Houston Outlook Grows Darker as the Oil Downturn Becomes Deeper and Longer
June 23, 2015
The Houston economy is once more struggling through another downturn in oil markets. Oil prices fell below $50 from January to March, and have recently stabilized near $60. The Baker Hughes rig count is down by over 50 percent, and capital spending in the oil fields is estimated to be down by one-third or more or as much as $100 billion.1
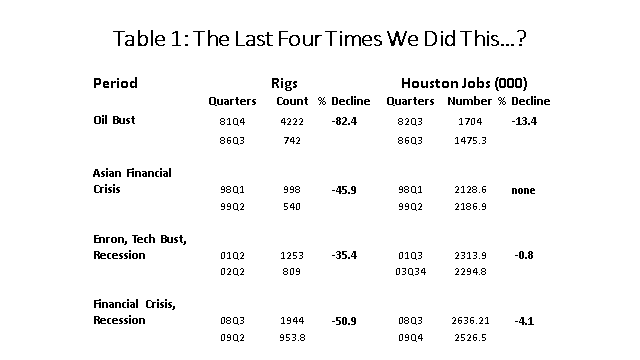
This marks the fourth oil-related setback for Houston since 1982. The disastrous 1982-87 recession can be largely discounted as a guide to how the current drilling downturn will affect the Houston economy. It was an economic tragedy unlikely to be repeated, resulting from a triple blow from energy, real estate, and the collapse of the Texas banking system. Together these events brought nearly five years of decline to Houston, and snuffed out more than one job in eight. In contrast, the Asian Financial crisis in 1998-99 saw oil prices fall to $10 per barrel and the domestic rig count cut by half, but Houston lost no jobs thanks largely to a very strong national economy. Then in 2001-02, the combination of U.S. recession, the Tech Bust, and the fall of Enron resulted in a decline of local employment of less than one percent, and the 2008-09 American Financial Crisis saw job losses of 4.2 percent. These last three downturns are much better models for what is happening in Houston today than the 1982-87 recession. (Table 1.)
As we have noted in two previous economic updates, Houston will receive relief this time around from two sources: (1) a strong national economy, and (2) a major construction boom in east Houston driven by low natural gas prices.2 Out of $138 billion in nationwide spending for new chemical projects – a result of low energy prices and the shale revolution -- metropolitan Houston’s share is about $30 billion.3 The combination of a drilling downturn, a strong national economy and substantial heavy construction means that Houston will likely avoid job losses in 2015 and 2016. But the local economy may barely skirt recession. Should Houston create fewer than 15,000 new jobs in 2015 – as it does in the scenarios presented below -- it will contrast sharply with the 100,000 new jobs the metro area averaged each year from 2012 to 2014. The effects of the energy downturn will be felt very unevenly across the metropolitan area.
Houston Economy Now Feeling the Economic Pain
The economic outlook for Houston has turned increasingly negative as we have moved into 2015. It has been a year since the slide in oil prices began, although serious concern did not really set in until last Thanksgiving Day, when OPEC announced it would let the market set future oil prices. Just as they did in 1982, OPEC withdrew from its role as the swing producer, i.e., the oil producer willing to cut production in order to support oil prices. They strongly signaled that in the future producers of high-cost sources of oil like shale oil from Texas and North Dakota would be responsible for removing surplus oil from world markets. This has set off a difficult and messy retreat for hundreds of U.S. oil producers. With cash flow cut by 50 percent, they have been forced to cut back on capital spending (i.e. drilling) and to slash employment. In Houston, the cuts spread quickly from industry to industry as oil company suppliers and contractors are immediately affected.
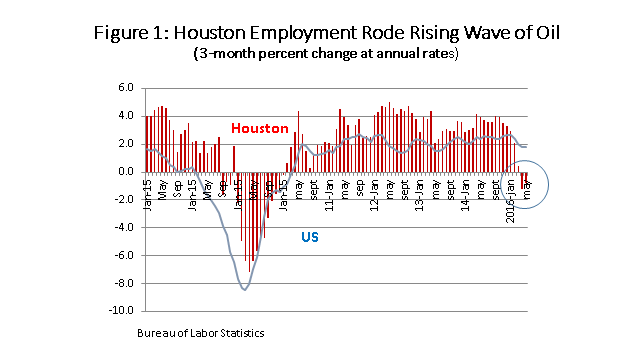
There is little doubt that low oil prices are already taking a significant toll on the local economy. Through May, seasonally adjusted job growth in Houston has turned flat for the year, with jobs growing at only a 0.2 percent annual rate since December. Figure 1 illustrates how the regional economy leveraged $100 oil to grow much faster than the U.S. after 2009 -- and also how low oil prices are already hurting the economy in 2015. The local Purchasing Managers Index, a leading economic indicator for Houston, has turned sharply negative and is now pointing ahead to a significant decline in the economy. (Figure 2) The Federal Reserve Bank of Dallas has joined the growing pessimism, and is now forecasting statewide job growth to fall below one percent in 2015. The Houston metro area will be caught between two major energy events: it will be hurt worse than much of the rest of the state by the drilling decline, but also will be helped more by the petrochemical expansion underway.

The decline in drilling has run faster and deeper than we anticipated in earlier scenarios for Houston growth. The decline in the rig count has outpaced even the 2008-09 decline that was brought on by financial crisis, major recession, and a fall in the price of oil to $35 per barrel. More than half of domestic rigs have been cut (55.5%), 50 fewer rigs are working than at the same point in the 2009 decline, and -- while the rate of decline is slowing – no bottom has been reached yet.
It is fairly easy to picture the impact of a falling rig count on producing regions such as the Eagle Ford or Permian Basin. A recent study from Rice University put the employment impact of putting a drilling rig into service at 37 immediate new jobs, and after all the multipliers work out -- beginning with oil service companies, machinery and fabricated metal, engineering, management, and ultimately reaching the grocery store and pharmacy -- there are 224 new jobs. This also works in reverse, of course, and the loss of 1072 working rigs through June has put in train the ultimate loss of over 240,000 drilling-related jobs.4
The producing regions first feel the impact of a falling rig count, of course, but how is Houston affected? Houston does not produce much oil, with only a few drilling permits issued in the metropolitan area each year, but in late 2014 fully 35.0 percent of Texas oil producer and oil service employment was housed here. This comes about several ways: Houston is home to dozens of large and small oil producers making decisions on where to drill, what to drill for, financing the drilling, and assuming the risk of the projects; Houston is also home to a global oil service industry that does the drilling and testing work at the wellhead for projects around the world; suppliers such as fabricated metal and machinery, pipelines, and engineering companies cluster in Houston to be near their customers -- the producers and service companies. Houston’s oil-related employment is a large white-collar managerial, engineering and technical base that – complemented by an equally large blue collar manufacturing base -- forms the headquarters and operational arm of the American oil industry.5
How is Houston affected as the rig count falls by half?
- We discussed earlier how oil producers, the key decision makers in the oil industry, now find cash flow reduced by half, must cut capital investment and drilling, and reduce expenses including direct employment and contractors. There is still a shortage of core skills in the industry – geologists, geophysicists, reservoir engineers, or drilling engineers – and there will be a bias to hoard this technical experience. In the 2008-09 downturn, oil producer employment remained very stable, despite the depth of the downturn.
- The oil service companies work at the wellhead, and will be forced to cut crews in producing regions around the world as the rig count falls. Like the producers, they will hoard high-level technical skills, but even Houston will see heavy cuts as the workload falls right along with the rig count.
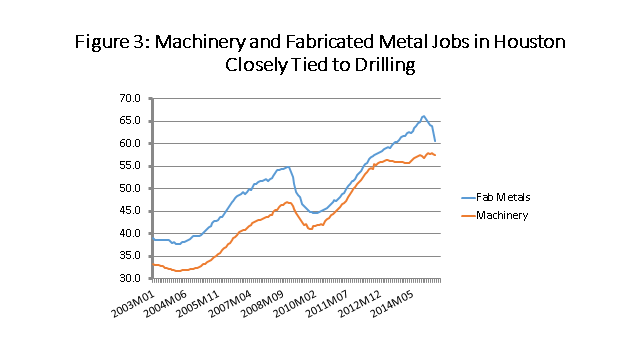
- A large Houston manufacturing base in machinery and fabricated metal is linked directly to upstream oil. Figure 3 shows how in recent years these industries made Houston one of a handful of American cities that could claim to house a rapidly growing number of manufacturing jobs. The machinery industry is tied closely to drilling, and had already slowed with the collapse of natural gas prices in late 2011. Fabricated metal is now feeling the current decline in the rig count, but should get some relief from on-going petrochemical construction activity, as machine shops for example will be able to replace some of their lost upstream work.
- Oil producers and oil service companies are diligent about out-sourcing many of their non-core activities. Operating in a highly-cyclical and commodity-based business, periodic downturns are expected; it is easier to fire a contractor than your own employees, and advantageous as activity slows to be able to pull work from contractors and back into your business. In Houston, this applies to many white-collar jobs such as legal, engineering, personnel, payroll, or accounting, and out-sourcing makes Houston’s white-collar employment highly cyclical.
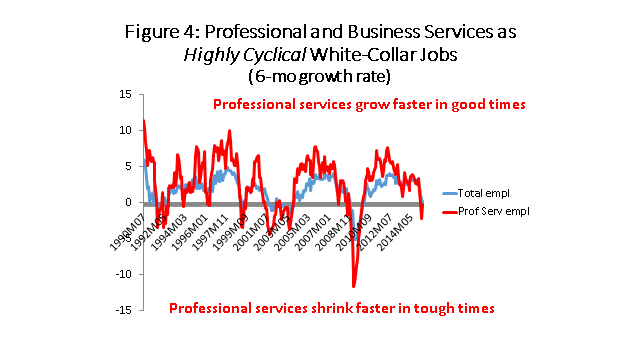
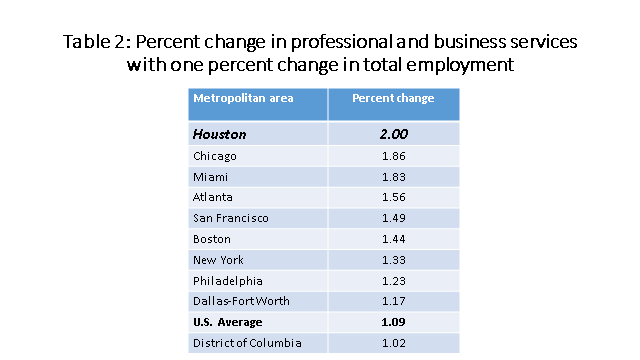
- Houston has about 450,000 jobs in the professional and business services sector, a sector is comprised of exactly the kind of white-collar office employment described above. Figure 4 compares the growth rate of this sector (the red line) with that of total employment (blue). While we often think of the service sector (retail, health care, education) as relatively stable, it is clear this particular sector is not, as it grows much faster in good times and declines faster in tough times. How much faster? For every one percent change in total employment in Houston, there is a 2.0 percent change in professional and business services – whether up or down.
- Table 2 compares Houston’s 2.0 percent change to other large U.S. metropolitan areas. The typical U.S. metro area sees only a 1.09 percent change in these white-collar jobs for each one percent change in total jobs, but a higher figure is typical of the largest metropolitan areas. We find Houston standing alone at the top of the list with the most volatile swings in white-collar employment of all the large cities. Chicago is number two at 1.86, a city built on a large and highly cyclical manufacturing base, and Miami at 1.83 is dependent on an unpredictable Latin American economy and even less predictable exchange rates. Washington, D.C. and the federal bureaucracy have the most stable office employment on the list.
- Oil industry out-sourcing provides the entry point for large numbers of white-collar and office-based layoffs. Houston’s west side is home to the vast majority of these jobs, most based in the Energy Corridor and Galleria areas. The extraordinary recent growth of the oil industry has injected a powerful flow of energy-related professionals into the west side, many of them young, and now the flow is likely to slow sharply. This puts at risk many projects that depend on white-collar customers or tenants, such as high-end apartments, upscale retail, and office buildings.
- Finally, every energy job in Houston supports four others in Houston. Some will be the machinery, metals, and out-sourced, white-collar employment already discussed, but job losses ultimately extend down to the neighborhood grocery store and dry cleaner. Perhaps because there is some catch-up to be done in response to the strength of recent economic and population growth, we see sectors such as bars and restaurants, hotels, and retail continuing to hire quite strongly through the first five months of 2015. In fact, they are hiring at the same rate as 2014, i.e., as if they expect another 100,000 new jobs in Houston this year. Sooner or later these local services must slow to reflect the bad economic news now driving the fundamental energy sectors in Houston, sectors that can provide leadership for the Houston economy.
Oil Price Outlook
Bulls and bears are both presenting strongly held arguments for their views on the outlook for oil prices.
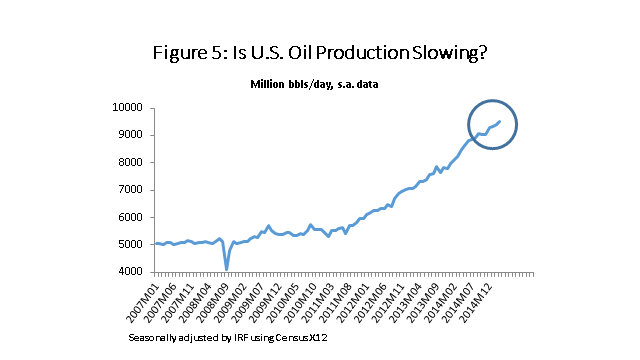
- Falling U.S. oil production is the key to rebalancing oil markets, and bulls argue that oil production is already responding -- or soon will respond -- to a falling U.S. rigs count. By late 2015, we will see U.S. production fall back to the levels of late 2014 were the oil price slide began. Once oil price rises, producers will exercise constraint, not spend at rates that outstrip cash flow as they did before. We are seeing a real firming of global demand, led by Europe and the emerging markets, which can only accelerate the correction. See Figure 5.
- Bears argue that demand might be improving incrementally, but it is hardly the good old days. Anyway, there is a huge overhang of storage to work off, and a growing inventory of drilled but uncompleted wells. Deep-pocketed producers have drilled 4,000 wells to take advantage of low drilling cost, but have not completed the wells. In response to a rise in price, the producers could bring on 500,000 barrels per day of new production in only a few months.
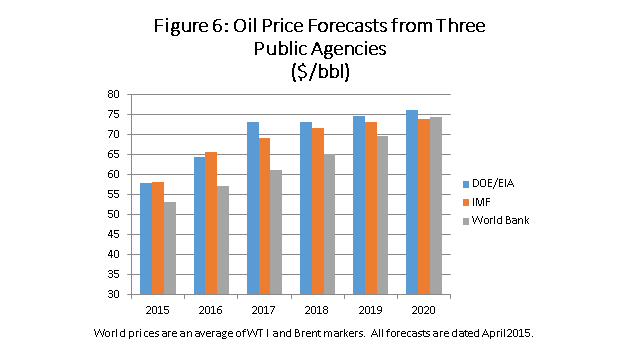
These disparate views on market fundamentals are reflected in recent forecasts for oil prices. Major public institutions like the U.S. Energy Information Administration (EIA), the World Bank, and the International Monetary Fund (IMF) all converge on a longer-term price near $75 dollars per barrel. Opinions vary in the near-term, however, with the EIA seeing oil prices averaging above $70 per barrel as early as 2017, while the World Bank does not expect to see oil an annual average above $70 per barrel before 2020. (Figure 6.) A look at forecasts from large financial institutions provides more of a spread, with 2016 forecasts ranging from $55 to $90 per barrel. Perhaps the most telling data regarding the uncertainty about future oil prices comes from a recent report from the IMF, asking analysts to provide the range needed for 2016 or 2017 for them to be 95 percent sure that a forecast of oil prices would fall in that range. The answer was $28 to $108 for 2016 and $28 to $138 for 2017.6 This nicely underscores the near-complete uncertainty associated with the near-term outlook for oil prices – and the risk to the Houston economy that follows immediately on its heels.
Outlook for Houston
The fundamentals of economic events in Houston today have been presented in a previous reports and presentations.7 Early this year, and through the spring, it was possible to hold out the thought that oil prices might stabilize, perhaps hoping oil markets had overshot equilibrium or that the Saudis might relent and support oil prices. Previous updates have focused on a possible optimistic outlook with early/higher stabilization in oil prices, as well as a scenario with a “more likely” deep downturn in drilling. Both scenarios assumed that the U.S. economy stays strong through 2018, and that substantial levels of petrochemical construction in east Houston continues and partially offsets the drilling downturn in 2016 and 2017.
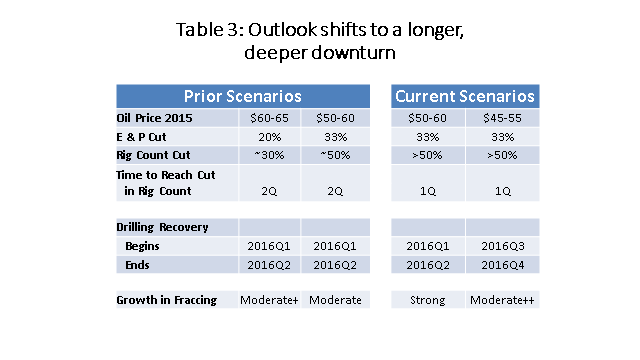
We have now reached the point where hopes for a short or moderate drilling downturn are behind us, as oil markets have turned down faster and plunged deeper than expected. The relevant question becomes how long a serious downturn will last. Table 3 summarizes the oil market scenarios we worked with previously, and compares them to two current scenarios. The first difference is that we were too optimistic about the speed and depth of the drilling decline, which has already exceeded prior expectations. The current and most likely scenario, still assumes that oil markets rebalance by the end of the year, drilling picks up and returns to high levels by mid-2016. The alternative scenario – it was previously a more optimistic alternative – has shifted to a more pessimistic outlook, with oil markets not rebalancing before mid-2016 and drilling only returning to high levels by early 2017. The new scenarios are both more pessimistic than previously about the short-term, but more optimistic about the long-term outlook. We have learned from this downturn that shale may be more resilient than previously thought: the long-term outlook for shale oil is probably more cyclical, but drilling for shale can return to high levels of $70-$75 per barrel.
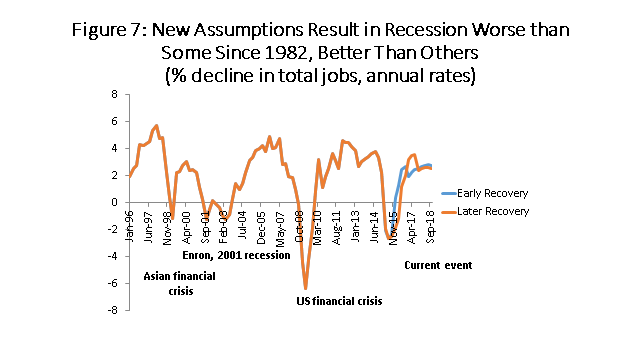
Just as we asked previously: What level of employment and job growth is consistent with a combination of these oil market assumptions and solid U.S. growth?8 We put aside the petrochemical boom in east Houston for the moment. Both scenarios would bring a mild recession to Houston: Scenario 1 leads to a cumulative decline of 51,800 jobs or 1.7 percent over three quarters, while Scenario 2 brings a loss of 74,100 jobs or 2.5 percent over 5 quarters. You can compare these job losses to earlier recessions in Table 1, and the assumptions would bring the worst oil-driven downturn since 1982 except for 2008-09. Figure 7 makes the same point. Note the much faster rebound in Scenario 2 after being held down for an additional two quarters, with the job market reacting like a rubber band that has been pulled more and more tautly.
The Petrochemical Boom
Previous reports have covered at length the roots of the current boom in petrochemical construction on the Texas and Louisiana Gulf Coast at length.9 Horizontal drilling and fracturing was developed initially to produce natural gas, and strong growth in gas production, slow growth in the U.S. economy, and a limited ability to export natural gas combined in late 2011 to collapse and seriously depress natural gas prices. These low natural gas prices have resulted in tremendous competitive advantages for North American producers of petrochemicals, plastics, and synthetic rubber. This stems from the rest of the world -- outside North America --relying on oil-based naphtha to make its petrochemicals. Until recently, feedstock costs were $100 per barrel in the rest of the world, and the equivalent of $20 per barrel in the U.S. based on natural gas prices. The promise of low natural gas prices, continued high oil prices, and a well-established energy and transportation infrastructure on the Gulf Coast has kicked off a tremendous boom in construction of petrochemical facilities and liquefaction plants to export natural gas.
Our "most likely" scenario used in earlier reports combined a significant downturn in drilling activity with continued high levels of natural gas-driven construction. The first event is the result of low oil prices, and the second the result of low natural gas prices. The assumption that these construction projects will continue despite tough times in drilling turns out to have been the right one. While margins for petrochemicals based on oil feed stocks have risen, and the competitive advantages of natural gas is now sharply lower, sponsors of these projects are looking out several years. These companies are large, deep-pocketed corporations such as ExxonMobil, ChevronPhillips, and Dow. Looking through the oil price decline, they see high petrochemical margins restored as oil prices rise in 2016 and 2017, or at about the same time as their plants are completed. Labor and machine shop capacity is also now more available, as resources have been freed up by the drilling bust. The best sign of continued enthusiasm about the future of these plants is that large new plants are still being announced.
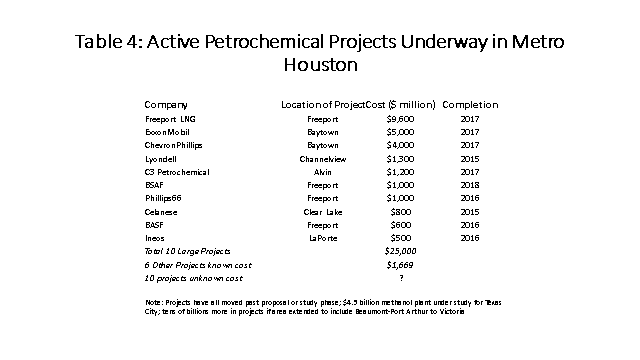
Table 4 shows a list of 10 large projects currently underway in the 9-county Houston metro area that account for $25 billion in construction; another 6 smaller projects add another $1.7 billion; and another 10 projects have no announced cost. This approximately $30 billion in on-going construction should add a significant cushion against the kind of drilling-driven downturn described in Figure 7.
Downstream construction activity is not confined to the Houston area, with similar levels of construction activity underway in the Victoria/Corpus Christi corridor, and well as another concentration of activity near Lake Charles/Sabine Pass.
Accounting for this construction as part of the outlook for Houston’s employment has been described in earlier reports. On the one hand, it is a buffer against the drilling collapse. But its ability to work as a buffer has its limits: the construction is temporary, will wind down in 2016 and 2017, and the blue-collar workers drawn to the Gulf Coast will be a very imperfect substitute for the white-collar professionals lost to the drilling bust. With Houston divided along Highway 59, the upstream drilling downturn that will hit many white-collar professionals is going to run unabated in west Houston, while east Houston generally sees boom times for its blue-collar workforce. If job growth remains positive overall, it will be felt very differently and unevenly across the metro area.
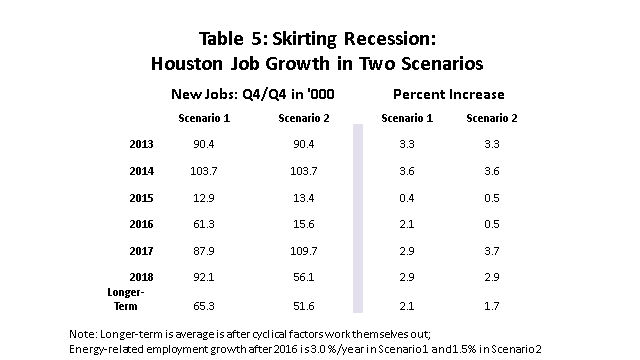
We have added this extraordinary construction activity into the forecast, much as we did previously. The construction activity has been accelerated from previous forecasts, but labor constraints and limited multipliers make it difficult to move the employment forecast by much. Meanwhile, the accelerated and deeper downturn in drilling takes a bigger toll than previous scenarios. The result, summarized in Table 5, is only about 13,000 new jobs in Houston in 2015, rebounding to 61,300 in 2016. In Scenario 2, where the downturn lasts two quarters longer, there are 13,000 jobs in 2015, while 2016 brings only 15,600, then we get a very strong bounce back in 2017. Our “most likely” scenario in March was 53,600 jobs in 2015 and 46,100 in 2017.
These scenarios imply, that once the cyclical factors are worked out, and based on assumptions about the ultimate future of shale oil production, Houston’s long-term employment growth would return to about 2.1 percent or very near its average of the last 25 years. If shale is less successful, as in Scenario 2, Houston’s long-term job growth falls to 1.7 percent.
Conclusion
Oil prices have been falling or at low levels for a year, and prospects for a quick turnaround in in the oil industry is fading. Even with the U.S. economy improved and growing with some strength, the length and depth of the current drilling downturn would normally bring a mild recession to Houston. Fortunately, another very large energy event is taking place on the Texas Gulf Coast as well, with low oil prices driving a major construction boom. The construction provides a partial offset to the shale bust, but the temporary nature of the work limits its overall impact. Adding these construction jobs into the mix probably keeps Houston out of recession, but not by much. If oil prices revive by the end of 2015, and drilling returns to high levels by mid-2016, Houston would add about 13,000 jobs in 2016 and 61,000 in 2017. If oil prices don’t revive until the middle of 2017, with drilling back at high levels by year-end, it means back-to-back years of very slow growth in Houston before the local economy stages a very strong recovery.
The shale boom is at least temporarily at an end, and Houston is caught squarely in the downdraft. The employment figures we presented in Table 5 for 2015 to 2018 are not forecasts – just two scenarios consistent with the current facts and our estimate of how Houston’s economy would respond in these particular circumstances. The path of oil prices over the next few quarters is simply unpredictable right now, and the near-term outlook for the local economy inevitably shares that uncertainty. We can be sure oil will return to profitable levels above $65-$70 per barrel in the not-too-distant future – but timing is everything.
Notes
1 This material is slightly updated from the May 12, 2015 Economic Symposium sponsored by the Institute for Regional Forecasting, Bauer College of Business, University of Houston.
2 R.W. Gilmer, “For Better and For Worse: Oil Industry Still Drives Houston’s Economic Outlook,” Institute for Regional Forecasting, Bauer College of Business, University of Houston December 16, 2014, http://www.bauer.uh.edu/centers/irf/houston-updates-dec14.php; R.W. Gilmer and A.W. Perdue, “Houston and Low Oil Prices: An Update on the Economic Outlook,” Institute for Regional Forecasting, March 24, 2015 http://www.bauer.uh.edu/centers/irf/houston-updates-march15.php
3 American Chemistry Council, “New Manufacturing Projects Are Growing Our Economy and Creating Jobs,” 2015 http://www.americanchemistry.com/Policy/Energy/Shale-Gas/Shale-Investment-Infographic.pdf
4 Mark Agerton, et al., “Employment Impacts of Upstream Oil and Gas Investment in the United States,” RISE Initiative for the Study of Economics, RISE Working Paper 14-004, Rice University, July 28, 2014
5 R.W. Gilmer, “Houston: America’s Oil Headquarters,” Tierra Grande, Publication 2051, Texas A&M Real Estate Center, January, 2014
6 Figure 1.SF.4, “Brent Price Prospects,” IMF World Economic Outlook, April 2015, p. 29.
7 See note 1 above.
8 Why scenarios? I have been careful not to call the outlook presented here a forecast. The distinction has to do with the uncertainty that surrounds the current outlook, particularly the outlook for oil prices. Tell me the gender, height, and bone structure of someone, and I can predict their weight fairly well. Left to guess their gender or height, I have a different statistical and logical problem. Tell me the performance of the U.S. economy and the price of oil, and I can tell you a lot about the outlook for Houston’s job growth. Left to guess the price of oil, as we are today, we should not disguise the fact that there is great uncertainty about local job growth. The employment growth numbers presented here are consistent with oil market assumptions in Table 3, strong U.S. growth, and high levels of petrochemical construction in east Houston. There is planning value in understanding how Houston’s economy reacts to these assumptions, that this is not 1982, and that as far as we can currently see there is no major recession lurking on the economic horizon. But if oil markets go elsewhere, so does the Houston economy.
9 See note 8 above.
Written by:
Robert W. Gilmer, Ph.D.
Institute for Regional Forecasting
June 23, 2015