Houston Updates
-
Archive
- June 2025
- March 2025
- December 10, 2024
- September 14, 2024
- May 21, 2024
- March 19, 2024
- December 9, 2023
- June 16, 2023
- April 6, 2023
- March 17, 2023
- Dec. 19, 2022
- Sept. 14, 2022
- July 4, 2022
- March 27, 2022
- March 9, 2022
- September 2021
- April 2021
- March 2021
- September 2020
- August 2020
- June 2020
- April 2020
- March 2020
- January 2020
- December 2018
- June 2018
- March 2018
- February 2018
- January 2018
- September 2017
- September 2017 Post-Hurricane
- June 2017
- March 2017
- January 2017
- September 2016
- March 2016
- December 2015
- September 2015
- June 2015
- March 2015
- December 2014
- June 2014
- March 2014
- November 2013
- September 2013
Economic Update: Sixteen Charts with the Latest Data on COVID-19 and Houston’s Economy
September 22, 2020
This brief economic update is a guide to current economic conditions in Houston with a set of 16 charts and figures and a brief description of each. It updates two earlier reports on Houston that described, at length, our thinking about current progress in Houston’s economy, the effects of the coronavirus, as well as the current difficulty of drawing specific conclusions about the future economy.1
As long as the virus remains in charge, we are left guessing at even the most fundamental economic matters. Any forward looking projections necessarily use basic assumptions to give the discussion structure – like an assumed date end to the pandemic or the rate at which social distancing disappears by early next year – and they must be seen as hypothetical examples. The latest data shown here shows us still inching along toward the finish line.2
Houston’s economy is driven approximately 60 percent by the U.S. business cycle, 30 percent by oil markets, and 10 percent by long-term factors such as demographics and the Texas Growth Formula. Now a new element has been added to the local business cycle by COVID-19 with its effects shared across the globe and in every city. This spring the virus left economic data for every country or city looking alike – as if someone had dropped a fishing line off the side of a bridge.
Figure 1 shows that this distinctive COVID shape is shared by the U.S. economy and oil markets, and hence by Houston as well. The left side of the chart shows the March/April collapse of payroll employment in both the U.S. and Houston. The U.S. saw 21.0 million jobs disappear or 13.8 percent, while Houston lost 339,400 or 10.6 percent. How bad is this? Compare this two-month decline to Houston’s worst-ever loss of 212,000 jobs during the oil bust of 1982-87, for example.
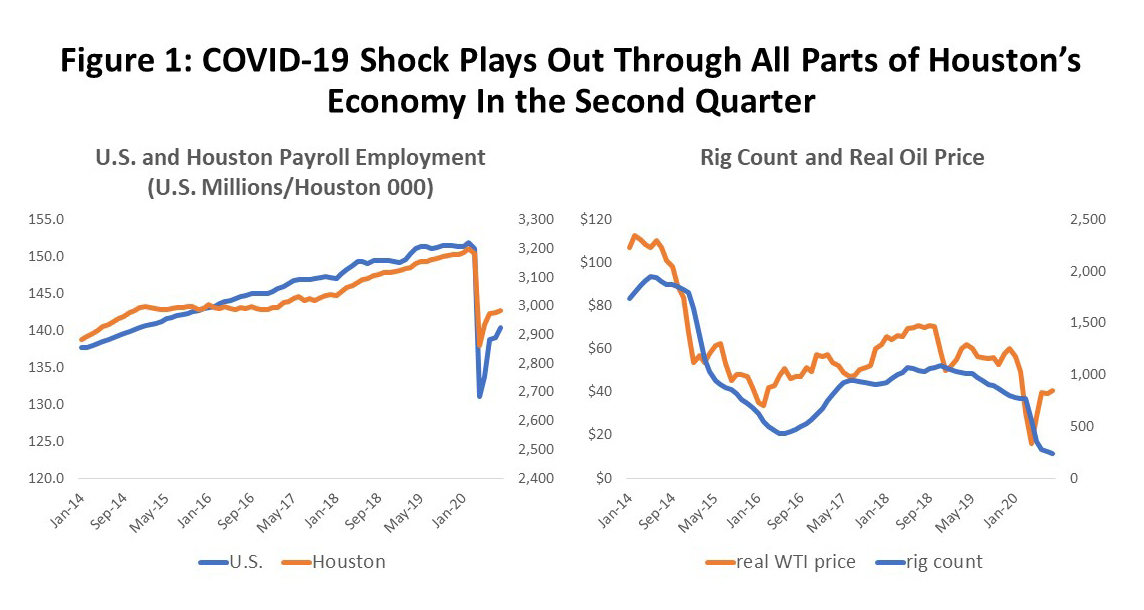
The right side of Figure 1 shows that oil’s performance was different only because the decline in oil prices and the rig count began in 2019, well before the arrival of COVID-19. However, as global stay-home orders took form in March/April and nonessential businesses closed, oil prices and oilfield activity collapsed in April along with the demand for oil.
Employment and Unemployment
Heavy job losses have been the dominant feature of the COVID-19 downturn with most of the losses driven by social distancing. Social distancing can be reactive behavior by the public driven by fear of contagion, and in past epidemics sectors like retail, bars and restaurants, and personal services like barbers and hairdressers have been prime targets. Alternatively, social distancing can be mandated by public orders to limit mobility, close schools and nonessential businesses, or prevent public gatherings. The COVID crisis brought a new wrinkle early in the crisis with widespread and mandatory stay-home orders for nonessential workers and the closing of nonessential businesses. Both reactive and mandatory distancing were at work in March and April but the abruptness and extent of the economic shock was precipitated by public health concerns.
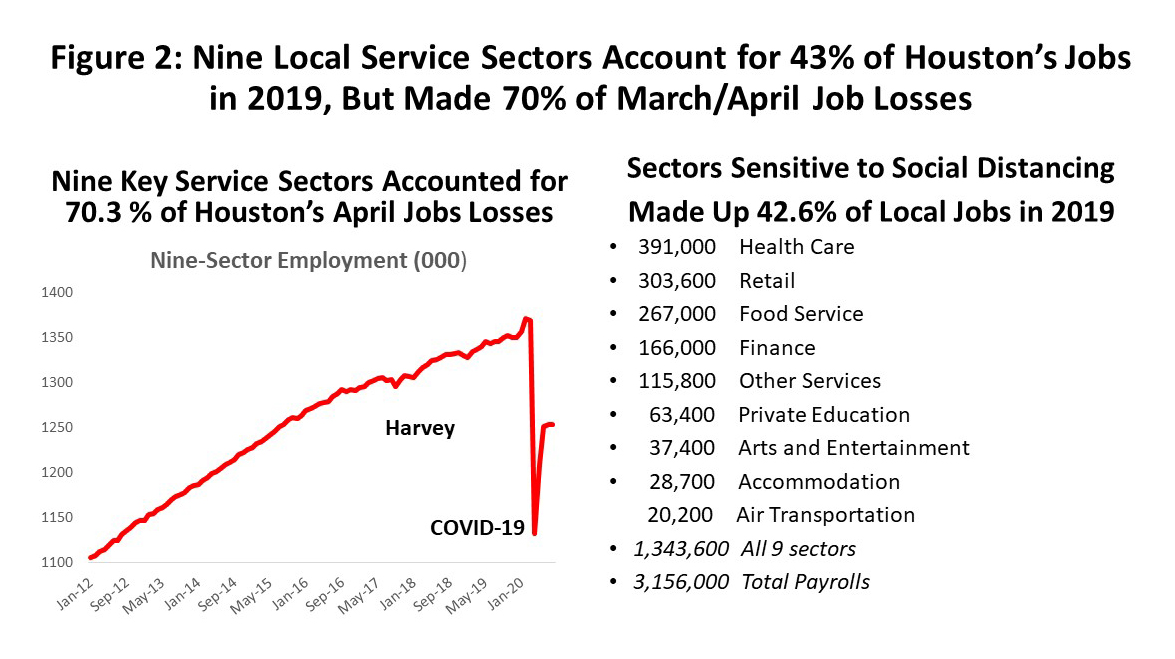
Figure 2 lists nine sectors that are particularly sensitive to social distancing along with their 2019 average employment. The largest sectors are health care, retail, and food service, and together the nine service industries account for 42.6 percent of all Houston payrolls. When the March/April collapse in payrolls came, 70.3 percent of all job losses were in these virus-sensitive sectors.
What other sectors beyond social distancing were hurt in March/April? The largest was construction which shut down 30,700 jobs; professional and business services followed, with 25,300 jobs lost, although 13,900 were in temporary and provisional jobs in employment services; upstream oil lost 12,300 in March/April; and non-oil manufacturing lost 7,700.
Figure 3 compares the recent monthly changes in the nine socially-sensitive sectors in Houston to the change in total employment, with both measures bouncing back in May and June before slowing sharply. Total payroll recoveries through August are 121,200 after 339,400 jobs were lost in March/April or 35.7 percent. Job recoveries in the nine service sectors from April to August accounted for a 121,200 jobs -- an increase of 50.7 percent that also brought all of the increase in total payrolls.
The net additions to job growth have been slower in each succeeding month, however, and all but disappeared in July and August. Houston’s employment situation worsened in these months because of a surge in coronavirus cases and the re-imposition of restrictions on nonessential businesses. By August, the coronavirus had begun to recede but still with no meaningful gains in local job growth. The payroll employment survey falls early in August and may have come too early to report any recovery surge, but apart from Houston the statewide data looked good in August. Perhaps oil played a Houston-specific role. We should certainly expect to see decent gains in local employment by September, and failure to see improvement will be a cause for concern.
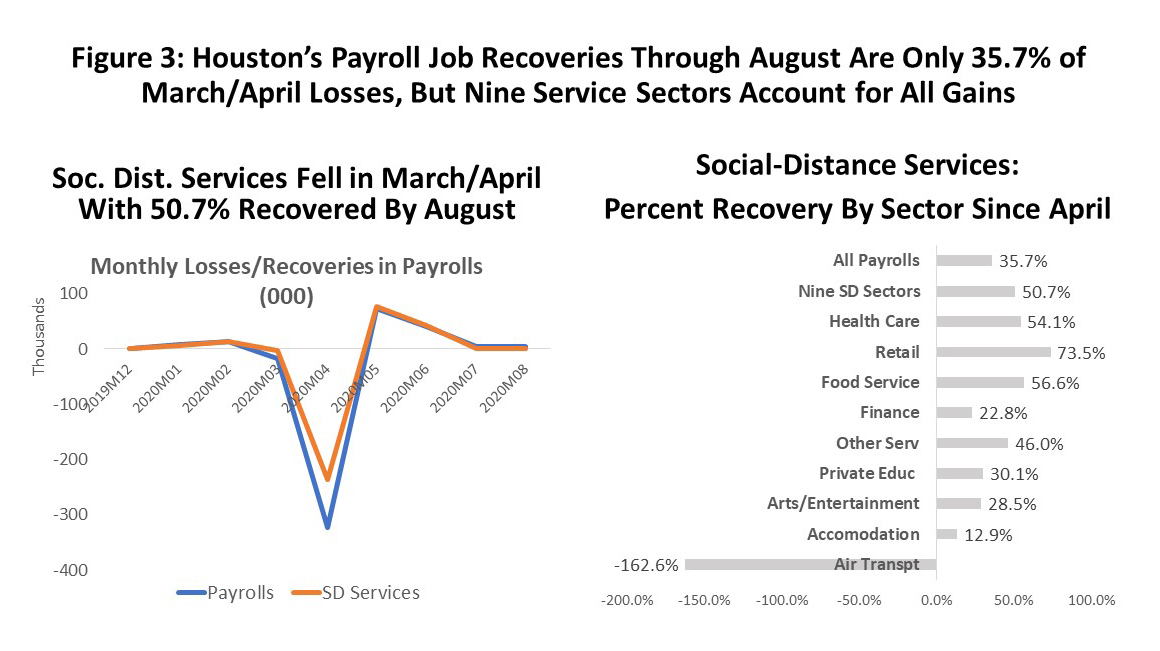
All of the nine service sectors except air transportation shared the recovery to some extent. The sectors on the right side of Figure 3 are arranged from largest to smallest employment levels as we move from top to bottom. The largest percentage gains are in the numerically largest of the socially-sensitive sectors, in particular health care, retail, food service, and other services including barbers and hairdressers. Relaxing stay-home orders added back 50.7 percent of the losses in these nine sectors.
Houston’s unemployment rate peaked in April at 15.1%, but the recovery of jobs through August allowed it to fall back to 7.5 percent. (Figure 4.) Household employment through August, however, showed it was still 101,500 jobs below its February level.3
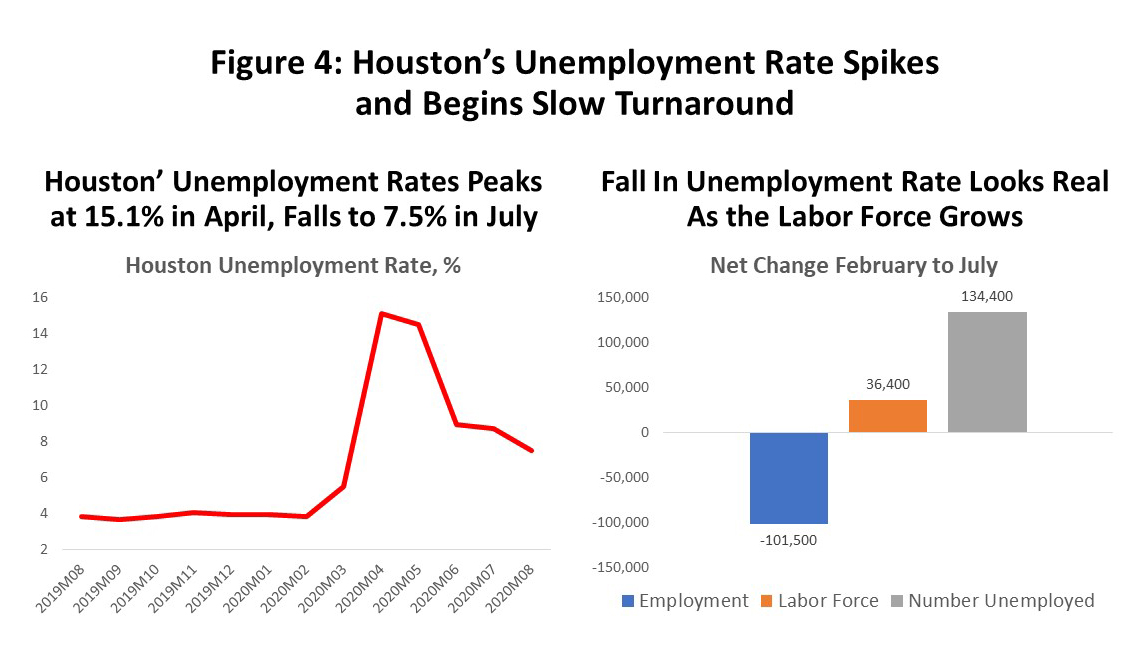
The number of local workers unemployed in August remains 134,400 higher than the February pre-virus level. We can sometimes see an unemployment rate fall for the wrong reason if large numbers of discouraged workers are exiting the labor force. When we count unemployed workers, there are two criteria: they must be out of a job and actively seeking work. If they are not looking for a job, they are not unemployed and are dropped from the labor force calculations. Although the labor force briefly fell by 275,100 jobs from February to April, these losses have now disappeared, and Houston’s August labor force estimate was 36,400 higher than February. This implies no significant problem with local discouraged workers simply not looking for work, and that the big drop in the unemployment rate is probably real.4
The widely watched weekly data on initial and continued claims for unemployment in the U.S. and Texas are shown in Figure 5. An initial claim is filed under the Unemployment Insurance Program after an individual is separated from their employer and requests a determination of eligibility for compensation. Compensation varies by state and the normal period of eligibility is 26 weeks, although times of natural disaster or excessively-high unemployment (like now) can trigger longer periods of eligibility. The claims In Figure 5 include the normal state compensation and disaster/unemployment extensions, but not the extraordinary expansion of coverage under the CARES Act for the self-employed, including gig and contract workers.5
The story in Figure 5 is basically one more COVID-driven event with a March/April spike in claims across the U.S. and Texas, followed by a steady decline as public orders were lifted and the economy re-opened. The Texas bump in the June/July initial claims results from a surge in COVID-19 cases that forced the re-imposition of restrictions on some nonessential businesses.
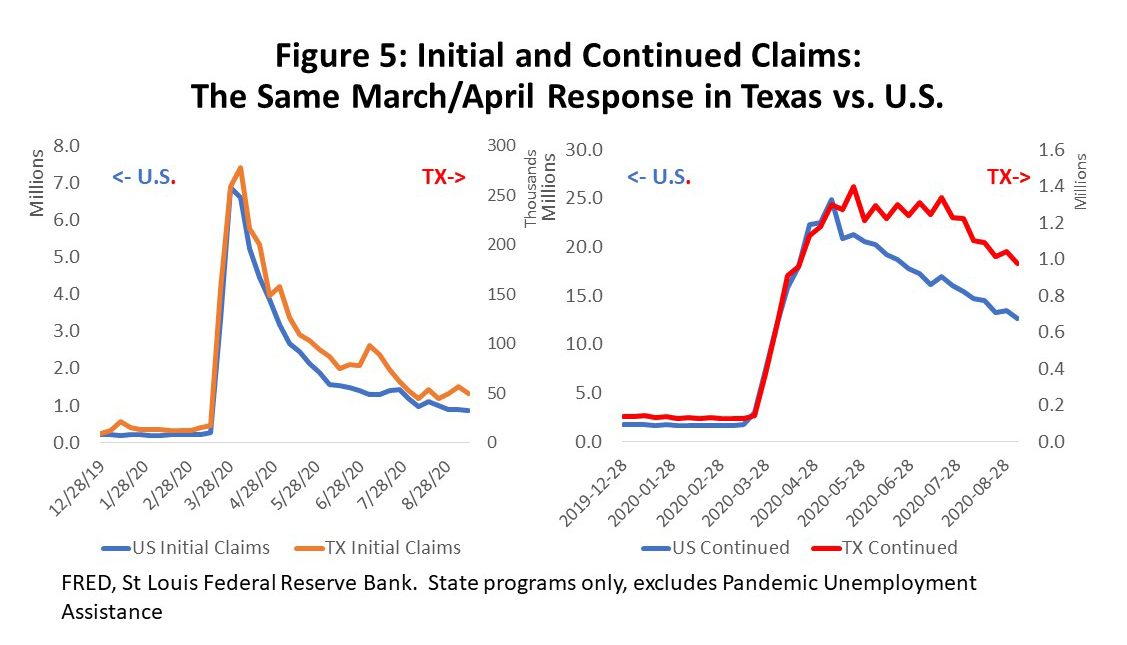
The initial claims data for Texas declined more slowly than the rest of the country after April, and the continued claims fell much later in Texas, only to fall faster since June. It is not clear exactly why this is happening, but it most likely reflects a less stringent definition of nonessential business in Texas and more stringent eligibility for unemployment compensation. For example, we saw U.S. initial claims in March/April reach 20.5 percent of pre-pandemic payrolls, while Texas claims reached only 12.2 percent. The faster and earlier decline in U.S. continued claims probably results from the rest of the U.S. having a steeper and longer runway for unemployment to fall.
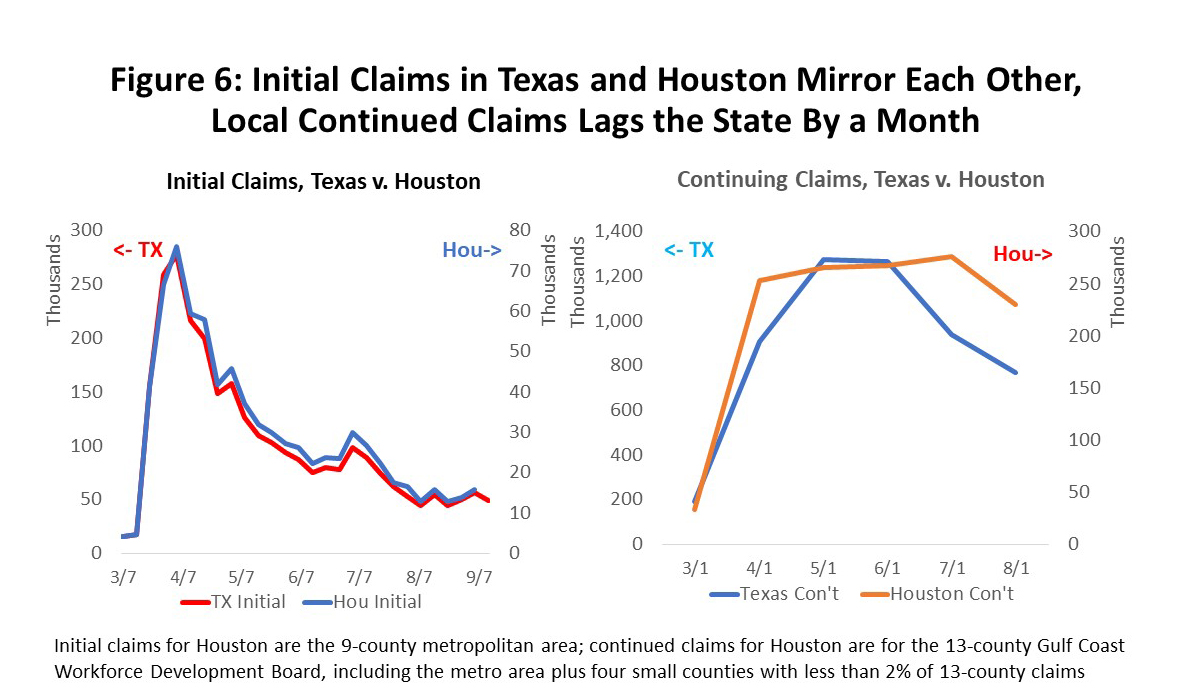
Figure 6 compares Houston initial claims to Texas, with the common COVID factor driving virtually identical results for both areas. Initial claims show signs of slowing and perhaps bottoming out near current levels. Houston data for continued claims is available only monthly and for the more broadly defined Gulf Coast Workforce Development Area that includes the 9-county Houston metro area plus four small counties that make up less that two percent of recent claims. Despite the differences in definition, the bottom line is that Houston and Texas continued claims are almost certainly on a similar path of steady improvement, but with Houston perhaps running a few weeks behind the state.
In contrast to the three months of sluggish to flat payroll employment data, see steady recent improvement in the unemployment rate and falling claims for unemployment. The rate of decline of initial claims has slowed in recent weeks, but continued claims have finally moved onto a path of steady decline that is faster than the rest of the country.
Income
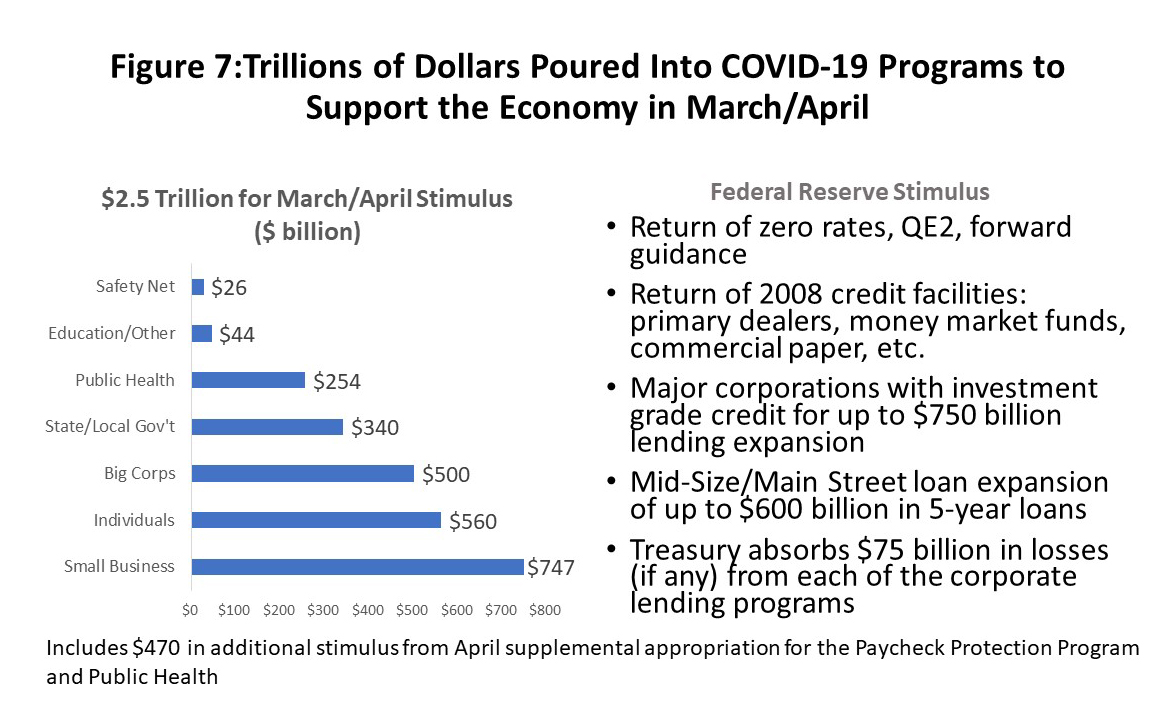
The post-COVID employment data present a frightening economic picture and have become the economic focus of the public and the press. However, when we pull out the personal income data for the same period, it shows rising disposable income, record levels of spending on goods, and personal savings rising by hundreds of billions of dollars. These extra dollars did not reduce the number of people out of work, but they did replace the income they lost in the second quarter – and more. The difference is the $2.5 trillion in fiscal stimulus payments from the federal government and unprecedented monetary stimulus from the Federal Reserve.
The accounting rules for fiscal stimulus payments can seem arcane. Stimulus certainly does not change the short-run employment or unemployment numbers, and because it is not current production it does not count in GDP nor in determining whether a recession is underway. But it matters in personal income, consumer spending, and in saving, and in understanding the current record level of retail sales, and the high levels of current spending on big-ticket items like autos and homes.
The amount and composition of the stimulus is summarized in Figure 7, with $2.5 trillion in fiscal spending listed on the left side of the chart. Just over half the money was funneled directly to individuals or small businesses. Federal Reserve monetary stimulus is seen on the right side of the chart, showing the return of 2008-09 monetary policy with zero interest rates, expansion of the Fed’s balance sheet, and restoration of various credit facilities. However, there is also a commitment by the Fed to lend up to $750 billion to companies that had credit-grade ratings when the virus struck, and another $600 billion in 5-year loans to mid-sized companies.6
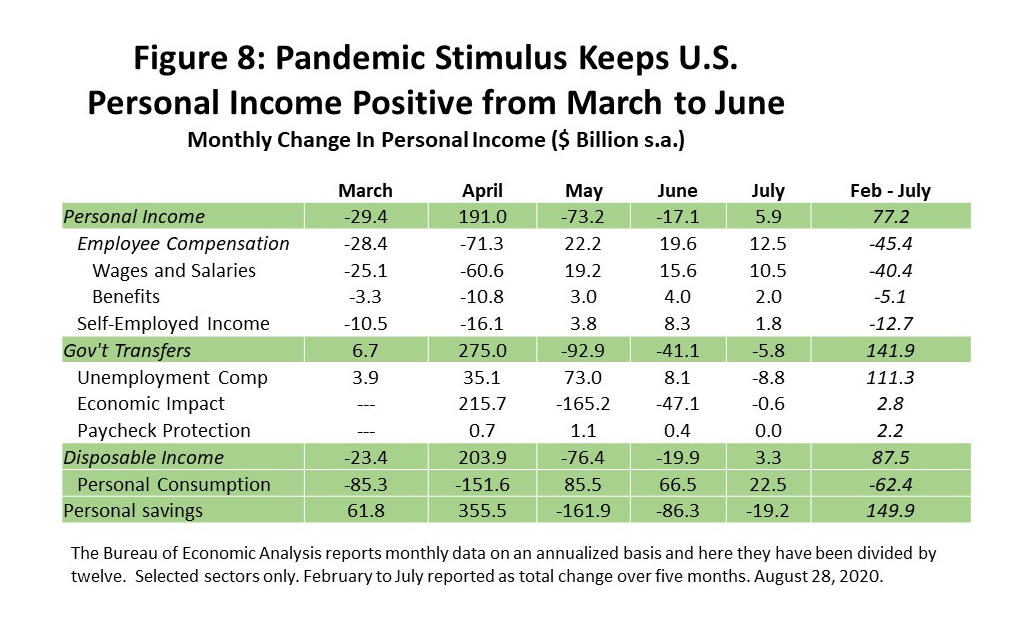
The impact of stimulus payments on personal income is summarized in Figure 8, showing monthly changes for the five months from February to July, as well as the total change over the five-month period. The increase in total personal income from February to July was $77.2 billion, even though employee wages, salaries and benefits fell $45.5 billion and income of the self-employed declined by $5.1 billion.
However, once the lock-down period ended we saw immediate improvements in wages and other compensation, perhaps at rates likely to be self-sustaining but not at a pace nearly fast enough to make up for the March/April losses. Gains in personal income were mostly the product of government transfers, and in particular stimulus payments tied to unemployment compensation, economic impact payments, and benefits of the Payroll Protection Program.
The bottom of Figure 8 shows that over the February/July period disposable, or after-tax income, was up $87.5 billion, consumption spending was down $62.9 billion, and personal savings were up $149.9 billion. Based on current patterns, it seems likely that consumers will soon catch up on spending that last $62.9 billion, as well as whatever else remains in their bank account.
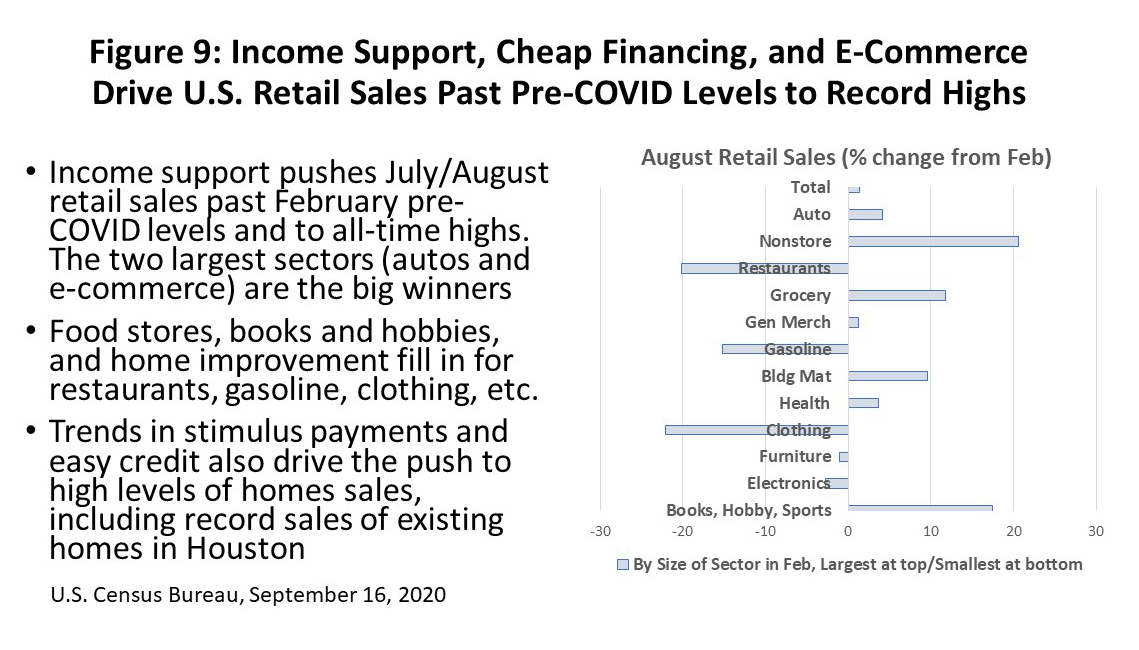
The latest report on nationwide retail sales showed that consumer spending reached pre-pandemic and all-time high levels in July and then rose again in August. Spending has been heavily oriented to goods and away from services and helped the broad definition of retail sales used in Figure 9. The chart shows percentage changes in retail sales between the February peak and August, with specific sectors arranged from largest to smallest by total sales as we move from top to bottom. Big-ticket auto sales had a four percent increase, but most of the gains have been in pandemic-driven sectors like non-store e-commerce, groceries, building materials, and books, hobbies and sports. The biggest declines come in bars and restaurants, gasoline, and clothing.
Probably the biggest current risk to an improving outlook is an abrupt cutoff of further stimulus. The current impasse in Congress over implementation of another round of stimulus and its composition would threaten the current momentum to the economy, though it is unlikely to reverse its positive direction. A widely used analogy at the time the stimulus bill passed was that it was a bridge from COVID-19 to a post-pandemic world. We have now seen most of the economy make it to the other side of the bridge but there is still a need for selective help like payroll protection for food service and airlines or for revenue support to cities and states.
Houston’s Economy Now
It is hard to judge where Houston’s economy stands now or where it is headed. Since March, we have argued that the outcome of the current pandemic for Houston will be a moderate recession once we finish with the gains from stimulus payments and with the wild swings in employment -- down and then up – caused by reactive and mandatory social-distancing. Moderate U.S. recession associated with a severe pandemic was the outcome expected from several studies based on past health emergencies.7
One measure of broad local growth is the Houston Purchasing Managers’ Index shown in Figure 10 and compared to the U.S. index. Index values below 50 indicate contraction and above 50 expansion. The Houston measure has sometimes coincided with U.S. recession (2000-01 U.S. recession, Great Recession) or sometimes gone its own way with help from oil (Asian Financial Crisis, Fracking Bust). The COVID-19 decline was quite short with the U.S. and Houston registering only three consecutive months of contraction but reaching levels nearly as deep as the Great Recession or Fracking Bust.
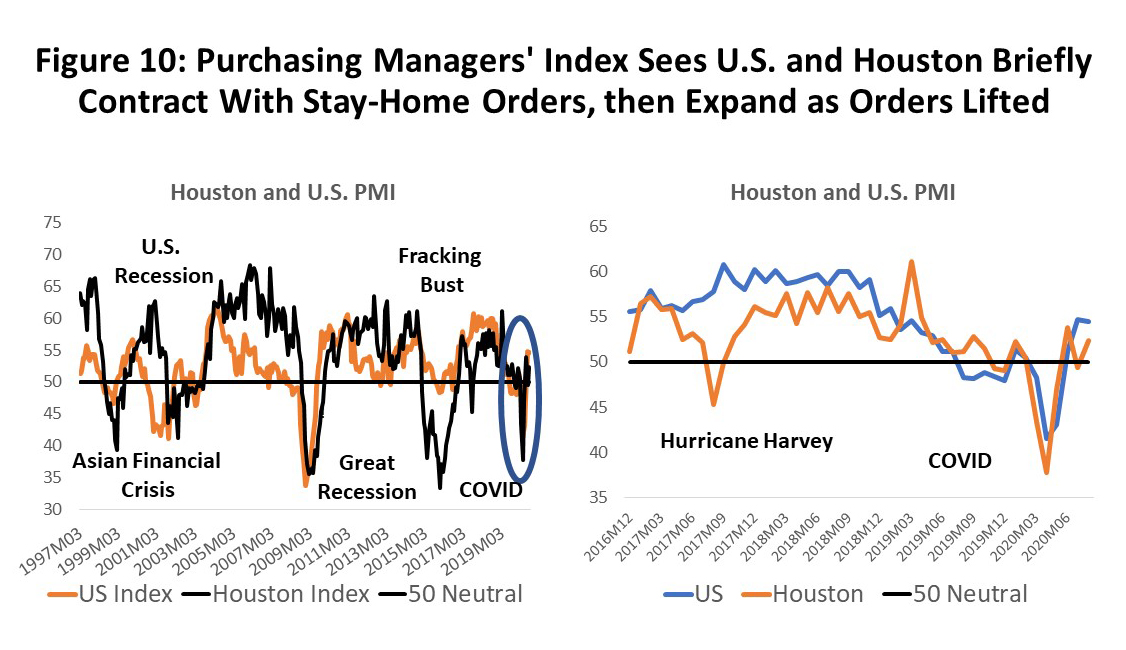
Values below 50 mean recession and a period of contraction, and values above 50 mean the recession is over, implying that the local economy currently sits on a line somewhere between slow growth and contraction. The index tells us nothing about the level of the economy, just its direction, but it suggests that the pattern of recovery seen in the employment data might hold here as well – positive growth but only a partial return to overall pre-pandemic levels.
To find the key drivers of expansion and contraction in a regional economy, economists often look at a select group of sectors that make up the economic base.8 The basic industries are those that export their goods and services to the rest of the state, nation, or world. Exports bring fresh revenue and income into the metro area and stand in contrast to inherently local activities like bars, restaurants, retail, dry cleaners, barbers, or most of health care. While this definition puts a premium on export industries like oil and gas, most of the impact of social-distancing falls on secondary industries with little ability to affect regional growth through multipliers.
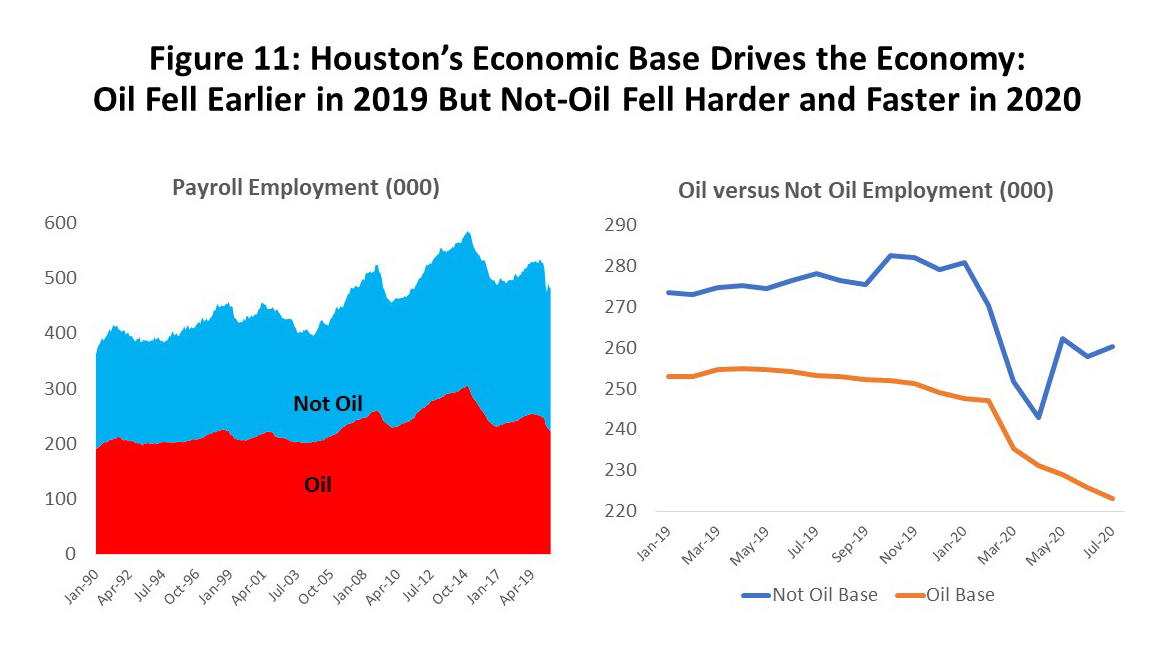
Figure 11 shows that about half of Houston’s economic base historically has stemmed from oil and gas, and the other half is export-oriented industries that depend on the national business cycle. The right side of the chart shows that as the losses driven by COVID and the national economy have stabilized, losses driven by the oil sector continue and have grown to make up more than half of the decline in base jobs through August. The part of local basic activity driven by the U.S. declined steadily and at a rapid rate through May but has stabilized or improved from June to August.
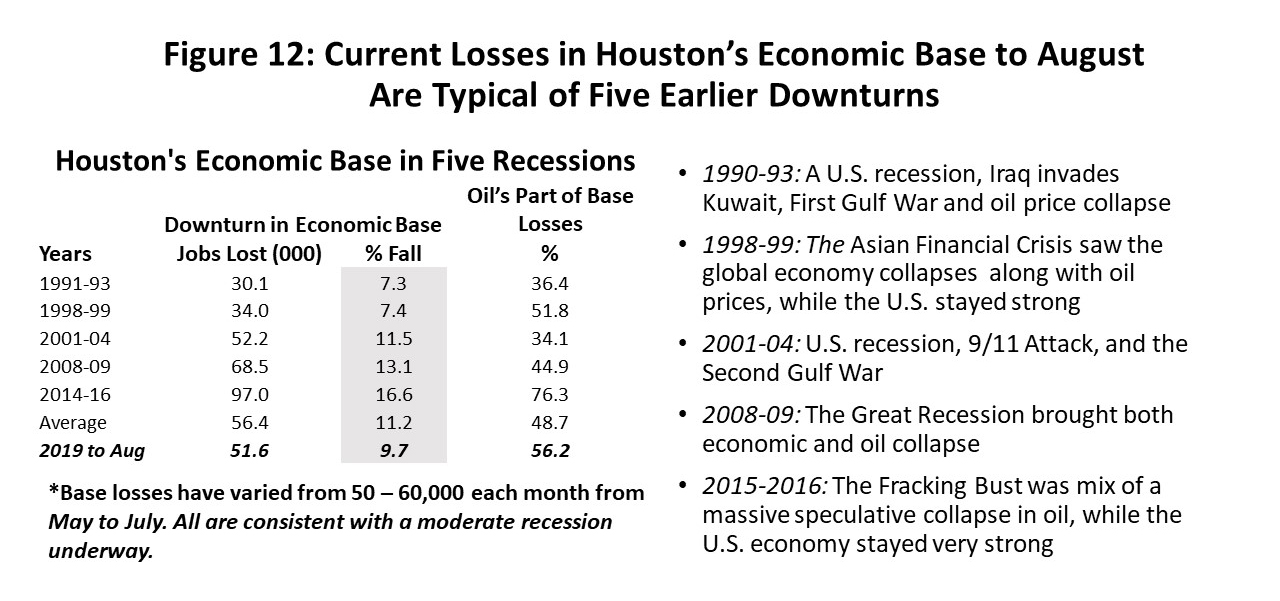
The losses we have seen in Houston’s economic base so far are consistent with a moderate local recession, with its drivers being an average U.S. recession and additional and continuing damage from oil. That oil-related damage has come in every Houston downturn since 1990. For the last five setbacks to basic growth the average loss of jobs in Houston’s base was 56,400 jobs, and through August basic losses total 51,600 or implying a significant but hardly unprecedented recession.
Houston’s Employment Outlook
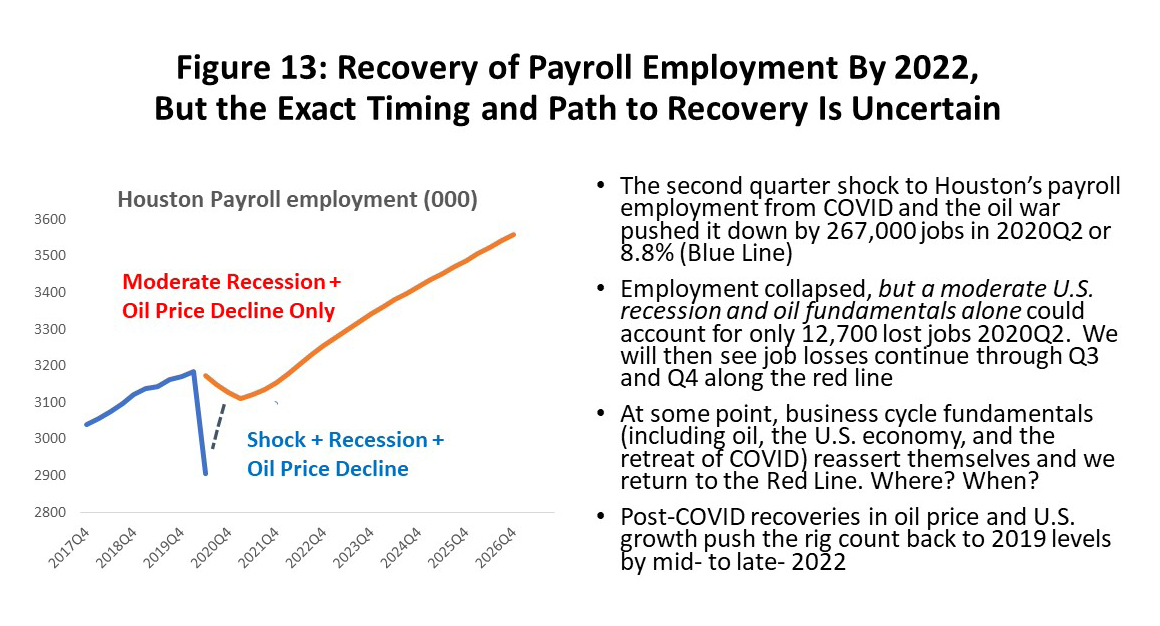
Our dilemma is to build a bridge from the huge jobs losses we saw in April to the idea of a moderate recession. The data cited above on stimulus, personal income, consumer spending, the PMI, and basic employment should blunt the idea that we have somehow entered a new Great Depression. Figure 13 illustrates the problem with the blue line showing what actually happened to Houston payroll employment, and the red line is what would have happened if there had been no COVID shock or stay-home orders – only a moderate U.S. recession accompanied by a sharp but brief decline in oil prices to under $40 per barrel. The difference between the lines in 2020Q2 is COVID shock and the oil war.
We know that at some point in the near future fundamentals will rule again, and the red and blue line will reconnect. But because the economy is left in disequilibrium from the COVID shock and oil collapse, we have no idea how to connect those two lines. And because the coronavirus remains untamed, we do not know when the recession ends and social distancing disappears.
In the face of ignorance, the best we can do is offer a hypothetical example: the U.S. has a recession typical of the last 60 years; there is a 2020-21 recovery in oil prices like that currently forecast by the Department of Energy; in later years the medium price of oil rises to $60 per barrel by 2022Q3 and stays there; we have a high and low scenario where oil rises to $80 or falls to $40 per barrel; COVID is conquered and social distancing disappears in early 2021; economic fundamentals and not the virus are in control after 2021Q1. Figure 14 shows how the data might connect up – red line to blue line – in this case.
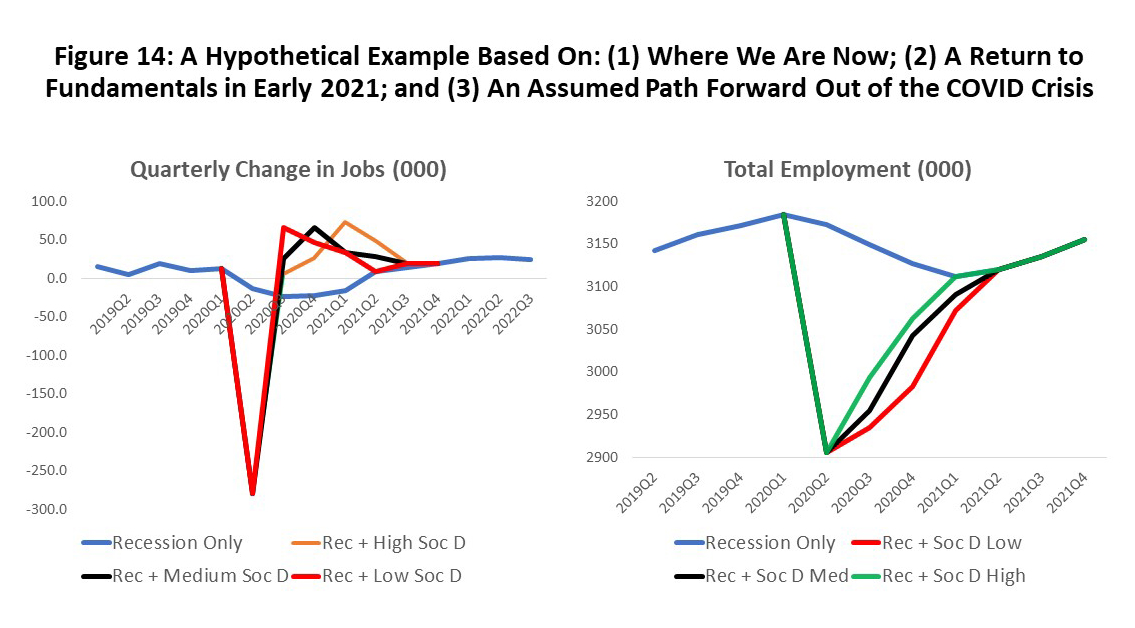
Using all these assumptions, we wind up with a meaningful recession in Houston with four quarters of decline as the downturn bottoms out in 2021Q1 with a loss of 73,000 jobs. It takes another five quarters for local employment to recover to its pre-COVID level, meaning the metropolitan area will have lost nine quarters of steady growth that would have occurred in the absence of COVID-19.
Meanwhile, before the recession ended, we have to total up the losses and recoveries of employment to social distancing and public health orders. Figure 14 shows low, medium and high paths from the blue to red line that are the gains in employment made as the virus is brought under control and social distancing slowly disappears by early 2021.
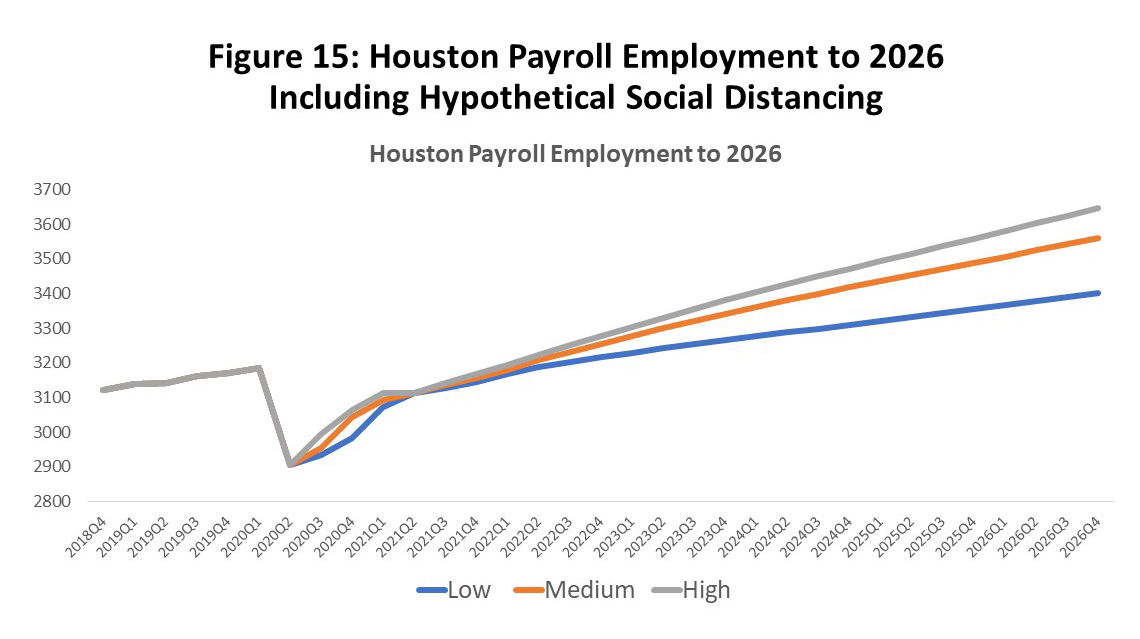
Figure 15 shows the big picture for local payroll employment as we move from the past and into the future. Houston’s base employment is hurt by a COVID-driven U.S. recession in early 2020, and this is combined with additional local damage from local social distancing and public orders that forced the sharp fall in jobs in the second quarter. The assumed recovery in social distancing comes at different rates. The national recovery begins in 2021Q2 and then is joined by higher oil prices in 2022. Houston’s medium outlook returns to growth in 2021 and then accelerates strongly in 2022 as higher oil prices return. The primary difference between low and high forecasts is a sustained price of oil at $40 and $80 per barrel instead of $65.
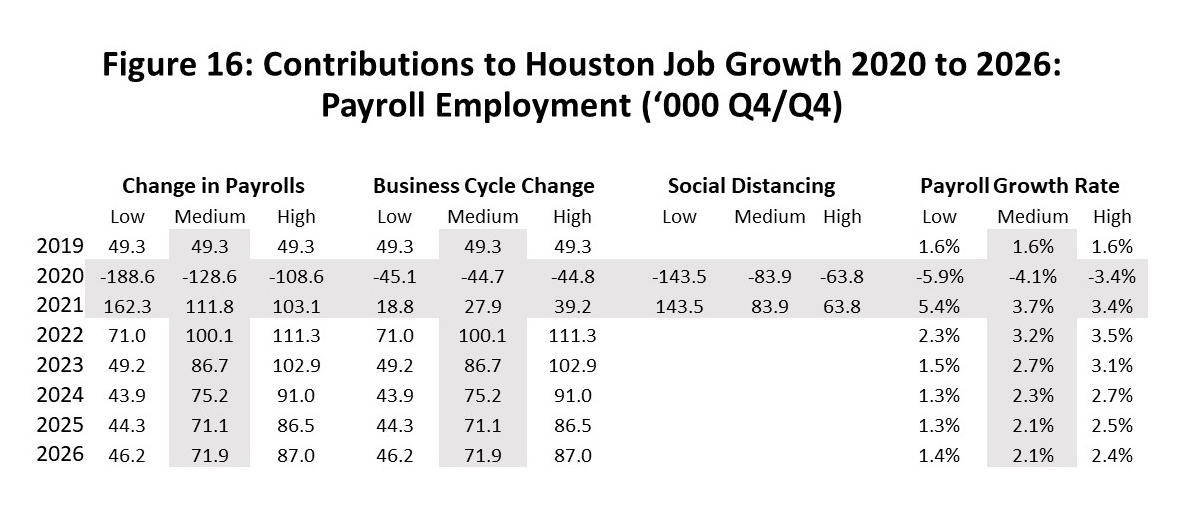
Figure 16 shows the same results but stated as annual changes in payroll employment between the fourth quarter of each year and the prior fourth quarter. The results are divided into (1) the effects on Houston employment of external U.S. business cycle impacts from COVID-19 as the national economy shrinks and recovers and (2) the impact of local social distancing and public health orders in 2020-21. In the medium forecast, by 2024 Houston’s employment growth rate returns to 2.1 percent, or its average growth rate over the last 30 years.
Summary and Conclusions
- The important payroll data tell us Houston’s economy stalled in July and August, after a quick recovery of jobs began in May and June that came on the heels of the March/April lockdown period. So far, only 35.7 percent of the 339,400 jobs lost to reactive and mandatory social distancing in March/April are back. Most of the job losses and virtually all of the bounce back so far has been from sectors like food service, travel, or entertainment that are sensitive to social distancing. Also, part of the recent slowdown resulted from a resurgence of the coronavirus in June and July that forced public health orders to be reimposed in some sectors.
- At least partly reflecting the difficulties that statistical agencies are having in coping with the huge month-to-month swings in data, we get a different answer about Houston’s performance over the summer when we look at the unemployment trends. The unemployment rate paused in July but fell by over a percentage point in August, and both initial and continuing claims for unemployment continued to decline into early September. The claims data clearly show a brief June/July reversal that was related to the return of the virus, but also show unemployment claims quickly returning to a positive path.
- Despite the statistical collection problems, a review of the data on employment, unemployment, personal income, compensation, savings rates, retail spending, the PMI, and the local economic base collectively point to Houston having entered a period of moderate but painful recession early this year. However, the COVID shock is now well behind us, and we can dismiss the fear of this being the dawn of another Great Depression.
- When it was implemented in March, the fiscal and monetary stimulus was often described as a bridge from a COVID to post-COVID world. It appears that most sectors are safely over the bridge now, but selective stimulus is still needed for a few important sectors left behind. The stimulus should include, for example, payroll protection for food service and airlines and perhaps revenue support for states and localities.
- By the first half of next year, Houston seems likely to have come to the end of a moderate recession, with losses of about 73,000 jobs from 2020Q1 to 2021Q1, and this is after the losses to social distancing have ended. Recovering these final jobs and returning employment to pre-COVID levels will take another five quarters.
- The economic recovery in Houston will begin by mid-2021 based on the example we used above, driven first by recovery in the U.S. economy beginning in 2021 and then by rising oil prices in 2022 and 2023. Houston returns to long-run growth of employment near 2.1 percent in 2024 and beyond, its average over the last 30 years.
Written by Dr. Robert W. “Bill” Gilmer
September 22, 2020
University of Houston
C. T. Bauer College of Business
Institute for Regional Forecasting
1 R.W. Gilmer, “Houston’s Outlook Reshaped by COVID-19 and the Oil Collapse: Perspectives on the Economy from the Early Pandemic Data,” and “Oil Picks Up the Pieces After Economic Shock: Recovery Now Begins for Oil Markets and Houston,” August 9, 2020.
2 Almost all of the data shown here is seasonally adjusted either by the Institute for Regional Forecasting or the appropriate statistical agency.
3 Calculation of employment, labor force, and unemployment depends on estimates from a telephone survey of households, as opposed to payroll employment estimated from a monthly sample of businesses. The main difference in coverage is the inclusion of the self-employed in the household survey.
4 The statistical agencies are clearly struggling to cope with the huge current swings in the data by using the tools at hand, which are sampling methods intended for tracking small month-to-month changes For example, from February to August, Figure 4 shows changes in employment, labor force, and the unemployed that were -101,500, 36,400, and 134,000. If we do the same calculations from February to July, these numbers become -261,200, -77,300, and 165,500. The differences are very difficult to reconcile.
5 Workforce Solutions, COVID-19-Related Labor Market Information Updated, September 2, 2020
6 Sometimes called “fallen angel” rules, eligibility for the loans is based on credit before the virus struck and not at the present time.
7 Congressional Budget Office, “A Potential Influenza Pandemic: Possible Macroeconomic Effects and Policy Issues,” revised July 27, 2006; Robert J. Barro, Joanna Weng, and Jose F. Ursúa, The Coronavirus and the Great Influenza Pandemic: Lessons from the "Spanish Flu" for the Coronavirus's Potential Effects on Mortality and Economic Activity, NBER Working Paper 26866, Revised April 2020.
8 Houston’s economic base contains upstream oil (producers, services, machinery, and fabricated metals) and downstream oil (refining, chemicals, and plastics). There are also pipelines, non-oil manufacturing, and selected sectors in construction, professional and business services, wholesale trade and air transportation. Calculations use location quotients for excess employment as drawn from a typical textbook. Also see Scott J. Brown, N. Edward Coulson, and Robert F. Engle, “On the Determination of the Regional Base and Regional Multipliers,” Regional Science and Urban Economics,” (1992), vol. 22, pp. 619-635.