Houston Updates
-
Archive
- June 2025
- March 2025
- December 10, 2024
- September 14, 2024
- May 21, 2024
- March 19, 2024
- December 9, 2023
- June 16, 2023
- April 6, 2023
- March 17, 2023
- Dec. 19, 2022
- Sept. 14, 2022
- July 4, 2022
- March 27, 2022
- March 9, 2022
- September 2021
- April 2021
- March 2021
- September 2020
- August 2020
- June 2020
- April 2020
- March 2020
- January 2020
- December 2018
- June 2018
- March 2018
- February 2018
- January 2018
- September 2017
- September 2017 Post-Hurricane
- June 2017
- March 2017
- January 2017
- September 2016
- March 2016
- December 2015
- September 2015
- June 2015
- March 2015
- December 2014
- June 2014
- March 2014
- November 2013
- September 2013
Houston's 2017 Benchmark Payroll Revisions Bear the Mark of Hurricane Harvey
March 19, 2018
On March 9 the Texas Workforce Commission (TWC) released its annual benchmark revisions for Houston’s payroll employment. Employment releases for the past 12 months have relied on a sample of Houston employers, providing preliminary estimates for total metropolitan employment and for specific industries. Meanwhile, administrative records have accumulated that provide better coverage and improved estimates. Just as they do each March, TWC has incorporated this additional “benchmark” information into its recent Houston estimates. The annual benchmark revisions always include a few surprises.
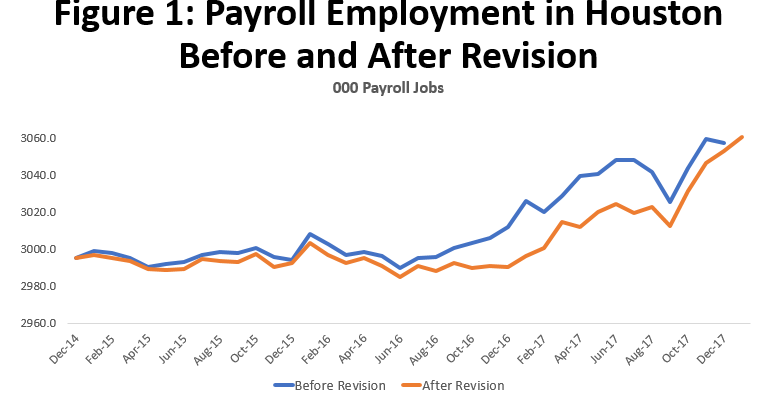
After looking over the revisions, a better title for this article might be “How Houston Grew Faster, Got Smaller, and Not Much Really Changed.” Figure 1 compares the level of total employment in Houston before and after the new revisions.
The most startling aspect of the new data was that total 2017 job growth measured from December to December was revised up from 46,000 to 62,900 jobs. Although careful statistical analysis also bears this out, but Figure 1 shows well enough that the unexpected jump in the number of jobs is largely due to a bigger-than-expected bump from Hurricane Harvey. Through the first eight months of 2017, both lines in Figure 1 were on track to add about 40,000 jobs for the year, but a year-end surge in hurricane-sensitive sectors like retail and construction pushed up the revised number. Without the storm, 30-40,000 jobs would be the right number of new jobs in 2017, and it is likely closer to the lower end of the range.
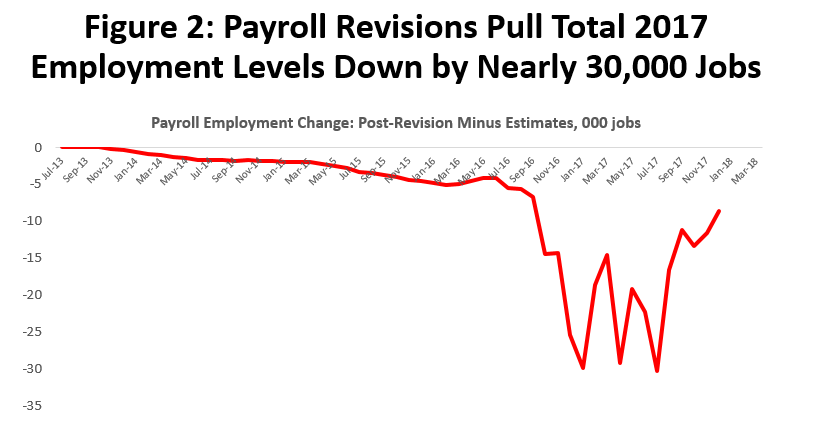
The second feature of the revisions is that Houston got smaller. Figure 2 shows the difference in estimates (post-revision minus pre-revision), and by January 2017 Houston was 29,900 workers smaller than previously measured. This is primarily due to deep cuts in the job numbers in late 2016, as the oil bust lasted longer than previously thought. Not even the one-time Harvey surge could close the gap by the end of 2017.
Finally, apart from Harvey, the picture is little changed. Last year marked a return to growth for Houston, after two years of no growth after oil prices collapsed in 2014. Without the hurricane, however, it was a subpar year with perhaps 30,000 jobs; two percent growth would count as average annual growth over the past two decades, or about 60,000 jobs on today’s base of 3 million workers. Prospects for further growth depend -- as always -- on the fundamentals of the U.S. economy and oil markets. Harvey will become a modest drag on growth as its economic stimulus slowly wanes and then reverses in 2018.
How Big Was the Harvey Effect?
Conventional wisdom among economists is that hurricanes bring only a small change in the economy, either positive or negative. Assume that reasonable flood infrastructure is in place to protect the city; don’t confuse property damage with flows of income and production; don’t mix in broader business cycle effects with lingering effects of storms; and recognize the resilience of market economies everywhere. All this has been explained and documented at length in a previous economic update, and the reader is referred there.1
In the previous analysis we found that when compared to storms in Houston’s economic history, Harvey is having a relatively large and positive economic impact. Not large in the sense of fundamentally altering the course of the economy, but certainly large enough to affect the recent revisions. During the shelter period as a storm approaches, work and production is lost, but then the clean-up from storm damage brings a boom in retail sales and construction. The post-storm gains begin to offset earlier losses, and ultimately may exceed them, possibly making the hurricane a net plus for the economy. The economic update cited previously estimated that the hurricane’s employment effect was a plus 0.65 percent through the end of 2017, or about 20,000 jobs.2 It is a testament to the damage left behind by Harvey that clean-up had such a large net positive effect on a metro area of 6.7 million people.
In Figure 1 the rebenchmarked estimates show a smaller setback in the September shelter period than previously, and a larger surge in jobs through the fourth quarter. After the revisions, and accounting for local growth in Houston driven by the U.S. economy and the local oil industry, new estimate for the Harvey effect through year-end have risen to about 1.1 percent or 36,000 jobs. We can be very sure this number is different from zero, but there is still uncertainty about the exact number. A one standard deviation interval would make the range 25,000 to 47,000 Harvey-driven jobs.
Total payroll employment in Houston – measured December to December -- rose by 63,000 jobs in 2017 according to the TWC’s revised estimates. Subtracting out the one-time 36,000 Harvey-related jobs, this leaves job growth driven only by economic fundamentals at 27,000. Our one-sigma range says it might be anywhere from 16,000 to 38,000. Apart from larger-than-expected Harvey impacts, 2017 job growth was still positive but subdued.3
How does this compare to the IRF forecasts for 2017? The forecasts are on a quarterly basis, and the 2017 Q4/Q4 revision shows 53,700 new payroll jobs with Harvey included, and 29,600 if Harvey is removed. The May IRF forecast (no Harvey) was 35,200, and for November (Harvey included) it was 41,100. Both forecast did well in capturing the fundamentals, but the biggest error in November was to underestimate the net positive economic effects of Hurricane Harvey.
Specific Sectors
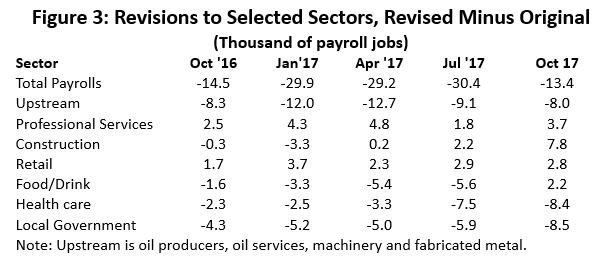
Revisions to specific and selected sectors are shown in Figure 3. The large downward revisions to total employment came in late 2016 and carry through most of 2017. By the fourth quarter of this year, we see upward revisions to Harvey-related impacts that begin to reduce the differences post- and pre-revision.
The big question about 2017 was whether we would see the return of large numbers of oil-related jobs. Upstream oil is defined here as the sum of oil producers, oil services, machinery, and fabricated metals. These downward revisions did not improve on the dismal picture painted by previous estimates. Data now show that by the end of 2016, upstream job losses reached a remarkable 77,400, and that 2017 saw the return of only 6,600 of these jobs.
For all professional services the revisions were small but positive. There were significant downward revisions to employment services and administrative services, and positive revisions to the important professional and scientific sectors.
Year-end gains in hiring by construction, retail, and bars and restaurants likely reflect the Harvey effect at work. Healthcare, with early estimates already showing the effects of a weakened Affordable Healthcare Act, was downgraded even further. Local government was revised down, primarily in local public education. This reflects the effects of public education having finally caught up after frantic expansion in the boom years, and slowing in-migration and population growth that is reducing current needs.
Was It a Recession?
It is remarkable that we should even be asking this question. Given the example of the 1980s oil bust in Houston, when one payroll job in eight disappeared between 1982 and 1987, we might expect the Fracking Bust to bring a significant economic setback. But strength in the U.S. economy, a major boom in petrochemical construction, and momentum from the boom years proved just enough to offset most the job losses in upstream oil.
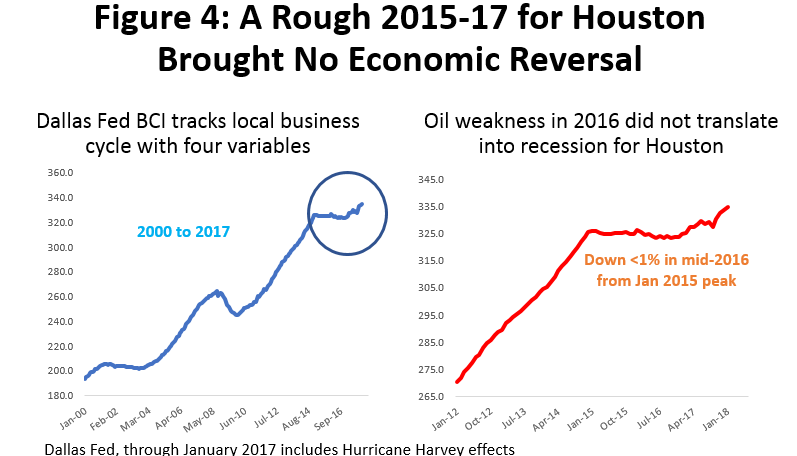
Even after revision, the payroll data show no signs of significant downturn. The downward revisions to payroll employment mostly come in late 2016, and they simply extend a long period of no growth in Houston. They did not make the downturn deeper, and from late 2014 to early 2017 local job growth stayed near zero. However, payroll employment is only one measure of the economy, and other indicators have not fared as well. The Dallas Fed’s Business Cycle Index (BCI) is a broader measure of economic performance, tracking the Houston economy by combining payroll employment with three other measures of the local business cycle -- the unemployment rate, total real wages, and real retail sales. The results are shown in Figure 4.
The BCI declined less than one percent following the collapse in oil prices, peaking in January 2015 and finding a trough in mid-2016. This compares to a 2.0 percent decline in the BCI during the Tech Bust of 2001-03 and 7.3% in the Great Recession. The Tech Bust is usually counted as a recession in Houston, but it was the mildest recession the metro area has experienced since the 1970s. It is unlikely that the Fracking Bust – as serious as it was for the oil industry – can be singled out as a local recession. Give Houston’s economy credit for tremendous resilience in the face of adversity.
Written by:
Robert W. Gilmer, Ph.D.
Institute for Regional Forecasting
March 19, 2018
1R.W. Gilmer, “Harvey in Perspective: The Houston Economy and Hurricanes Past and Present,” Institute for Regional Forecasting, University of Houston, February 2018, https://www.bauer.uh.edu/centers/irf/houston-updates-feb18.php
2See Table 1 in the report.
3It should be noted that fourth quarter Harvey estimates are sample data only. There are not yet any administrative records to support them. The size of the employment impact from Harvey implied by the benchmark revisions is unprecedented going back as far as Hurricane Alicia in 1983. This opens the question of whether the data might not be revised down in the future.