Houston Updates
-
Archive
- June 2025
- March 2025
- December 10, 2024
- September 14, 2024
- May 21, 2024
- March 19, 2024
- December 9, 2023
- June 16, 2023
- April 6, 2023
- March 17, 2023
- Dec. 19, 2022
- Sept. 14, 2022
- July 4, 2022
- March 27, 2022
- March 9, 2022
- September 2021
- April 2021
- March 2021
- September 2020
- August 2020
- June 2020
- April 2020
- March 2020
- January 2020
- December 2018
- June 2018
- March 2018
- February 2018
- January 2018
- September 2017
- September 2017 Post-Hurricane
- June 2017
- March 2017
- January 2017
- September 2016
- March 2016
- December 2015
- September 2015
- June 2015
- March 2015
- December 2014
- June 2014
- March 2014
- November 2013
- September 2013
Recession Ahead?
Financial Markets Challenge the Fed
June 16, 2023
The Houston economic outlook remains unchanged with inflation continuing at high rates, the Federal Reserve maintaining tight monetary policy, and both the US and Houston economies showing numerous cracks around the edges. Meanwhile, a solid core of consumer income and spending remains firm. A forecast of coming economic slowdown or recession remains in place, but the date of the slowdown has been postponed several times by sustained consumer strength.
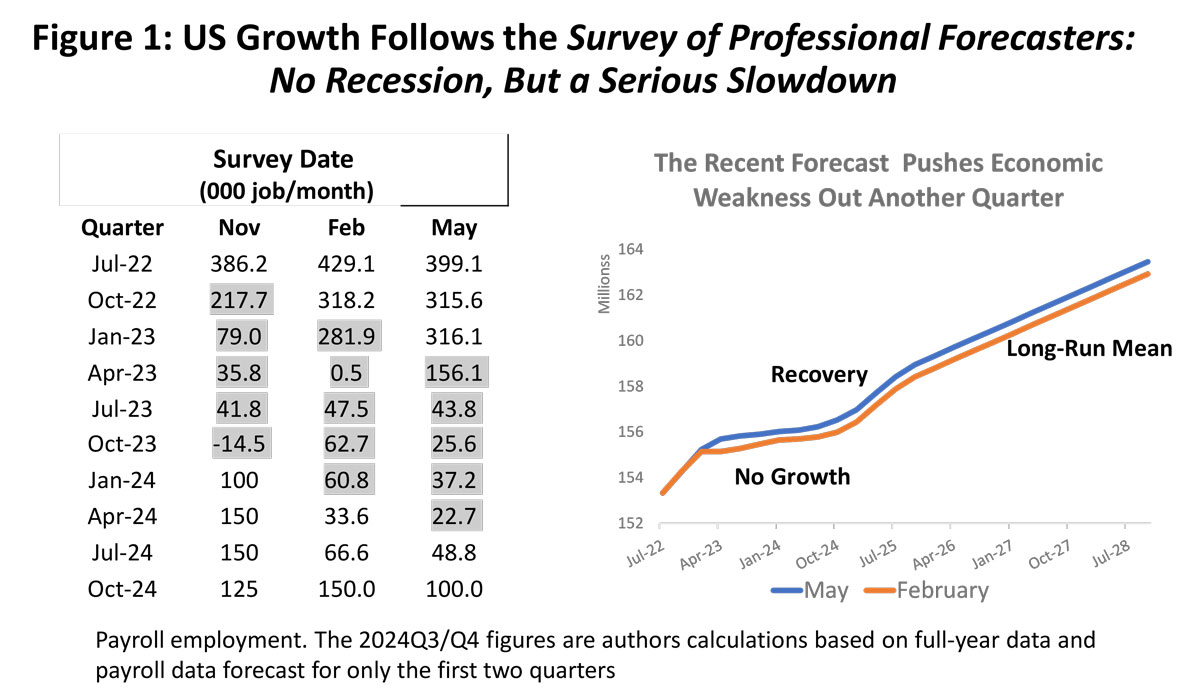
The Survey of Professional Forecasters (SPF) has been carried out quarterly since 1968. It is now conducted by the Philadelphia Fed and is the oldest continuing US macroeconomic forecast. Figure 1 shows the results of the last three releases of the Survey in November, February, and May. None show a recession, but all show a serious slowdown in economic growth that brings the US economy to a near standstill. The numbers on the left side of Figure 1 are quarterly changes in payroll employment but stated as monthly average changes. For example, in the decade-long expansion leading to 2019Q4, the US economy added 193,000 jobs per month, while the latest May forecast shows only 32,300 jobs per month through four quarters beginning this summer.
Following the recent return of huge numbers of post-pandemic jobs, the 79,000 jobs per month forecast by SPF in November of last year marked the first SPF projection of significant economic slowing, followed by a sharper pullback in 2023 and recovery in 2024. These expectations were postponed in February and again in May. In the current May forecast, the first signs of economic trouble comes this summer with weakness that now is expected to persist through most of 2024. There is still no recession in the outlook, just a long period of very slow growth.
The right side of Figure 1 illustrates how the May forecast has essentially postposed the November slowdown by a couple of quarters, allowing it to begin from a higher level and turn into a longer downturn and later recovery. A return to trend growth of 125,000 jobs per month is assumed in both cases.1
The current forecast now sees this slowdown as right on top of us. The rule of thumb is that 12 to 18 unpredictable months are needed for monetary policy to begin its work, and we just passed the 12-month mark on March 22. The March outbreak of banking problems – banking is the most highly leveraged of financial institutions — likely was an early signal of deeper economic problems to come. The interest-rate sensitive housing sector was also an early victim of rising rates. Manufacturing and wholesale trade have been in contraction since last year. The large household sector is holding out against recession, and it is now the chief target of the Fed’s anti-inflation campaign.
Based on the US outlook, Houston will soon see a period of slow growth that continues through much of next year. Houston’s interest-rate-sensitive sectors and manufacturing are showing negative results similar to the US. Unlike the US, however, April employment in Houston turned down by a few thousand jobs and growth in local payrolls slowed sharply over the first four months of this year. Other measures of spending and unemployment still look strong, however.
The End of COVID Stimulus ... And How the Consumer Keeps Spending
The COVID pandemic is over, but the consequences of the policy measures taken to fight it remain central to the US outlook. The key economic problem in today’s economy is inflation, with the CPI breaking out of its two-percent range in March 2021 – closely on the heels of the second and third rounds of fiscal stimulus. Headline inflation reached 8.2 percent only 12 months later.
But the fiscal payments simply planted the seeds for coming inflation, while the Federal Reserve carefully nurtured this garden with interest rates held too low and for too long. Zero interest rates were maintained through 2021 while the Fed attributed the early inflation breakout to supply-chain issues. A tremendous financial boom ensued through 2020-21 that used this environment to add as much as $15 trillion to household balance sheets before the Fed reacted and began to tighten monetary policy in early 2022.
The fiscal stimulus came in two waves of $2.5 trillion dollars each, first in early 2020 during the lockdowns, then followed by two smaller rounds in late 2020 and early 2021 that together totaled another $2.5 trillion. Two and a half trillion dollars was about $16,800 per US household in 2020, and each round saw perhaps half of that cash flow to individuals directly or indirectly — but quickly and as needed. Most went into the bank accounts of individuals and businesses through economic impact payments, the paycheck protection program, and enhanced unemployment checks.
In Figure 2, the solid blue line shows the pandemic-period track of total personal income (including stimulus), and the solid red line is the wages, salaries, and income of the self-employed (no stimulus). Each point compares these measures to pre-pandemic levels in February 2020. The initial round of stimulus came against a backdrop of consumer shock and lockdowns, along with a ten percent drop in wages and salaries that was immediately matched by a ten percent jump in stimulus-driven personal income. These cash payments appeared to quickly right the economic ship by mid-2020 by offsetting wage losses and delivering record levels of income. Pre-pandemic levels of wages and salaries were fully restored by November 2020.
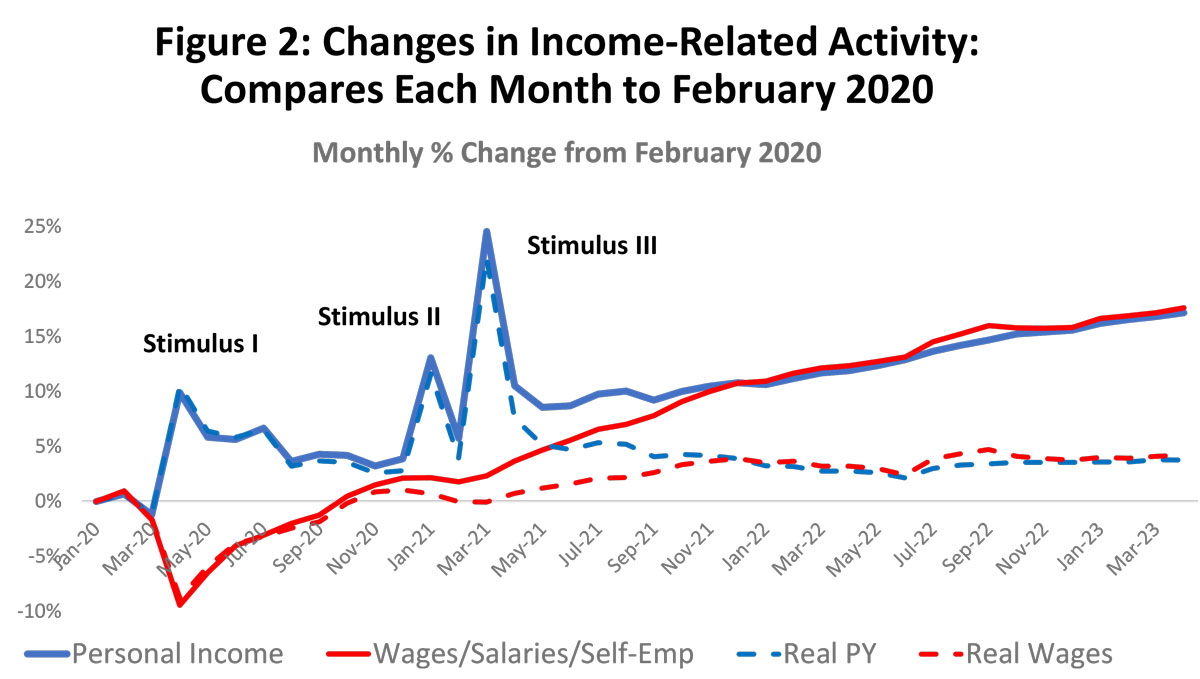
Figure 2 also shows us an economy that is now expanding on its own. The red line for wages and salaries has been growing rapidly since late 2020 and now stands 17.6 percent above pre-COVID levels. The blue personal income line has slowed as the stimulus recedes, although it is now being carried forward nicely by wages and salary growth at 17.2 percent above pre-COVID levels. However, the gains are much less impressive if inflation is removed as shown by the broken lines. Personal income is then up only 5.6 percent over three-plus years and wages and salaries up only 5.5 percent, or at annual rates of 1.2 and 1.3 percent per year since the lockdowns.
After the impact payments had been sent out to individuals, the major features of pandemic spending were the paycheck protection program and enhanced unemployment compensation. In April 2021 these programs were running at annualized rates of $763 billion, but by January 2022 all of the major programs were rapidly winding down and had largely ended.
How do spending and allocations stay high with stimulus payments now ended? A key part of the story for consumers was that the pandemic stimulus was not all spent, and much was saved. “Savings” as defined by the National Income and Product Accounts is simply the difference between after-tax personal income and outlays on goods and services. Using 8.9 percent of after-tax income as a decades-long average of past consumer savings rates, Figure 3 shows that actual savings rates were far higher than normal throughout much of the pandemic. The savings rate finally slipped below 8.9 percent throughout last year and has since fallen to low levels near three percent.
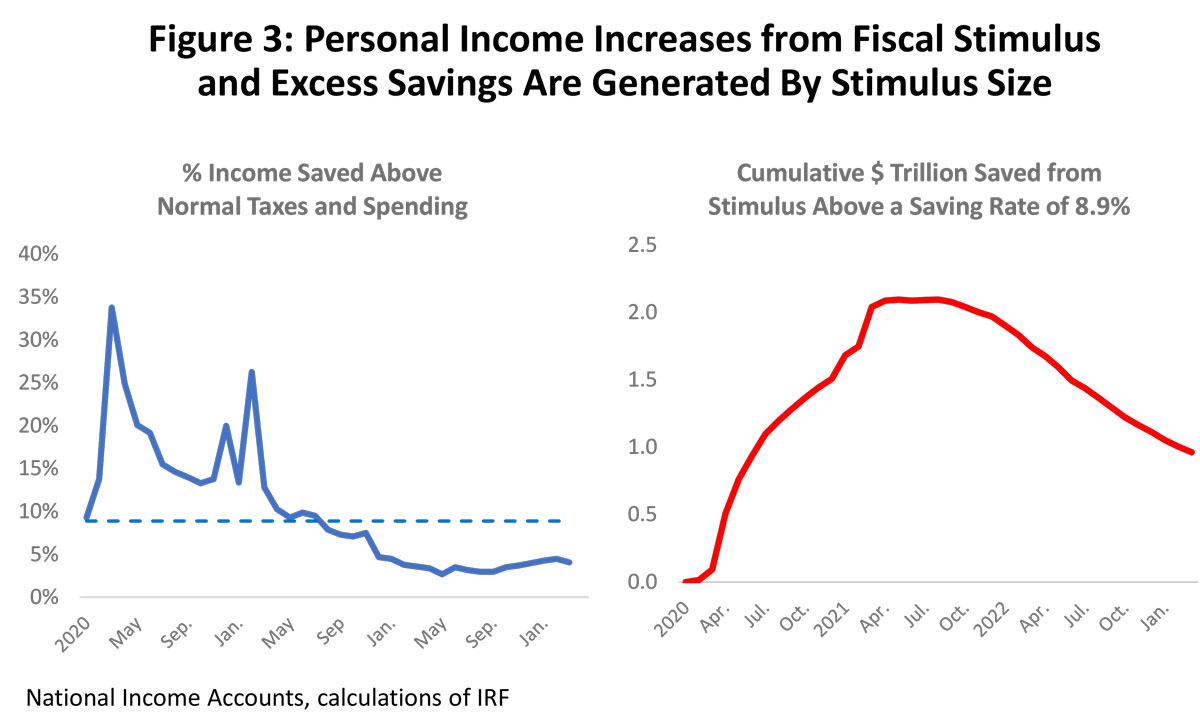
The right side of Figure 3 shows that these pandemic-period savings cumulated into a huge amount of cash, with “excess” savings above the 8.9% mark reaching $2.1 trillion in September of 2021, and are still hovering around $0.9 trillion this April. We will see how these numbers compare to recent changes in the overall household sector balance sheet below.
You must be careful with the definition of savings, however. It includes any part of after-tax income that is not spent on goods and services, and the simple identity between savings and investments suggest the myriad of ways for “savings” to be spent on assets in place of goods. New homes, existing homes, or consumer durables would be in this definition of savings turned into investment, along with financial assets like stocks and bonds. Stocks and bonds might be relatively liquid, or they might have gone to a 401(k) where they are subject to penalty withdrawals, or maybe they were just lost to the current financial downturn, or to meme stocks, crypto, or other regrettable investments. While much of this saving goes to illiquid assets, the liquid component held by households – as we will see — remains quite large, and the amount is important because it is the dry powder that drives consumer spending.
Household Riches … Financial Markets Defy the Fed
In fact, these pandemic assets quickly merge into a much larger picture of general household financial improvement in Figure 4, after being helped along by loose monetary policy and the financial boom that followed. The direct fiscal spending in Figure 2 was simply the starting point for a tremendous expansion of household assets in late 2020 and 2021.
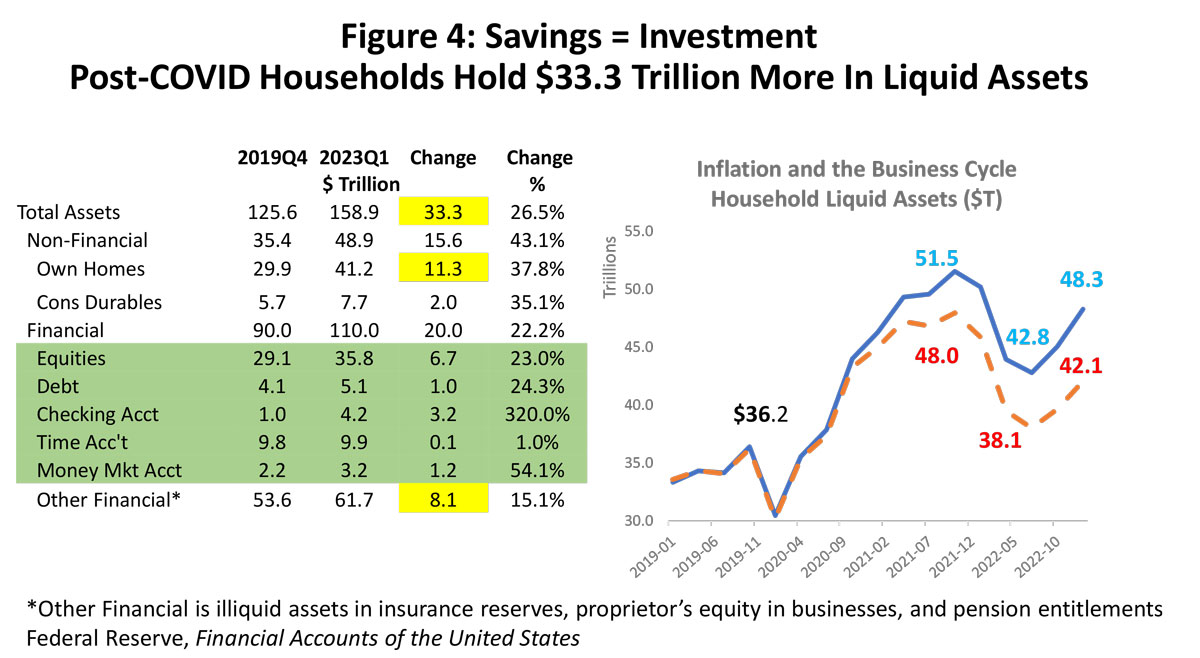
This combination of fiscal spending, low rates, and a financial boom saw total household assets in the US rise from $125.6 trillion dollars in 2019Q4 to 158.9 trillion in 2023Q1, an increase of $33.3 trillion or 26.5%. See Figure 4. About half of these gains in assets are illiquid and nonfinancial – unlikely to be easily cashed in for buying food or clothing – such as purchases of homes and consumer durables. Or they can be illiquid financial assets such as pension entitlements or insurance reserves.
However, there was also an increase in household liquid financial assets of $11.9 trillion in the form of equities, debt instruments like bonds, or bank accounts that left the consumer flush with cash or access to cash. However, with this larger financial perspective on assets comes more ways for the same money to rapidly disappear. Consumer spending would be the slowest way to see these liquid assets used up and could take years of spending for that to happen, but inflation and declining financial markets can do the job quickly.
For example, along the broken red line in Figure 4, we see that liquid assets fell back from a peak of $51.5 trillion in 2021Q4 to $42.8 trillion by 2022Q3 after the Fed raised rates and pushed financial markets down. However, with inflation at work we see a decline in real assets from a peak of $48.0 to a trough of $38.0 trillion. After accounting for inflation, the previous financial gain of $11.8 trillion from pre-Covid to today is reduced to $5.9 trillion.
| Liquid Financial Assets Held By Household: Pre-Covid to Current | |||||
|
With/Without Adjustment for Inflation |
|||||
|
$ Trillion |
$ Trillion $2020 |
||||
|
Date |
W/Inflation |
Change |
No Inflation |
Change |
|
|
Pre-COVID |
2019Q4 |
$36.4 |
$0.0 |
$36.2 |
$0.0 |
|
Peak |
2021Q4 |
$51.5 |
$15.1 |
$48.0 |
$11.8 |
|
Trough |
2023Q3 |
$42.8 |
$6.4 |
$38.1 |
$1.8 |
|
Current |
2023Q1 |
$48.3 |
$11.9 |
$42.1 |
$5.9 |
The table above better clarifies events. It shows the pre-Covid level of household liquid assets, the following peak in 2021Q4, the trough two quarters later, then a turn around in financial markets that adds back a good part of the previous losses. The changes are from the pre-Covid levels of assets, and results are shown for continued inflation and without. After allowing for inflation note that after the first nine months of the Fed raising rates, only $1.8 trillion more assets were being held than before the pandemic.
However, over the last two quarters financial markets have pushed real liquid assets back up to $5.9 trillion above their pre-Covid values. Almost all of these recent gains have come from an increase in debt securities ($1.3 T) and equities ($2.7 T). The increase in equity holdings, in particular, is a direct challenge to the Fed’s ability to produce a meaningful slowdown or recession.
This $1.8 trillion could be easily eliminated by a 5 percent decline in household equity holdings or another 8 months of inflation. Given we should begin counting months from the end of March, and that inflation, shaky markets, and consumer spending are all on-going, the consumer’s riches could soon be easily exhausted. However, $5.9 trillion raises the challenge: Now it is a 15 percent equity decline, or two-plus years of five percent inflation, or a combination of the two helped out by consumer spending. What looked like an easy path to consumer vulnerability a few months ago has been substantially complicated by the financial markets.
The US Economy Still Propped Up by the Consumer
The clearest signs of any emerging problem in the US economy have come so far in sectors most sensitive to interest rates, particularly housing and banking. More generally, the National Bureau of Economic Research is the semi-official referee of whether the US economy is in recession, and Figure 5 lists key measures it uses to determine this: manufacturing, trade, income, spending, and employment.
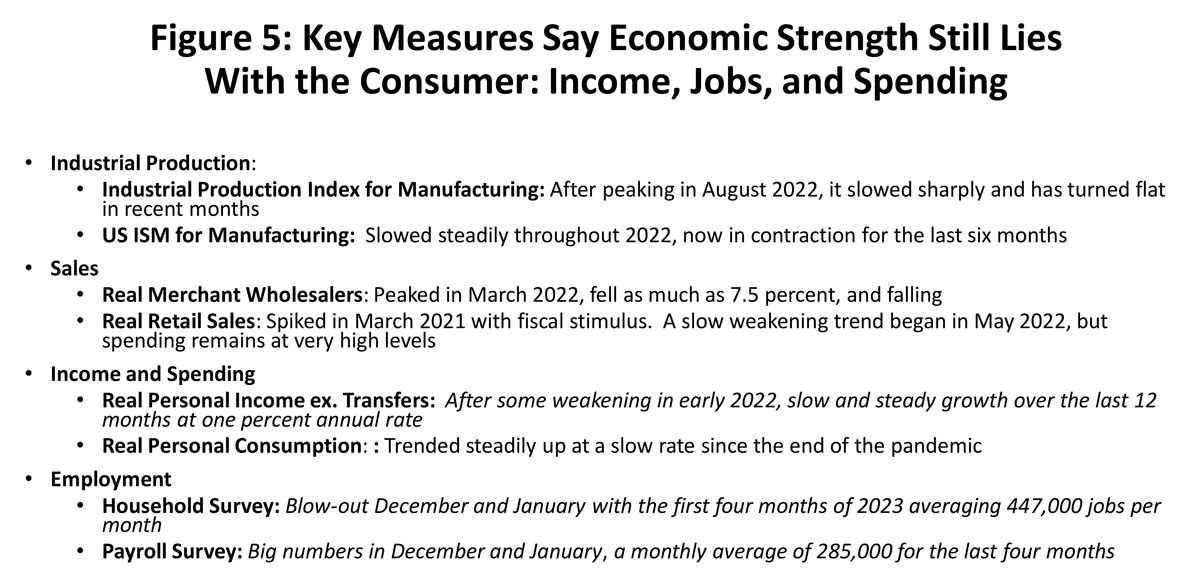
The manufacturing sector is likely in recession, with the manufacturing part of the index of industrial production peaking in August 2022, declining sharply, and then turning flat in recent months. The US manufacturing index published by the Institute of Supply Management shows the sector to be in contraction for the last six months with conditions getting worse. As a result, real wholesale trade followed manufacturing into decline after peaking as soon as the Fed began to raise interest rates. Sales have now fallen 7.5 percent.
All of our other measures are geared to the 80 percent of US growth driven by the consumer: real retail sales, personal income, consumption, and employment. Once a picture of consummate strength, the consumer looks increasingly like a highwire act with these measures — except employment – just holding steady or growing slowly from high levels. Employment remains strong, however, with payroll employment up 314,000 jobs per month through May of this year.
Retail sales in Figure 6 illustrate one of the household’s high wire acts, with the chart showing US retail sales in billions of dollars per month. The first round of stimulus in 2020 quickly pulled sales that had collapsed in the lockdowns back to pre-pandemic levels, but the second and third rounds pushed sales up sharply and past record levels by $71.2 billion per month or by 15.1%. The blue line is not adjusted for inflation and shows continued rapid retail growth in nominal dollars, while the red line is adjusted for inflation and shows no meaningful spending growth over the last two years. However, if real dollar retail sales have moved sideways, the consumer has kept spending at levels well above pre-pandemic activity. Slow inflation-adjusted growth from high levels is also a hallmark of personal income and consumption. Look back at Figure 2.
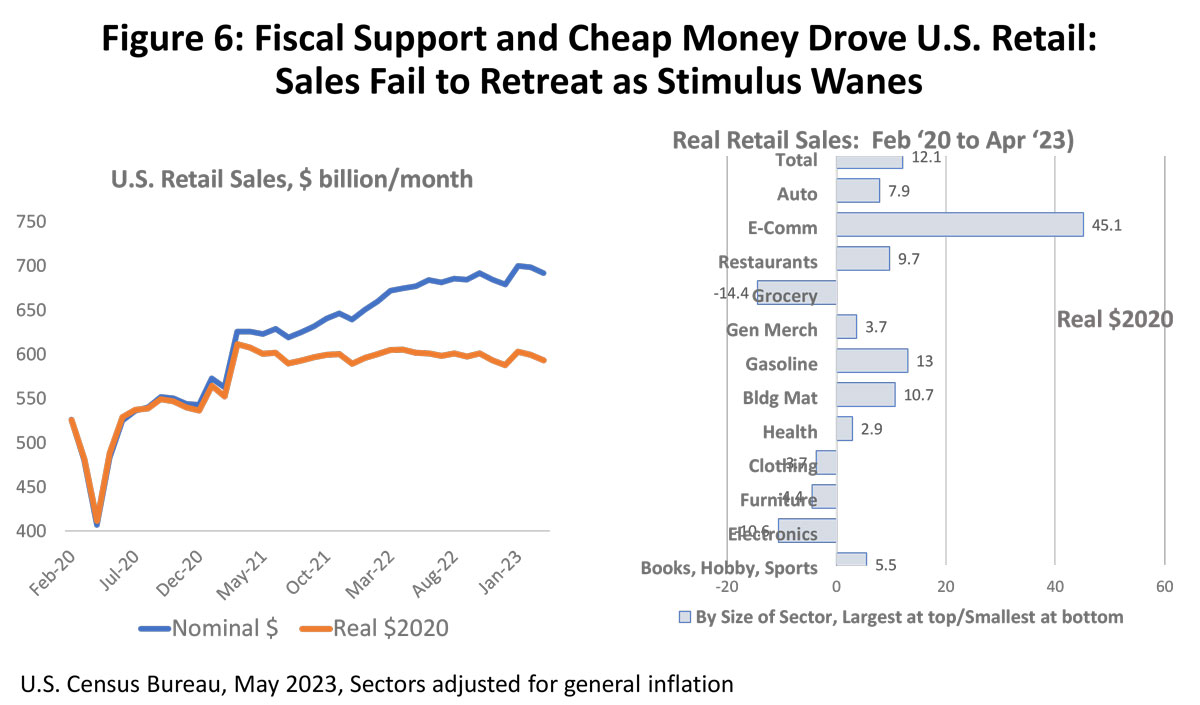
The household’s cache of excess savings and balance sheet gains from the 2020-21 financial boom are dwindling as quickly as we would have expected due to over-performance by financial markets, and their recent large balance sheet gains pose a barrier to any quick end to consumer strength. At the same time, outside of continued strong job gains there is little momentum to prevent a sharp slowdown or a much harder fall from that highwire.
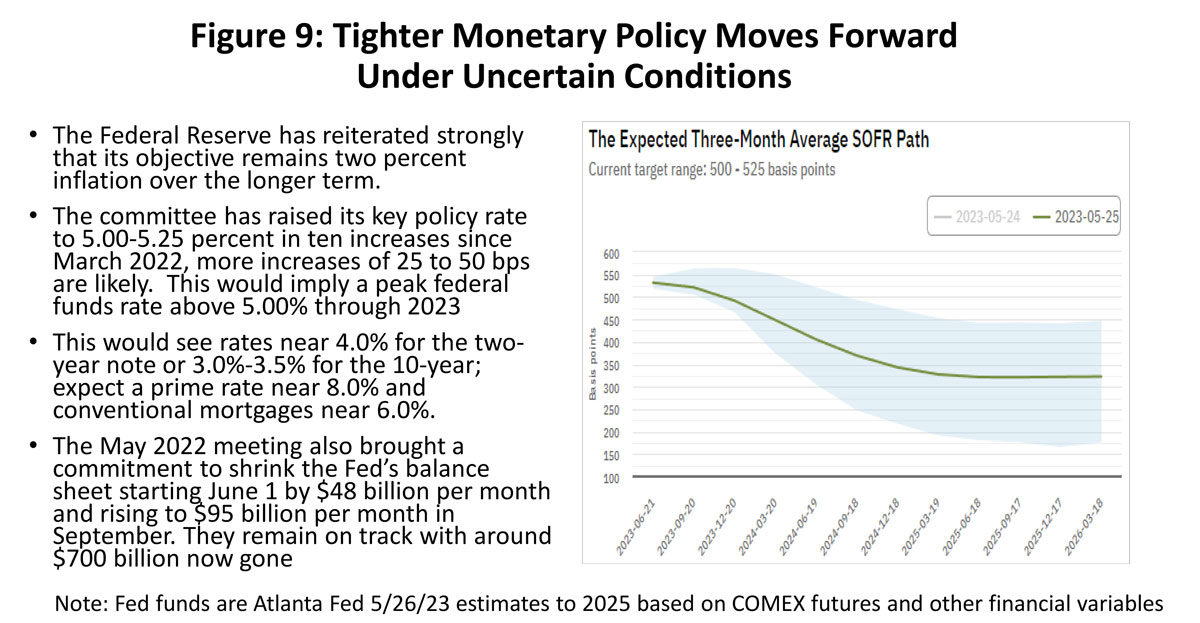
The Federal Reserve Still Has Work to Do
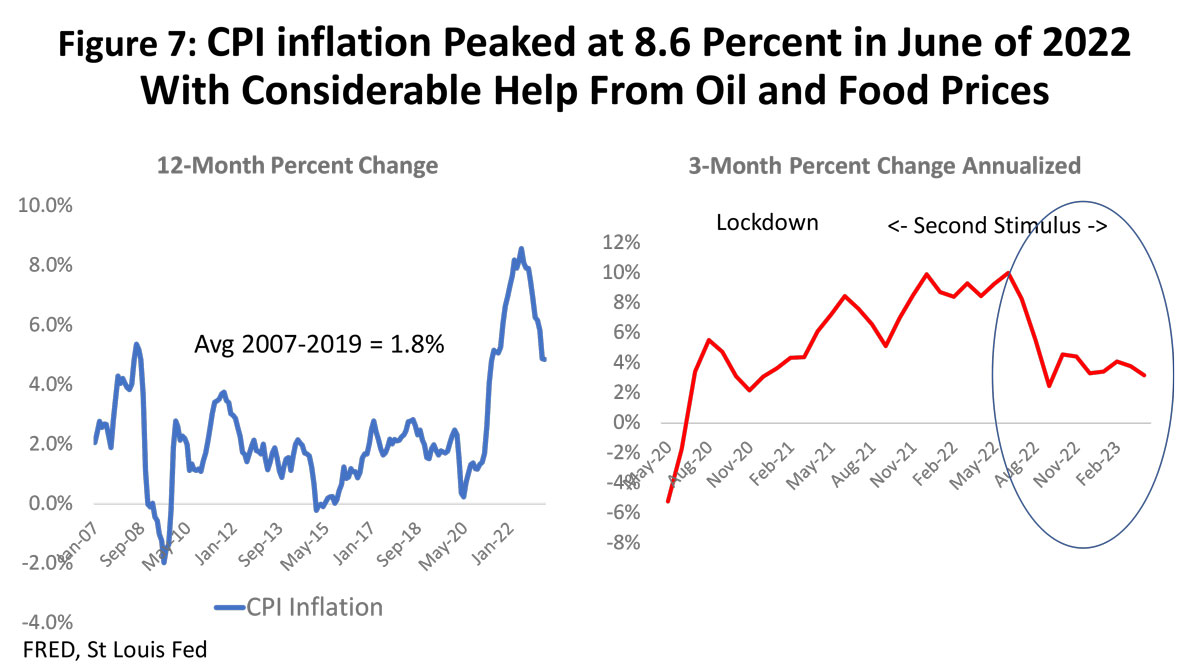
The recent outbreak of inflation began in earnest in early 2021. After 15 years of the Federal Reserve not being able to push inflation high enough to meet its 2.0 percent price target, just 15 months later CPI inflation was peaking at 8.6 percent based on 12-month annual changes. Rising oil and food prices following Russia’s invasion of Ukraine contributed strongly both to the CPI peak and the fall to 4.8 percent. On the basis of 3-month changes the CPI has recently been running in recent months at a 3.0-3.5 percent annualized rate. (Figure 7)
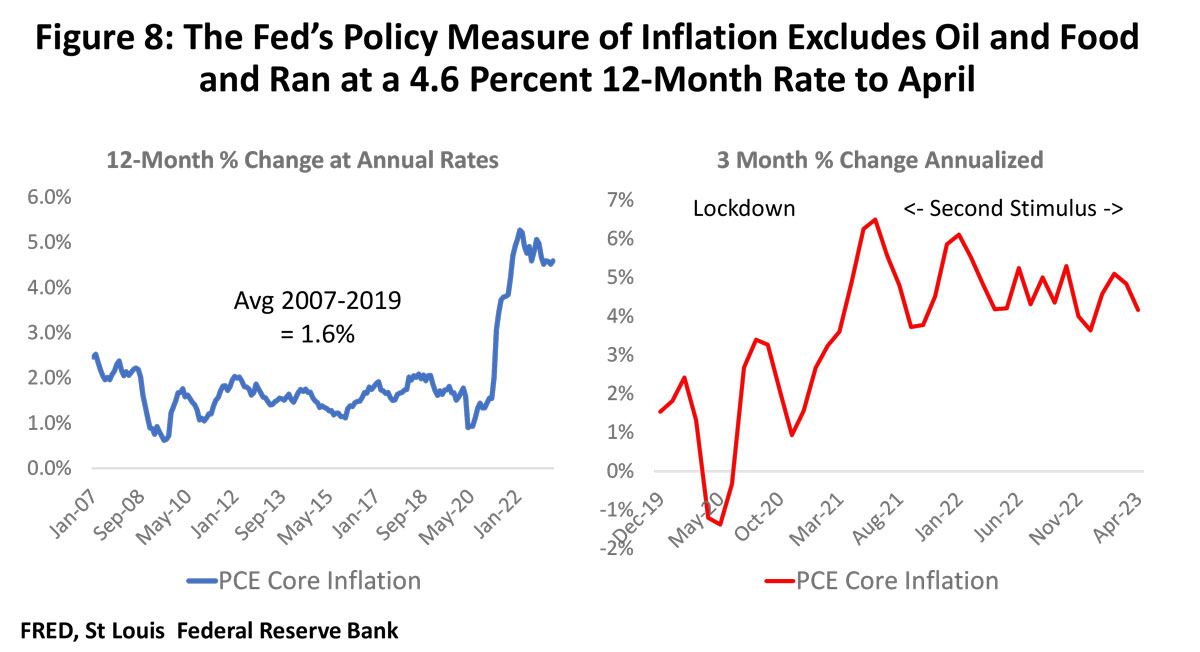
For policy purposes, however, the Federal Reserve uses another measure of price change and inflation. It turns to the personal consumption expenditure (PCE) deflator from the national income accounts, with a methodology more trustworthy than the CPI. Alan Greenspan — and many others — have called the CPI a “deeply flawed” measure of price change. Further, the Fed excludes volatile oil and food prices from its price calculations because oil markets and crop failure are well out of the Fed’s span of control.
Figure 8 shows the core PCE at work. Like the CPI, for 15 years it failed to meet the two percent Fed target, and the PCE breakout and inflation peak was timed much like the CPI. However, the Fed’s core PCE saw peak prices rise to only 5.2 percent or three percent below the CPI peak. While these lower prices are of little comfort to the consumer who lives with the reality of recent food and gasoline inflation this is the measure the Fed watches closely for purposes of steering monetary policy.
The most concerning fact about the core PCE right now is that the Fed has made very limited progress in bringing inflation down. Based on the 12-month changes in the left side of Figure 8, prices have fallen from the 5.2 percent peak to 4.6 percent, and using 3-month changes (right side), the April data show a fall to an annualized 4.2 percent. Even after 10 consecutive rate increases that pushed the federal funds rate above 5 percent, consumer spending remains relatively strong and inflation well above the target range.
Can the Fed break the back of consumer spending, slow the economy, and bring inflation down? They certainly have the tools, and the only question is whether they have the political will. They tried a timid campaign to restore a positive policy rate from 2016-2019, slowly raising rates from 0.5 to 2.5 percent from 2016 to 2019, but then quickly cut rates in early 2019 at the first signs of economic weakness. Then came the pandemic, the restoration of zero interest rates, and a decision holding these rates at the zero bound for far too long.
Embarrassed by this recent record, personal legacies and professional reputations are at stake. I think the Fed is now prepared to do what is necessary to bring inflation down to a two percent target. Based on current data, this would imply that the Fed will plow ahead with further rate increases until the household sector has clearly cracked and then hold rates high until inflation is definitively broken. They have repeatedly stated this goal and that it will mean no rate cuts in 2023. If the Fed chooses, controlling inflation should be a matter of when … not if.
However, the markets apparently don’t believe the Fed’s scenario based on its past weak behavior. While they accept the economy may soon weaken, they also think that at the first sign of weakness the Fed will quickly begin cutting rates. The chart in Figure 9 shows an Atlanta Fed forecast of the federal funds rate based on the COMEX futures market and international swaps. First, note that expectations are for a series of rate cuts beginning in the middle of this year, completely counter to public statements. Second, note that even by 2025 rates remain high and near 3.0 percent. We can hope this marks the end of zero rates, the restoration of a positive policy rate, and that it reflects two percent inflation plus one percent real.
Houston Moves Through the Pandemic
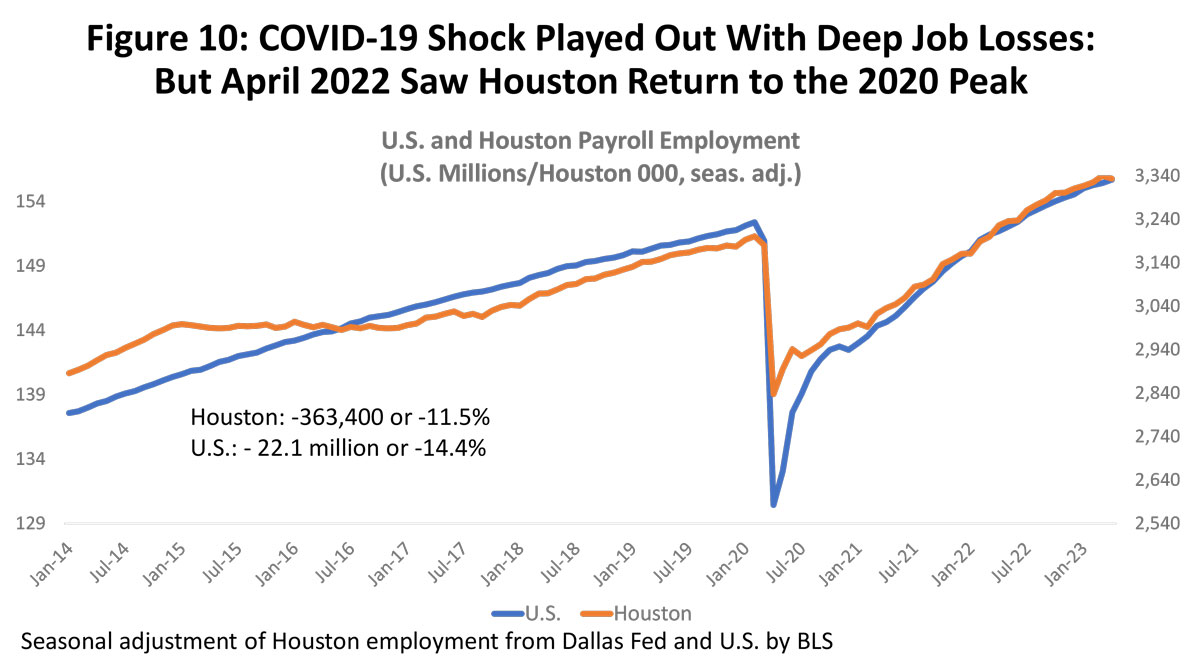
There is no question that Houston’s payroll employment has produced extraordinary growth in recent years. Its 2019 total payroll growth was right on a typical trend pace of 58,500 or 1.7 percent. Then came the pandemic and the loss of 191,900 jobs year-over-year, then the return of 164,100 in 2021, and finally another 153,000 last year. Since the pandemic, jobs were all recovered last April, Houston moved into a new economic expansion and added 107,400 new jobs.
But we need to be careful in how we interpret these job gains. Houston’s growth has been right in line with the post-pandemic recovery seen across the nation. Like the nation, local job growth and spending by Houston households represent the strength of the current business cycle.
At the same time, we have not in the Texas employment boom, lagging the state and the state’s other major metro areas. Blame this on oil which has been an on-going drag on local growth since 2014, just as it has been for other oil-dependent cities across the state.
A recent history of Houston’s payroll employment losses and recoveries are shown in Figure 10, with a lockdown decline of 363,400 jobs or 11.5 percent. This compares to 21.1 million US jobs lost or 14.4 percent. Houston’s decline was smaller thanks to a less restrictive lockdown policy in Texas, and the stronger initial US recovery was a strong bounce back as heavier COVID sanctions were lifted. However, for the most recent recovery phase, Houston and the US were on virtually the same track. By April, Houston had added back all of the lockdown losses, plus since then another 107,400 jobs through this January. The US completed its job recovery two months later in June.
If Houston matched the US recovery, it lagged the state and particularly the !-35 metro areas. Figure 11 shows the five major Texas metros in the upper part of the chart, and the first column shows the date at which recovery was completed, i.e., when all the COVID jobs were back. Houston’s lagged the state as a whole as Texas recovered by October 2021. Houston was last among all the other major metros.
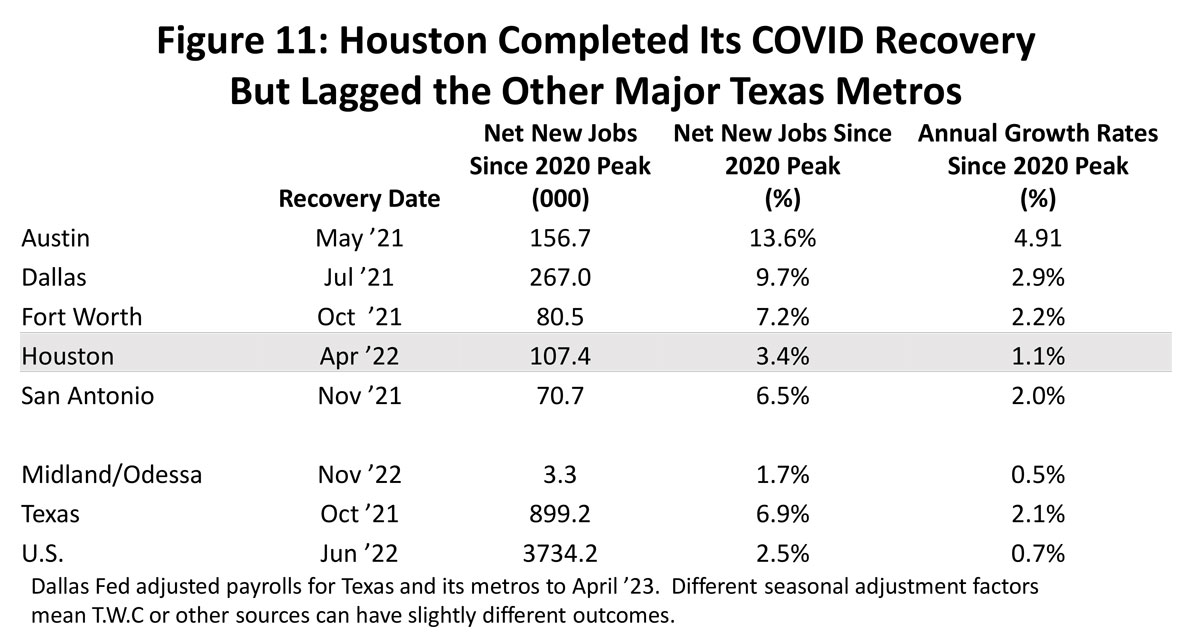
Column two shows the number of jobs added by each metro after they had returned to pre-COVID levels in February 2020. This is also, of course, a measure of all of the growth in employment since February 2020. Because of the differences in metro size, the percentage employment increases for each metro are shown in the third column. And after 38 months of recovery, column four shows the annualized growth rate of job growth over the three-plus years.
In terms of the total number of new jobs added since COVID, Dallas leads the state with 267,000 and more than doubles the number for Houston. Austin’s number of new jobs also exceed Houston, and it had the fastest growth rate at 13.6 percent. Meanwhile, Houston’s 3.7 percent growth is the slowest, and probably the only one that falls well below long-term trend growth rates.
Why has Houston lagged? Note in Figure 11 that Midland/Odessa only managed to complete its recovery last November and has since added only 3,300 net new jobs. This is the heart of the state’s oil producing region, and these cities — like Houston – are highly dependent on oil-related jobs. While Houston has other sources of growth apart from oil, we can strongly infer that Houston’s relatively slow recovery is centered in its large oil sector.
We think of the major drivers for Houston’s growth as the US economy, oil, and the Texas Growth Formula (TGF) derived from lower taxes, less regulation, and a younger population. From 1990 to 2019, about 50 percent of local growth was the US economy, 35 percent from oil, and 15 percent from the TGF.
While the I-35 corridor apparently reaped large gains from the TGF during the pandemic, it is likely that Houston did as well, as reflected for example by solid (if not spectacular) population growth in 2022. After 2019, we see the fracking industry accept that it is a high-cost source of oil and adopt a new financial model that leaves it as a smaller and more slowly growing contributor to the Houston economy. The TGF contribution remains in place, and it is oil that slowed Houston’s recovery, and probably cuts into Houston’s long-run growth as well.
Houston’s Economy Now
The big picture for Houston is a recovery from pandemic that falls in line with the rest of the nation, i.e., a recovery that came with significant strength and momentum. And the Fed’s efforts to slow the US economy are now having much the same effects on Houston as on the US: credit-sensitive sectors that responded negatively to higher interest rates, manufacturing that has slipped into recession, and wholesale trade jobs that broke a strong growth trend last October, leaving periods of flat growth or modest declines. We lack timely data on personal income or consumption in Houston or other metro areas, but spending stays strong while Houston’s employment growth – unlike the US – has slowed sharply early this year.
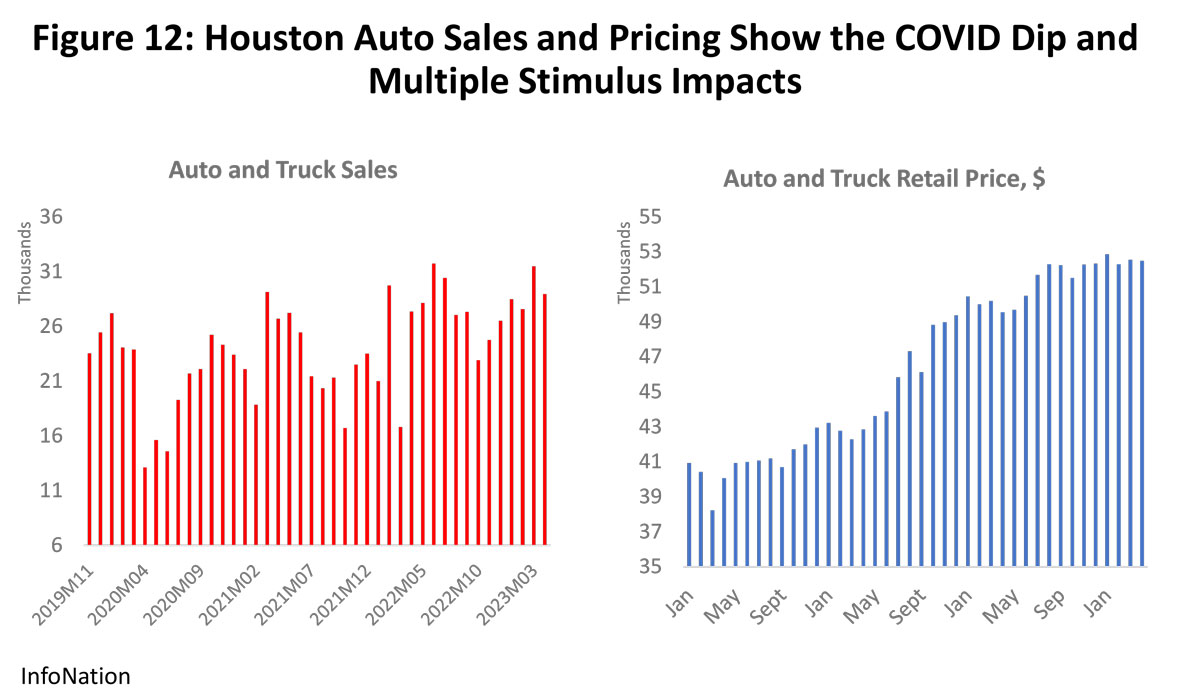
Rate-sensitive sectors like autos and housing responded differently during the pandemic and after. Autos, for example, struggled to deliver product due to chip and other material shortages, and these choked supply chains made price the major outlet for surging auto demand in 2021 and early 2022. (Figure 12) Prices remain high – still about 25 percent above pre-COVID levels – but with no significant price gains in the last year. Demand for new cars has been erratic through the last 12 months but there has been little sales growth.
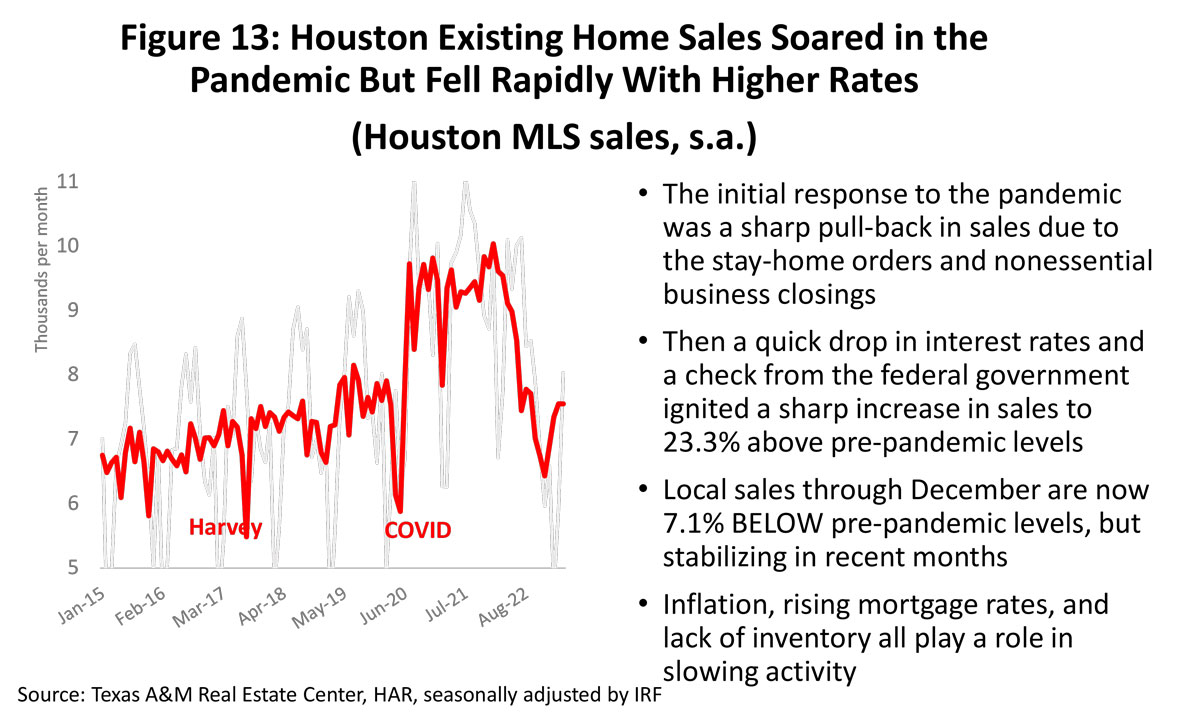
Existing home sales were almost certainly a pandemic bubble that burst as soon as mortgage rates began to rise. (Figure 13) Existing home sales in Houston fell hard during lockdown months but recovered quickly with a check from the federal government and zero interest rates. Housing became a major element of the 2021 financial boom. Sales in Houston rose as much as 23 percent above pre-pandemic levels, only to fall hard when the Fed raised rates in March 2022. They then fell back to 19.3 percent below pre-pandemic levels and have since recovered to 7.1 percent below.
Existing home prices surged from $252,600 for the typical unit to $344,780 during the boom period, or by 36.4 percent. So far, they have fallen back only 4.0%, and history says prices could hang to a big part of these gains in years to come. However, such an outcome would likely mean a decade or more of small or limited increases.
Manufacturing across the state made a strong pandemic recovery in 2020-21 according to the Dallas Fed but a long and persistent weakening trend set in shortly after the first Fed rate cuts. The first negative result for the sector was registered in February, improved slightly, and then was repeated again this month with a 1.3 percent decline.
The overall Houston Purchasing Managers Index declined steadily for the last year and stood at 51.6 in April indicating slow but positive growth for the overall economy. Again, following the US lead, Houston’s manufacturing sector hit its first negative value last September and finally slipped into strong contraction in April. Growth in Houston outside manufacturing has been slowing steadily but still reflecting moderate expansion.
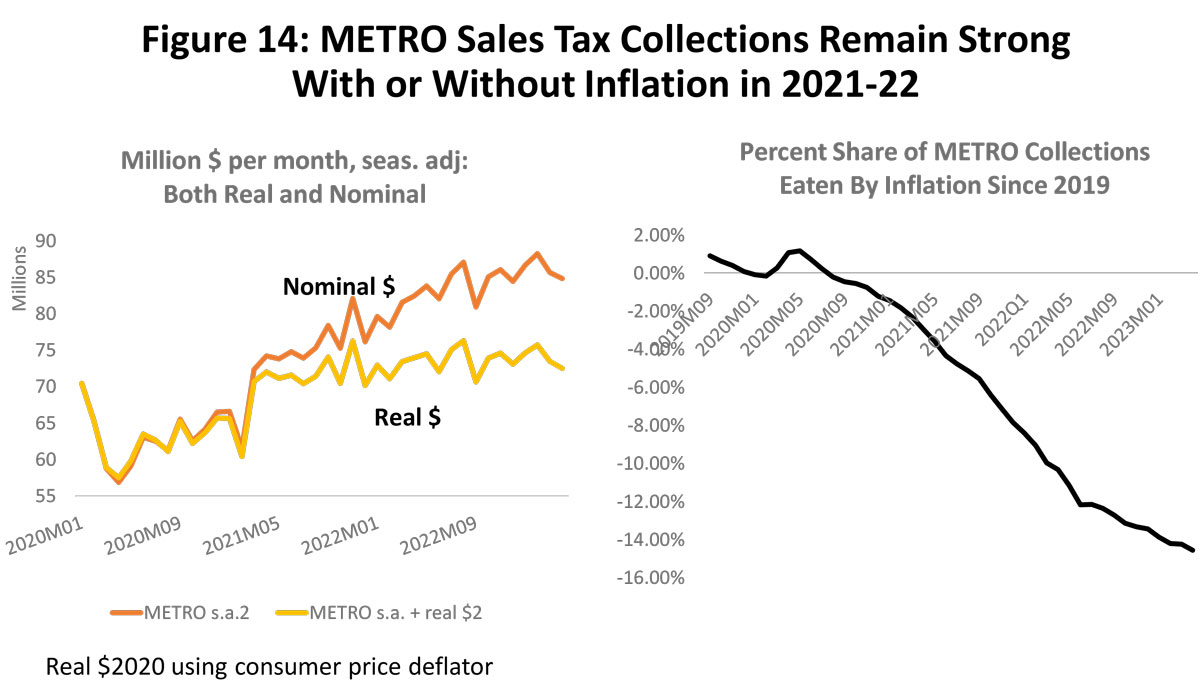
For Houston and other metropolitan areas, we do not get timely data on personal income or consumption, but spending data is available. The METRO MTA and City of Houston sales tax revenue both provide a good window into these results, with METRO providing broader coverage of the metropolitan region. If you look back at Figure 6 on US retail sales, you can compare them to METRO’s sales tax collections in Figure 14, and in many ways, they are a mirror image of each other. With the early 2021 stimulus payments we see a jump in METRO’s sales tax collections of at least $5.6 million per month or the equivalent of an additional $560 million dollars in local taxable sales. Even adjusted for inflation, these revenues have not yielded any ground to the initial 8.6% surge above pre-pandemic levels.
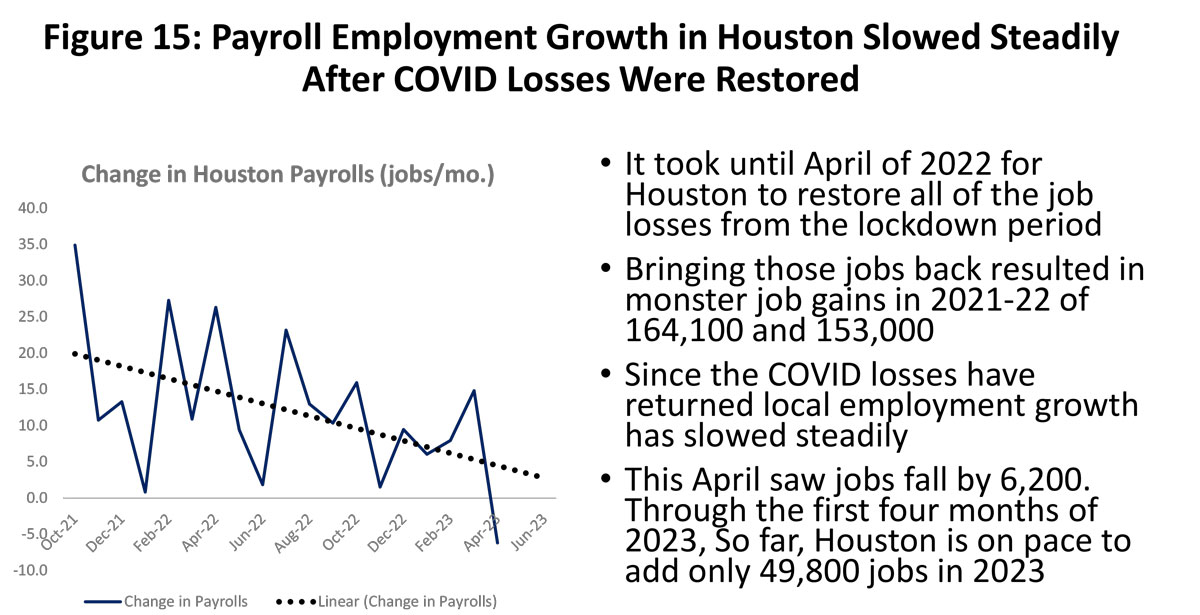
An important difference between the current position of the US and Houston is that by 2023 Houston payrolls slowed sharply through April. (Figure 15.) Both Houston and the US recovered their massive COVID job losses on virtually the same schedule, and both have slowed in recent months toward long-run trend growth. However, recent US growth still remains well above those trends, while Houston slowed sharply since last December. Seasonally adjusted data from the Dallas Fed shows Houston losing 6,200 jobs in April, and the first four months of the year put Houston on pace for only 49,800 jobs in 2023. This is far below the 153,000 added last year as part of the final catch-up on COVID recovery, but it is also below Houston’s long-run trend in growth near 58,000 jobs per year.
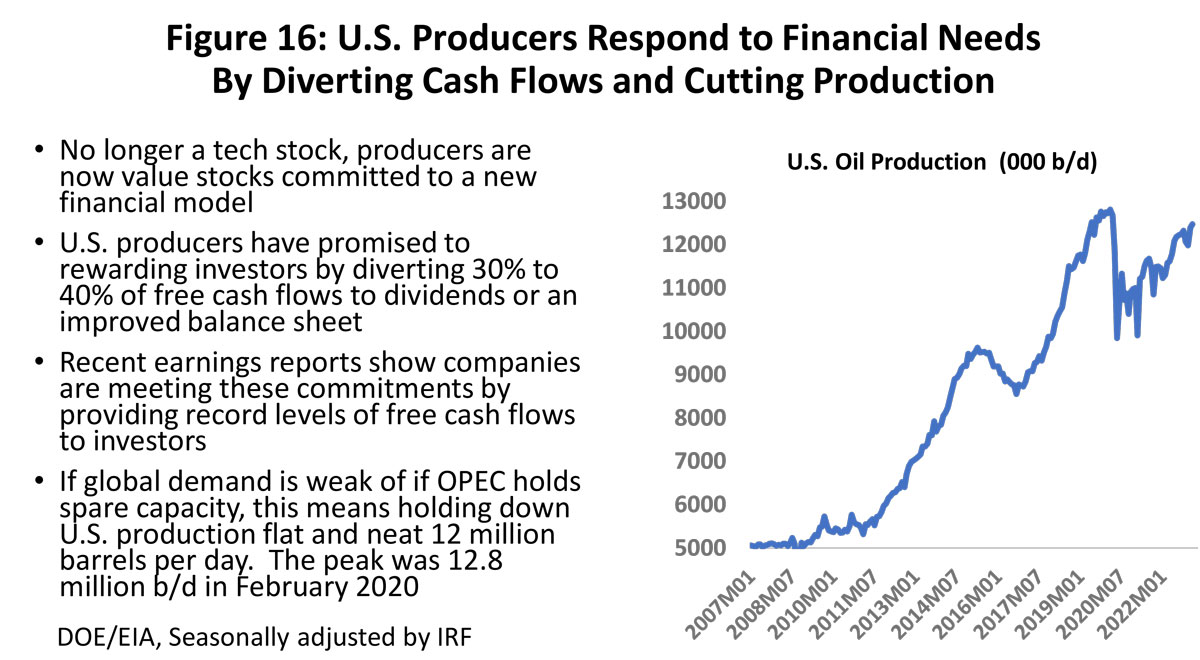
Houston Oil: Smaller, Cautious, More Stable
We have stressed in past reports that the future economic impact of oil on Houston will be smaller than in the past but more stable. The fracking industry has accepted that it is a high-cost source of oil and that it can no longer rely on sustained high oil prices and rising equity values as a means to attract investors and finance oil-field activity. Instead, it has become a value stock and committed to using 30-40 percent of its free cash flow to draw investors. This means substantially less oil-field activity at every prevailing oil price than would previously have been expected. (Figure 16)
This new financial model for the fracking industry comes with other rules beyond maintaining a pristine balance sheet and rewarding investors with substantial dividends. One is to remember that they need oil prices at $55-$65 to profitably produce oil, but they should never get sucked into another round of high levels of drilling and production based on high prices like $100 oil. That would be the formula for yet another round of bankruptcy for the industry. Finally, they know that OPEC holds the whip, and should never increase production if demand is weak or OPEC holds excess production.
One loose analogy to producer behavior as they move through the oil-price cycle is that they now are treating their balance sheet as a rainy-day fund. In place of pouring their cash into drilling activity every time the price of oil rises, they use part of it to fortify their balance sheet and reward their investors. Then they can better weather low oil prices based on their financial strength. The producers benefit individually, and the Houston economy benefits from their collective actions to stabilize the industry over the oil cycle.
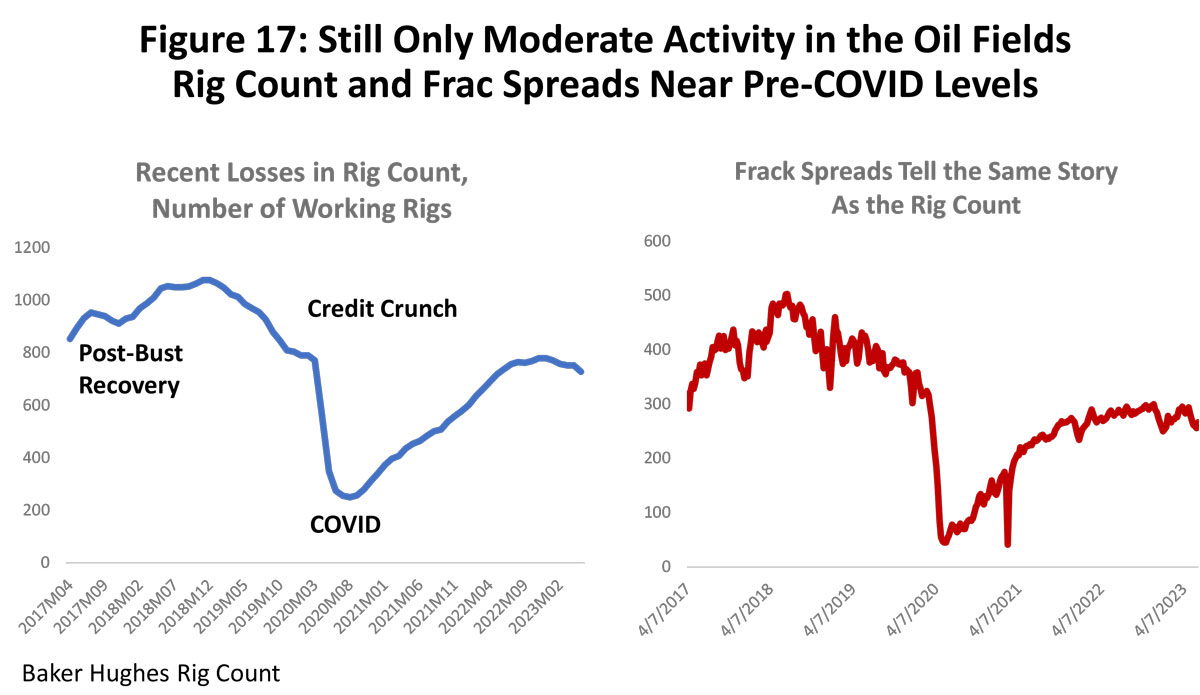
There has not been a rush back to the oil fields after COVID. (Figure 17) The rig count reached a blow-out level of 2,000 working rigs in the fracking boom years before 2014 that was driven by $100 oil; in 2017-18 the number of working rigs stood at 1,000 after the 2014-16 fracking bust ended and recovery came in 2017; after US producers sent oil production sharply upward in 2018, OPEC cut oil prices again in 2018-19 to near $55. The result was an industry-wide credit crunch as US producers could make no profits at $55 and equity values plummeted. This credit crunch had already pushed the rig count down to nearly 760 before COVID arrived, but it fell to an all-time record low of 253 shortly after. Recovery through May has only been a return to around 760 working rigs.
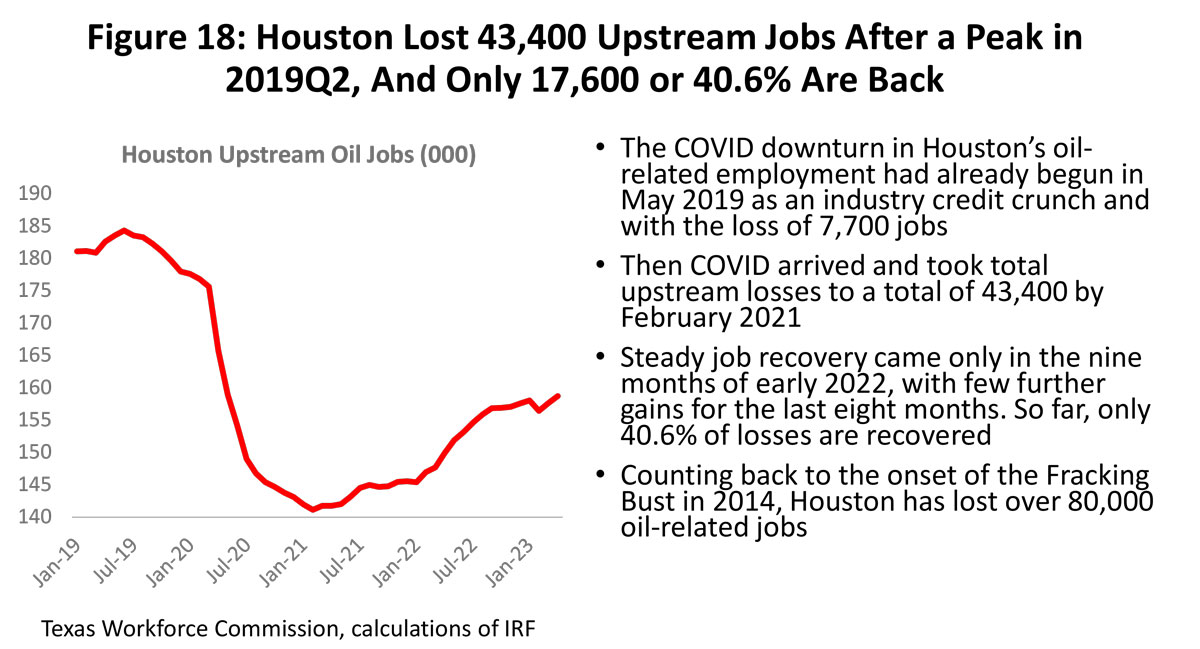
Oil-related employment in Houston has behaved in much the same way as the rig count – slower and lower in spite of the healthy oil prices. (Figure 18). After losing 43,400 upstream oil jobs to the credit crunch, COVID pandemic, and Saudi/Russian oil war, the return of these jobs stalled last fall with Houston returning only 17,600 upstream jobs since the pandemic ended. If we begin counting from the end of the fracking boom in 2014, Houston has now lost over 80,000 upstream jobs in oil production, services, fabricated metal, and machinery. Again, this is now a smaller, slower-growing industry.
The right side of Figure 17 compares the number of frack spreads or frack fleets to the rig count, with many observers claiming that frac spreads are the better measure. A frack spread is a complement of equipment required to perform hydraulic fracturing at the wellhead, often including pumps, data trucks, storage tanks, and chemical additive units. In this case, they seem to be telling the same story as the rig count about oil-field activity that has returned only to distressed pre-COVID levels and is currently growing slowly or declining.
As this report was written, OPEC+ made its latest oil price increase on June 6. This comes after a surprise production cut/oil price increase in April when several OPEC+ members that held excess capacity volunteered cuts in production that would continue through the end of this year. This is on top of a continuing two million b/d cut agreed upon last October. This time, Saudi Arabia decided to go it alone as the only country to add a million barrels per day to on-going cuts.
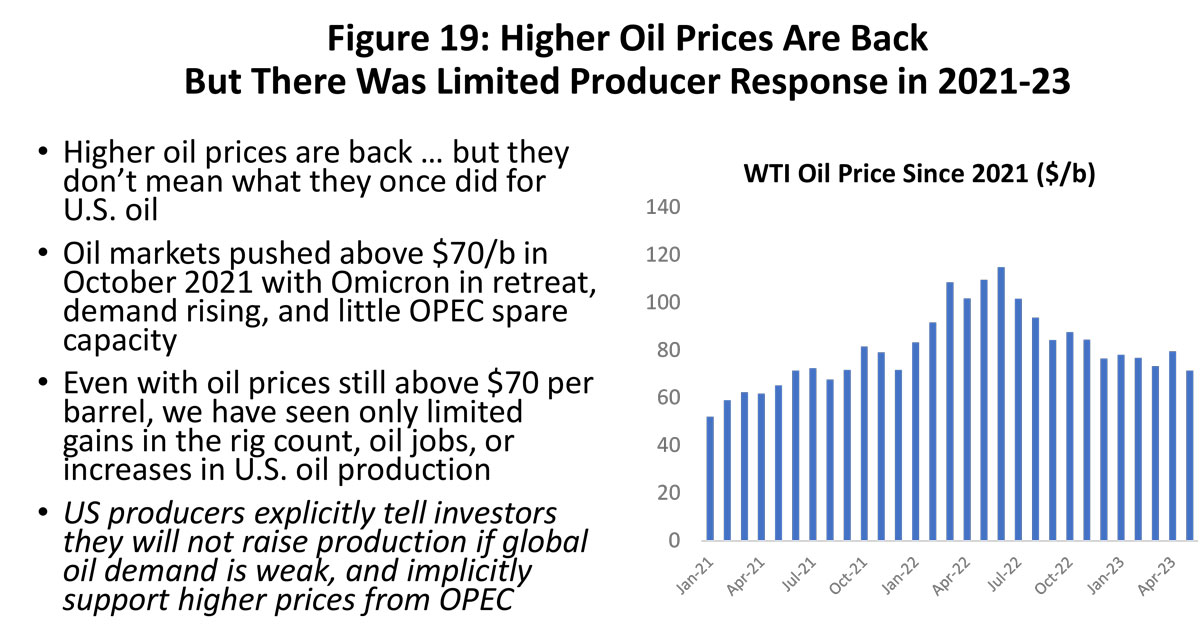
These cuts have maintained oil prices steadily above $70 per barrel since October 2021. (Figure 19) OPEC+ cuts are needed to support oil prices if the IMF is correct in its forecast of slow global GDP growth of only 2.8 percent this year and 3.0 percent in 2024. Slow growth is led by the developed nations as they collectively slow their economies to fight inflation, while the developing and emerging nations are struggling with high post-pandemic debt levels.
The new financial model for US producers finds them explicitly telling their investors they will not raise production if global demand is weak or OPEC holds excess capacity, and implicitly telling OPEC they will not buck their efforts to limit oil production and raise prices. If prices should fall hard in a global recession, producers can remain partially protected by a strong balance sheet and loyal investors.
Houston’s Employment Outlook
With COVID behind us, 2023 sees economic fundamentals return to the driver’s seat as oil and the US economy take control, while the hangover from past fiscal/monetary stimulus will disappear as the Fed reverses and maintains restrictive policy. (Figure 20)
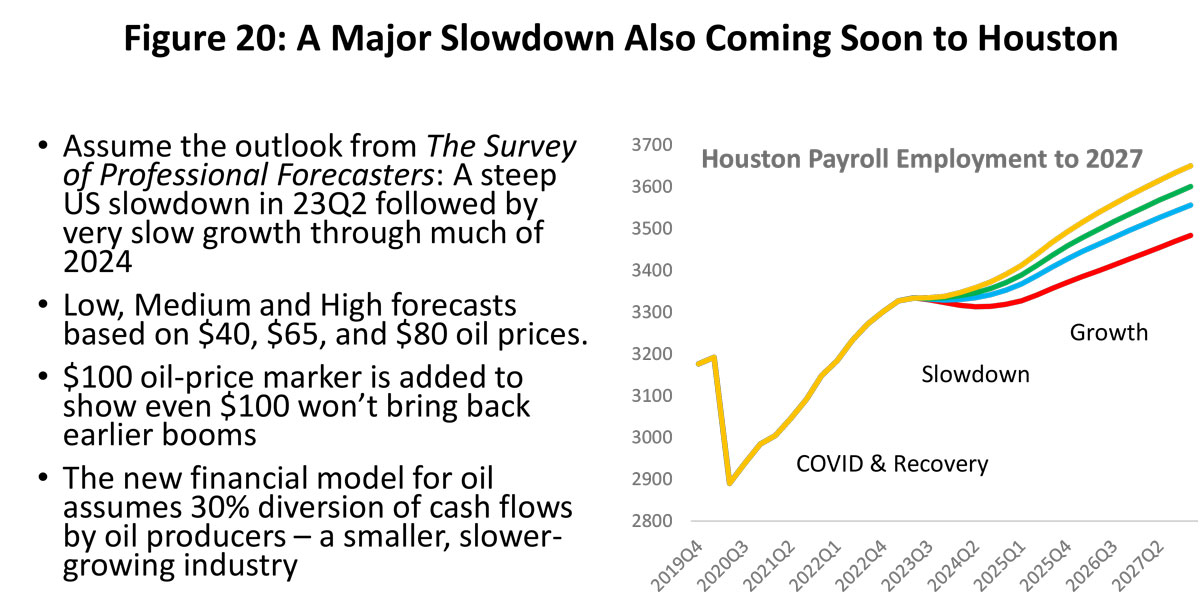
To pull the forecast together, we use a high, medium, and low outlook for planning purposes. We use the price of oil as a vehicle to spread the outlook from low to high employment levels. For current planning, the low oil price is set near $40 per barrel and the high at $80. The medium price is $65 per barrel or the long-run marginal cost of oil. In all cases, we use the new financial model with 30 percent of producer free cash flow diverted to investors or used to strengthen the firm’s finances. This smaller and slower-growing oil industry reduces our expectations for oil-field expansion and now implies slower regional growth than similar prices would have implied in the past.
We add to these calculations the impact of $100 oil prices. With the on-going war in Ukraine, this price may prove briefly relevant again. Always a past marker for an oil-field boom, it serves primarily to illustrate how a prolonged period of $100 oil will probably never again bring back the frenzied oil-field activity levels of the past.
We follow the lead of the Survey of Professional Forecasters in assuming an abrupt slowdown in US payroll employment growth from 281,500 jobs per month in 2023Q2 to only 43,800 in 2023Q3, and then averaging monthly growth of 33,600 jobs monthly over the following four quarters. This compares to 193,000 jobs per month during the 10-year expansion that followed the Great Recession and leading up to 2019Q4 and the pandemic. There is no US recession in the outlook — just a prolonged slowdown of six quarters — and growth that picks up quickly and moves above trend by early 2025.
Figure 20 also shows how these economic fundamentals play out over the long run for Houston payrolls in the low, medium, high, and $100 cases. This is our forecast of Houston’s future through calendar year 2027. We see the COVID lockdowns end and a recovery to pre-pandemic employment levels and beyond, then a sharp slowdown comes in 2023 that briefly skirts zero growth, which is followed by 2024 as a second year of slow . Both 2023 and 2024 growth averages about half of Houston’s long-run annual trend of 58,000 jobs. We bounce back well above trend in 2025 before reverting to these long-run trends.
Figure 21 is this same 2023-2027 forecast of Houston’s payroll employment stated in annual changes and measured Q4 over Q4 each year. The near-term focus of the outlook should be between the medium and high forecasts if oil averages between $70 and $80 per barrel as it has done for the last 18 months. If oil prices continue to hold near this $65 and $80 range, we could see around 30,000 jobs in both 2023 and 2024. If they were to slip back to $40 per barrel, we could see only 10,000-20,000 new jobs each year.
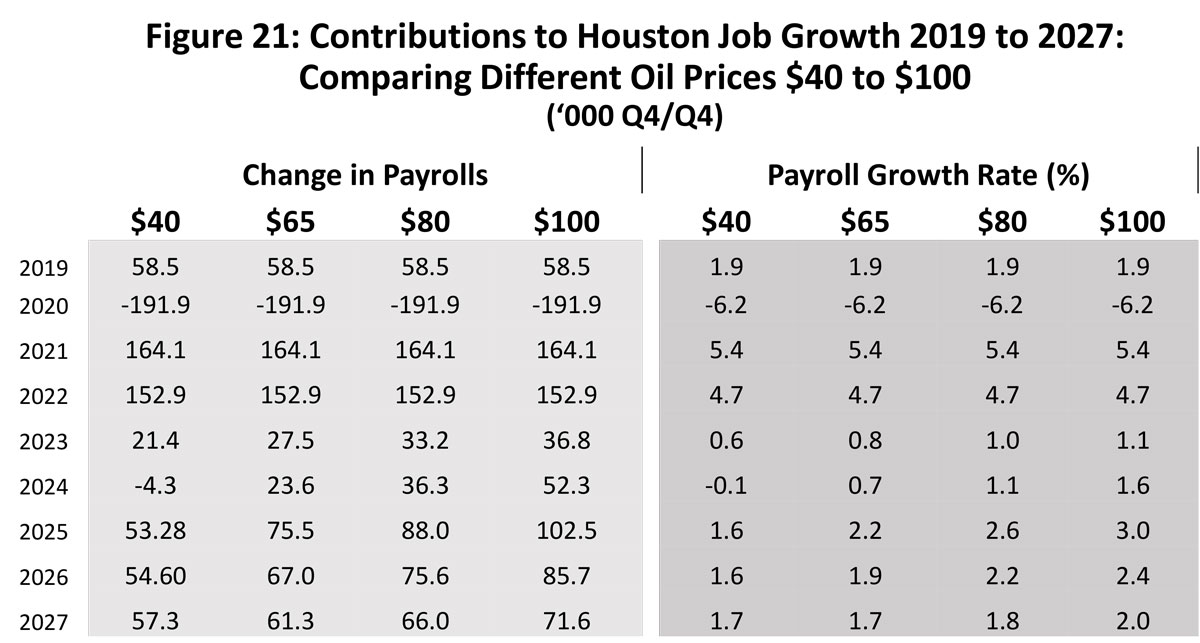
If oil prices in 2025 revert to a long-term mean near $65 for oil and 125,000 jobs per month for the US economy, we expect a bounce back in the local economy to 75,500 jobs, followed by 67,000 in 2026 and a near-trend 66,000 in 2027. Such a bounce is typical after any slowdown or recession, as trained workers and factories are already in place and simply waiting to return to work.
Note that $100 oil briefly sees a big year for Houston in the 2025 recovery with 102,500 jobs. However, this quickly falls back to a longer-term mean near 70,000 local jobs. Contrast this to the final three years of the fracking boom, for example that averaged 107,600 new jobs through consecutive years.
Written by:
Robert W. “Bill” Gilmer, Ph.D.
1 The trend growth rate assumed here is discussed at length below. The Survey itself only forecasts payroll employment for four quarters and for two years (12-month periods) ahead. Using this, I assume a recovery and
return to trend growth, with the timing of the recovery left to me.