Houston Updates
-
Archive
- March 2025
- December 10, 2024
- September 14, 2024
- May 21, 2024
- March 19, 2024
- December 9, 2023
- June 16, 2023
- April 6, 2023
- March 17, 2023
- Dec. 19, 2022
- Sept. 14, 2022
- July 4, 2022
- March 27, 2022
- March 9, 2022
- September 2021
- April 2021
- March 2021
- September 2020
- August 2020
- June 2020
- April 2020
- March 2020
- January 2020
- December 2018
- June 2018
- March 2018
- February 2018
- January 2018
- September 2017
- September 2017 Post-Hurricane
- June 2017
- March 2017
- January 2017
- September 2016
- March 2016
- December 2015
- September 2015
- June 2015
- March 2015
- December 2014
- June 2014
- March 2014
- November 2013
- September 2013
The Outlook for Houston’s Economy as We Approach the End Game for COVID-19
April 1, 2021
The following is a presentation by Robert W. Gilmer, Ph.D. to the American Society of Appraisers: Houston Chapter during its April 2021 meeting.
Introduction
- The COVID vaccine is being widely and successfully distributed. There is an end to the pandemic in sight for us individually, collectively, and for the economy
- Meanwhile the news has been very bad, especially for employment. And recent revisions to the data for the last years tell it was much worse than we thought
- There are good reasons why — even looking backward at the last year — employment may not have been the only key figure to watch. Income data driven by the stimulus has been nearly as GOOD as the employment numbers have been bad.
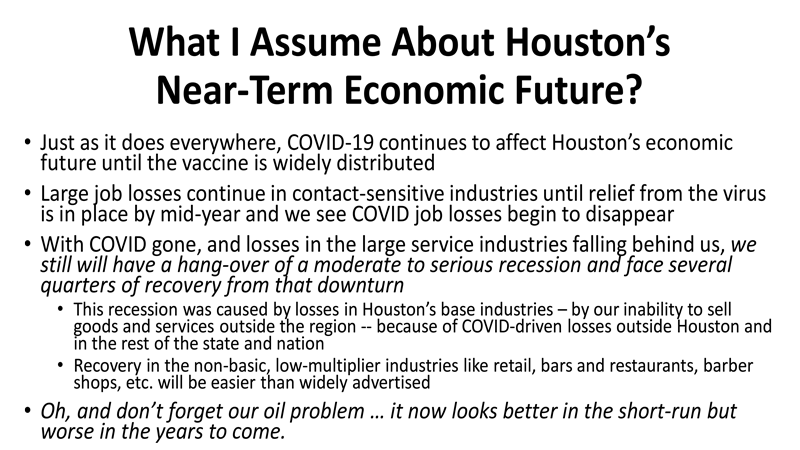
- Ending COVID should turn into a mopping up process over the course of this year, and growth slowly turn back to normal
- BUT Houston has its own oil problem — a problem for the local economy since 2014, and already in a crisis of its own in 2018-19 before COVID set it.
- Oil — led by fracking — is going to be a smaller industry in the U.S. and Houston will grow more slowly in coming years as a results. This is not peak oil or a new administration, but the industry’s own history of one financial disaster after another
How Does COVID-19 Affect Economic Conditions? Some Definitions
- In past pandemics, this disease not had been left uncontrolled — but certainly with less public intervention that now. Past pandemics have created more widespread illness, labor shortages, and supply chain disruptions as economic activity is disrupted. More economic impacts stemmed from the virus than from prevention and cure
- Reactive social distancing by the public has been part of every past pandemic as the fear of the virus forces us to avoid crowds, stores, bars and restaurants, public transportation, and travel
- In many cities, mandatory public orders were used to control the disease in past epidemics: limits to crowd size, closing of bars and restaurants, closing schools, travel restrictions, etc.
- The widespread and coordinated use of mandatory stay-home orders and closing all nonessential businesses was a new feature in the pandemic. These restrictions pulled economic damage to a point early in the pandemic but were meant to ease later infection rates. Once stay-home orders were lifted, the reactive social distancing and other mandatory public health orders continue if COVID is active
- As the vaccine arrives it will be contact-sensitive unemployment and continued public health impacts of COVID disappear during 2021
COVID and the Houston Economy
- Fishing pole picture — rod with line dropped off end of a bridge
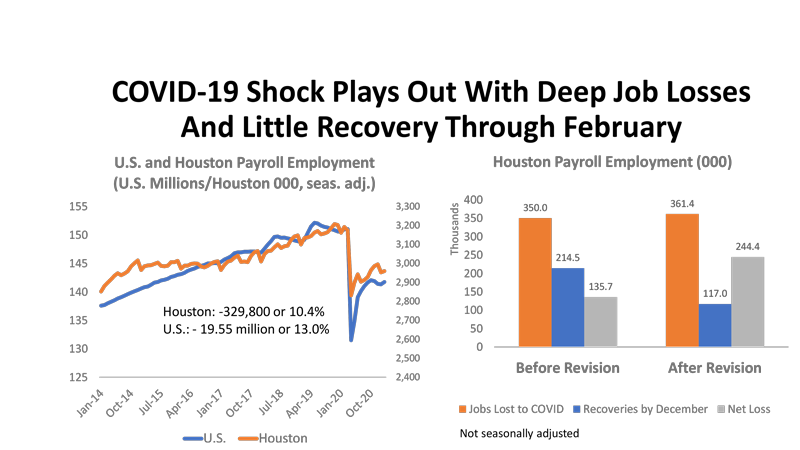
- Immediate losses are huge — 10.4% in US, 13.0%
- Bigger bounce back in US that Houston: (1) guitar string theory and Houston had less severe lockdowns and (2) oil and gas selectively hurts Houston more than the rest of the state
- The bounce back from the lockdown partial has not been big. And recent revisions have shown it to be much smaller than thought. Benchmark revisions from March Workforce Commission
- Left side is before revision: 60% of jobs lost to lockdown had returned, 40% still gone. After revision, less than one-third recovered (31.4%) and 70% still lost!
- US in contrast has over half of original lockdown losses now recovered (52.5%)
Long way to go to return jobs in both US and especially in Houston
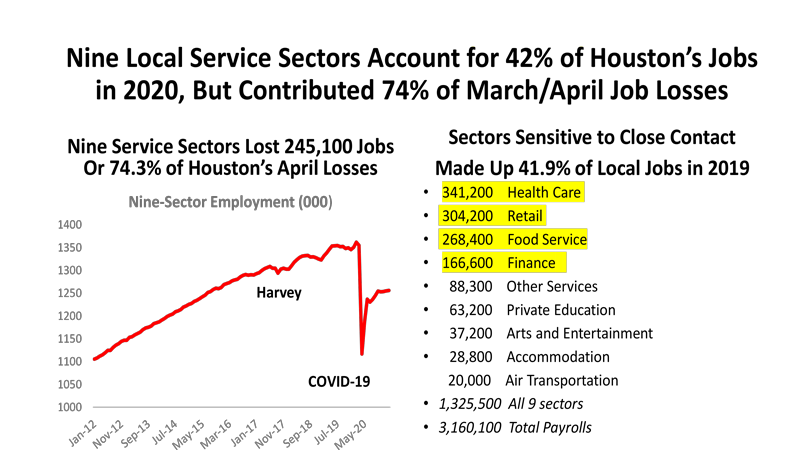
- This is where biggest share of all the March/April job losses came from
- A list of nine service industries in Houston that account for about 42 percent the 3.2 million jobs in the metropolitan area in 2019 – but contributed 75% of the losses in Mar/Apr 2020
- These are jobs that involve personal contact and have been most sensitive to both reactive and enforced social distancing
- We will talk later about the jobs that drive the economy. This is not the list. These are the jobs that follow growth originating elsewhere in the economy – in oil and gas, for example.
- But retail, health care, bars and restaurants, etc. are absolutely not the drivers of the economy (base jobs) These jobs that grow in response to big gains (or losses!) in oil or other economic drivers.
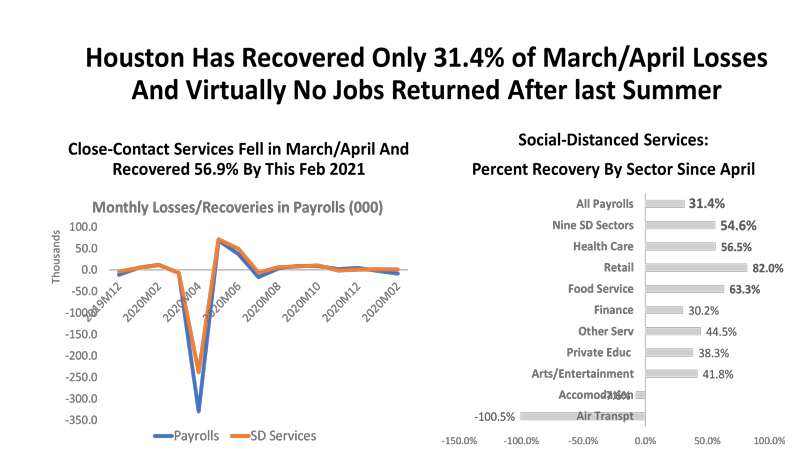
- Chart on the left shows the month-to month change in total payrolls and the 9 contact-sensitive sectors
- Most of losses in Mar/Apr were in the nine sectors. ALL recoveries in these sectors (103.6k total jobs returned, 139.4 among the COVD-9)
- All the recoveries came in the immediate lockdown period in May and June. Virtually no recoveries after June.
- Strongly suggests we hit a COVID ceiling — where continued reactive and enforced social distancing d stay at work as long as the virus is active. We are waiting for a vaccine to make progress from here.
- The chart on the right shows recovery by sector – all are positive except the relatively small accommodation and airline sectors
- 55% of the 9 COVID sector jobs are back, only 31% of all payroll jobs
- Note that the biggest sectors that have the biggest recoveries – healthcare, retail and food service
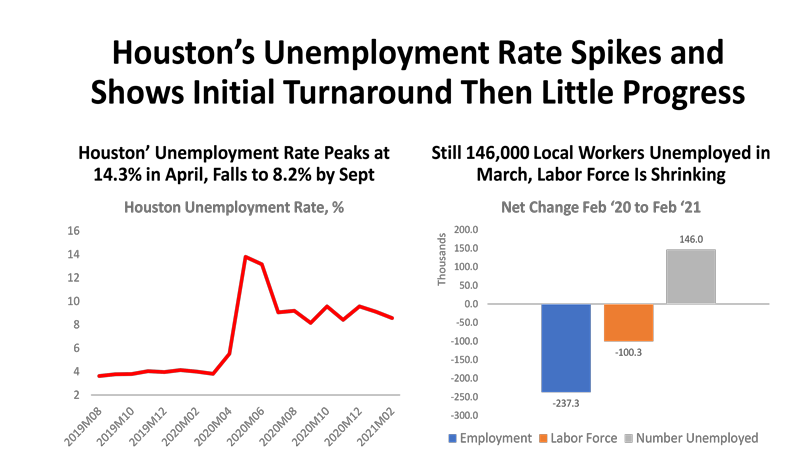
Houston unemployment rate peaked at 13.8% in May, fell to 9.0 percent by June and was 8.6 percent last month.
- It is the same pattern seen in employment of progress stalling over the summer
- Chart on the right another broader measure of local employment — with the same results in terms of numbers of jobs lost
- To be unemployed two thing are necessary: (1) out of work and (2) actively looking for work. The chart also 100,300 people have become discouraged were no longer looking for work — and dropped out of the labor force. If these 100,000 were still looking for work the unemployment rate would jump back up to 11.5%
- We still have 146,000 who fit both parts of the unemployment definition are still out-of-work and actively looking for work
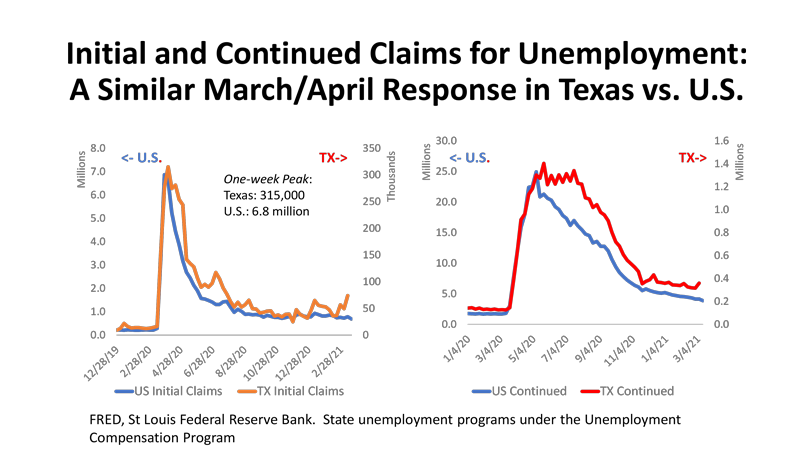
- If separated from your employer and covered by the Unemployment Insurance Program you can apply for unemployment compensation. These are the results for the state programs only (basic plus extras that come in any time of financial/economic stress) and not the COVID payments for gig workers and others not covered by standard state programs
- This is Texas versus the US. There is clearly a COVID factor here. Now you see get to see a backward version of the fishing line. Applications surge and fall back after the lockdown. Again — by the time we get to summer, any downward progress has all but disappeared
- New claims bring people onto the unemployment rolls, and they fall off as they get new work. The net change is the continued claims. On the right side of the chart. Falls slower than the rest of the US — again, lockdowns far more restrictive outside Texas and the US had a longer earlier runway for the fall. Texas has caught up. Again, progress has slowed.
- The current numbers are still comparable to the Great Recession, for example, in both the US and Texas. Initial/continued or US/TX similar.
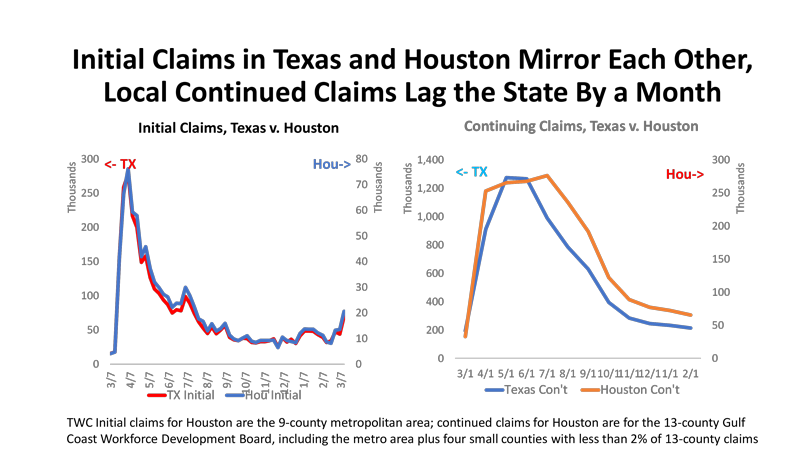
- This compared the same numbers for Texas and Houston. Houston is 25% of state employment and follows the same rules on COVID lockdown and remaining health rules.
- Virtually nothing to separate the results. The tick up at the end is the effect of cold weather.
- The chart on the right looks different but is because we only get monthly (not weekly) data on continued claims. Here Houston follows Texas a month later and stays higher. Oil to blame? Probably.
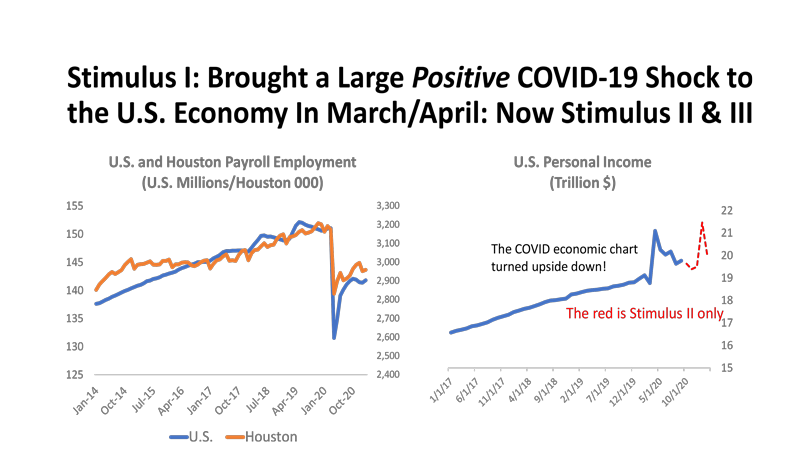
- What happened to the employment data as a result of COVID was like a horrific accident where you can’t keep from looking at the damage done at the scene. It was a terrific negative blow to the economy and shock to the public
- But we had two serious shocks to the economy in March and April of 2020. One positive and one negative. One shock to employment and the other to INCOME.
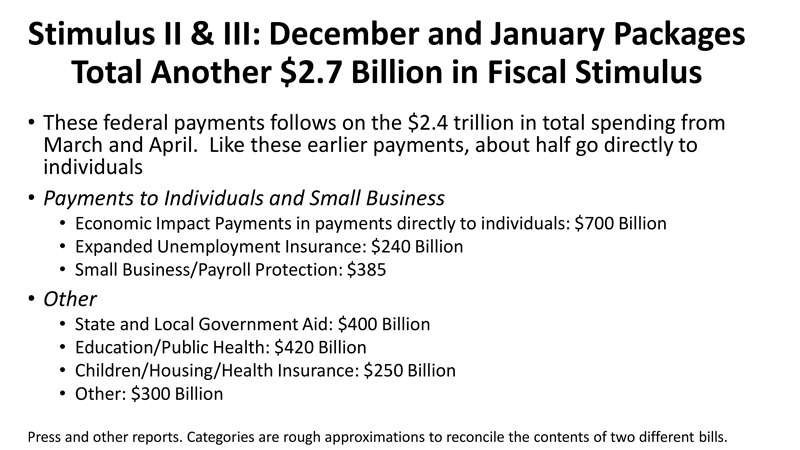
- The blue line on in the right chart is the effect of the $2.5 trillion in stimulus on PERSONAL INCOME. About 20,000 for each of 128.5 million US households.
- The red line is the second positive shock from the December/Post-election/Republican senate.
- The third round Democratic senate addition is yet to show up in the published income data
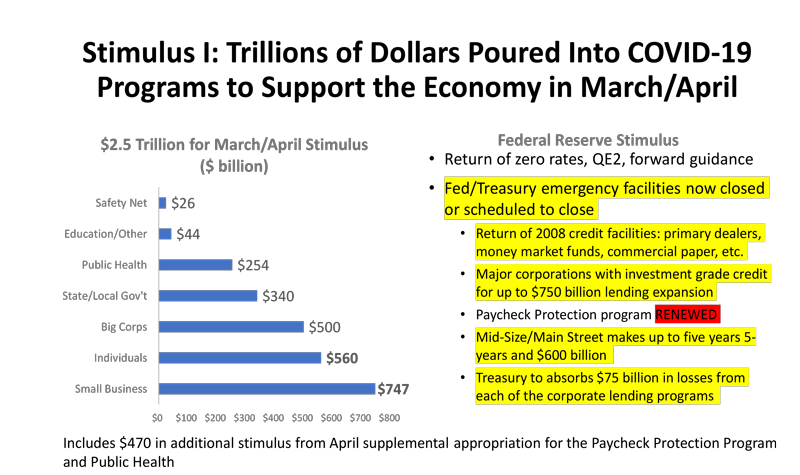
About half the stimulus I went more or less directly into the pocket of households as payments to individuals or small business. About $10,000 per household.
- Fed’s monetary policy went into high gear and maintains zero rate and easy monetary policy. However, all the emergency lending facilities and various programs supported by Treasury have been pulled back now.
- There was little need and less demand after mid-2020. Paycheck Protection Program is the exception. It is scheduled to end March 31 but was in demand until now.
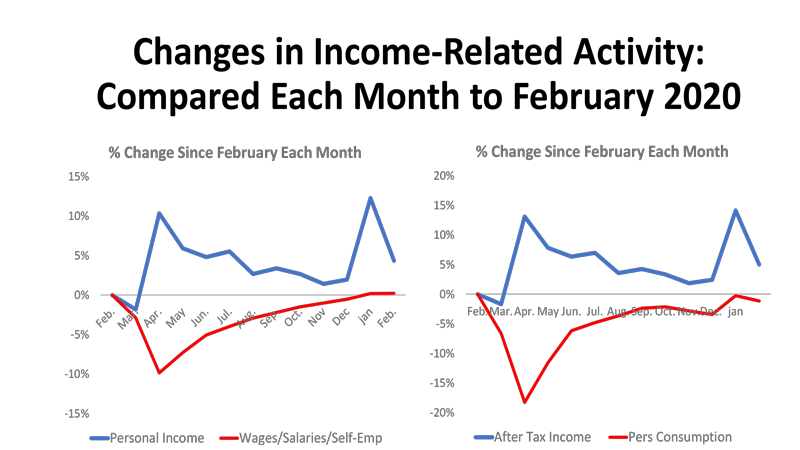
- This chart compare the level of income or spending by US households to February 2020 before the crisis arrives. If above the zero level, income and spending are at pre-pandemic levels
- LEFT side of figure: RED line is wages and salaries and earnings of self-employed. These are UNAFFECTED by the stimulus. You see a 9.8% drop in pay.
- The LEFT SIDE/BLUE LINE is personal income and stimulus is included. Now you see a 10% jump in income after stimulus is ADDED.
- Wages and salaries slowly improve to pre-pandemic levels, and TOTAL pre-pandemic income stays well above February.
- Then comes the second POSITIVE shock to income last December.
- The right side tells the same story except using personal consumption on the bottom — a big negative shock, steady improvement to pre pandemic levels, and after-tax income that slowly falls back before being refreshed in December.
- The consumption/spending recovery has been dominated by goods. If spending was down and below pre-pandemic levels, it was because of services – movies, bars, restaurants, travel, etc. The COVID 9/contact sensitive group is at work again.
- Meanwhile, PERSONAL SAVING (not shown here) was up $1.9 trillion in February 2020 and is $2.4 trillion today. Stored ammunition for travel and other services.
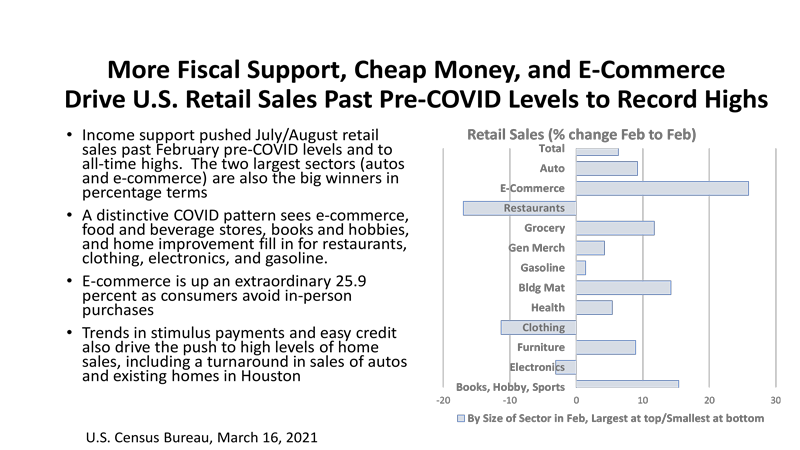
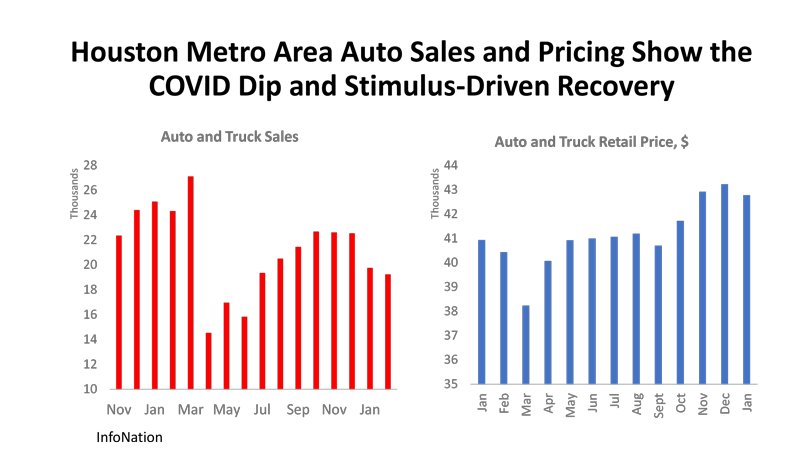
Retail sales are dominated by goods. Never under-estimate the ingenuity of the American consumer is spending money — even in a pandemic.
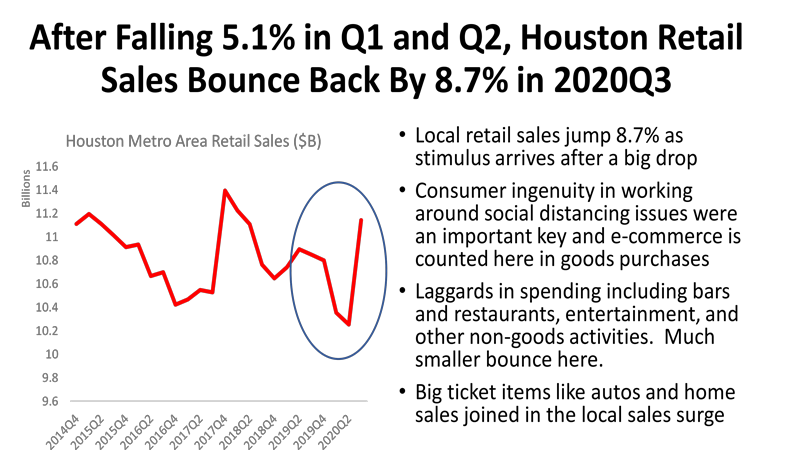
These are taxable sales of good and services in Houston. Unfortunately, the data arrives slowly, and we only have numbers until 2020Q3. But we can see the initial impact of the stimulus LOCALLY. Up 8.7% in Q3.
- There is less of a bounce in the non-goods sectors like food and drink, movies and entertainment, etc. Personal services like pool cleaning, maintenance and repair, etc. provide what bounce you see.
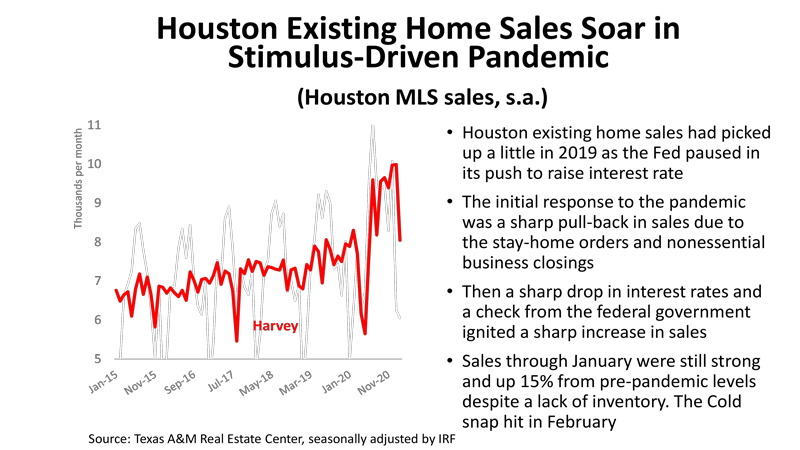
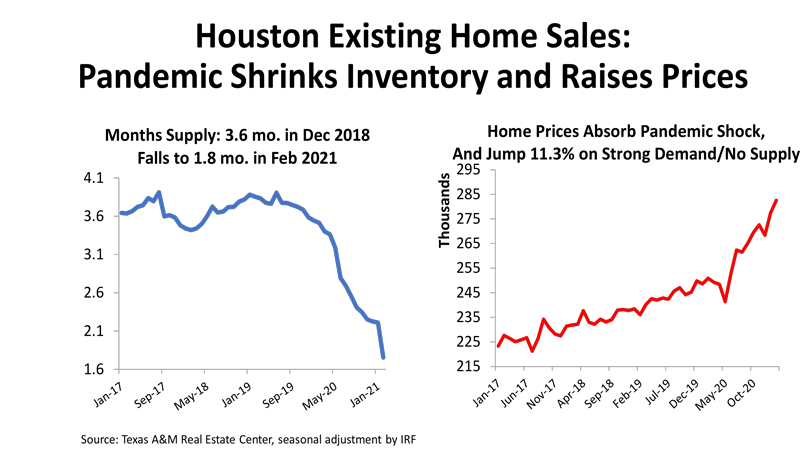
There are no homes left to sell. Inventories are below 1.8 months. If you want to sell your house now — where do you move? The shock absorber — too little supply, heavy demand — is always price. Median existing home prices are up about 11 percent from pre-pandemic levels.
How Bad Is This Downturn? Even With the Positive Shock from Stimulus. It’s Still Bad ... Maybe Just Not as Bad as Advertised
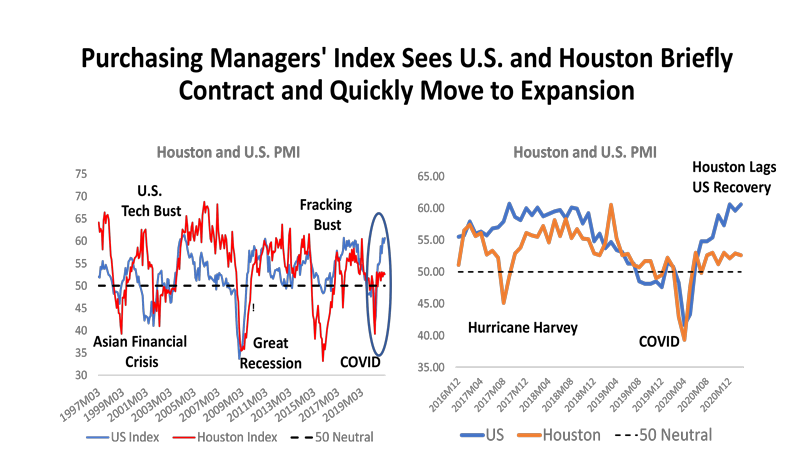
- We can turn to other sources of data to tell the story differently . This is the Houston Purchasing Managers’ Index, for example, as shown in the figure. The index is set so that 50 marks the no-growth line. Greater than 50 indicated expansion, and less than 50 is contraction in the economy.
- This measure gets us away from the employment versus income split, just asks how things are going overall.
- The chart on the left is a history of five downturns from the Asian Financial crisis to the COVID pandemic.
- COVID was only three months of setback and was a meaningful downturn that by this measure was worse than the Asian Financial crisis but not as bad as the Great Recession.
- The more recent data on the right shows Houston and the US suffered a similar setback, but Houston has really lagged in recovery compared to the rest of the US.
- Houston being worse is due to oil? In part – but probably only in part. We will see another perspective below.
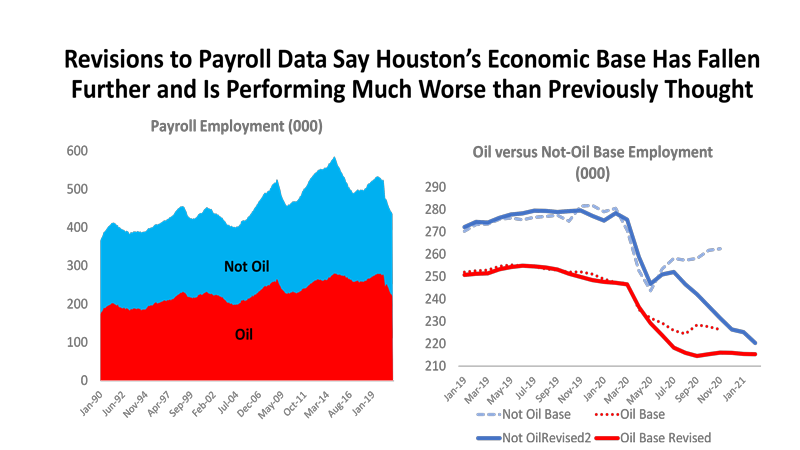
- Economic Base: These are the jobs that count in determining economic growth. They lead growth (oil, for example) while non-basic jobs are followers (retail, health care, food service, etc.)
- How do we know what is a basic industry? They export goods or services from the Houston metro area to the rest of the state, nation, or world. There are standard practitioner’s manual ways to identify them.
- The chart on the left identifies the base and says about half has been oil in the past. The other half? Companies like AIG on Allen Parkway, AIM, Sysco, Waste management, etc.
- The chart on the right shows basic jobs divided in oil and not-oil. The BROKEN LINES are where WE THOUGHT we were before the revisions – with the US economy-driven NOT OIL base turning around last May, while oil was struggling to turn around.
- The revised data on the SOLID lines say the US-driven sectors are still in full retreat, while oil has been stable since summer.
- It now looks like a more serious local recession that previously indicated. Moving beyond moderate, but not as nearly bad as the raw employment data might indicate
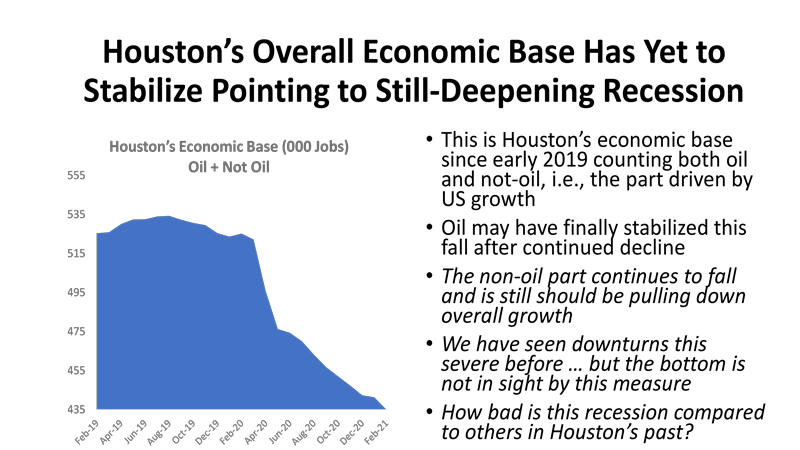
- This chart on the left just add oil and not-oil sectors together – and shows that no trough is in sight yet. How bad is it?
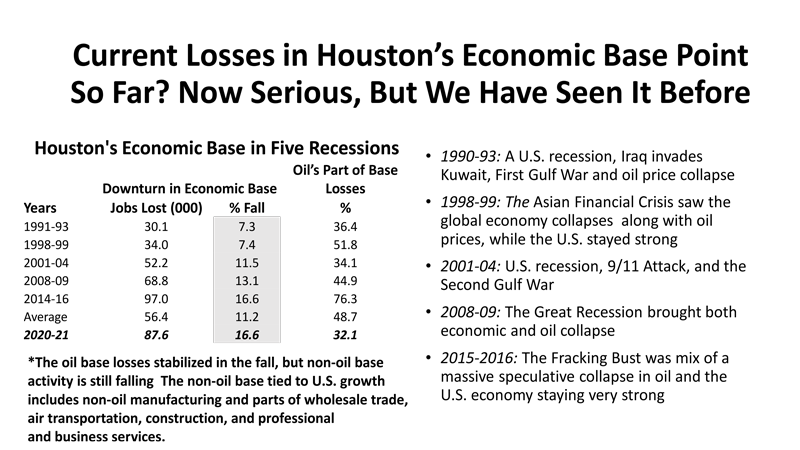
- This is a list of five past downturns back to 1990. We see the number of Houston’s basic jobs lost in each downturn, measured as both the number of jobs and percent fall. And you see the contribution from oil.
- The REVISED figures show 87,600 BASIC jobs now lost at 16.6%. This ties the fracking bust for biggest percent base losses and is worse than 13.3% in Houston during the Great Recession.
- Oil’s contribution is now a historically small 32.1%
- Two points: (1) this is a serious downturn now BUT (2) it is not nearly as bad as the raw employment data would tell us.
Recovery Underway for the Latest Oil Downturn ... But Then A Smaller Oil Industry Going Forward
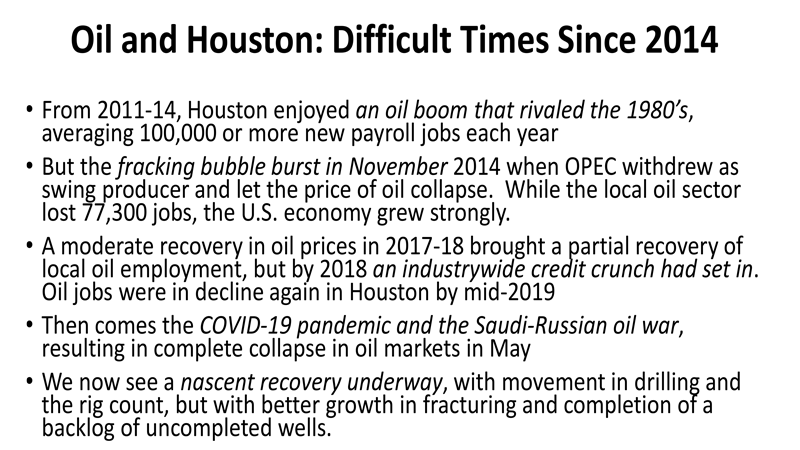
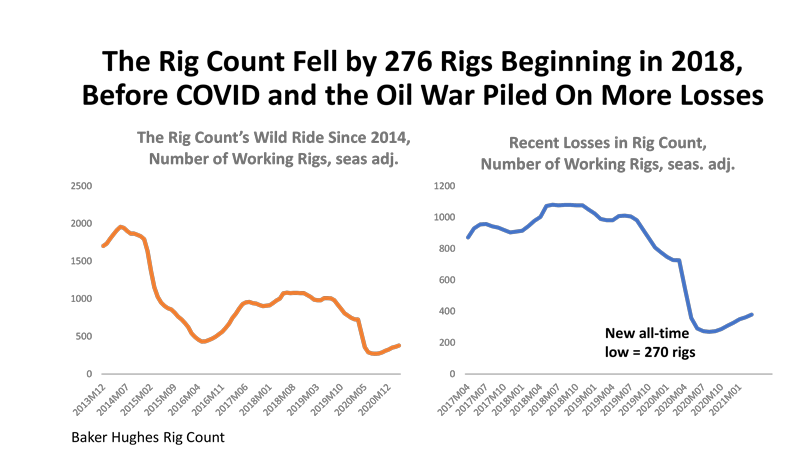
- The gold standard for measuring activity in the oil fields has been the rig count for decades – the best guide to supplier activity and employment.
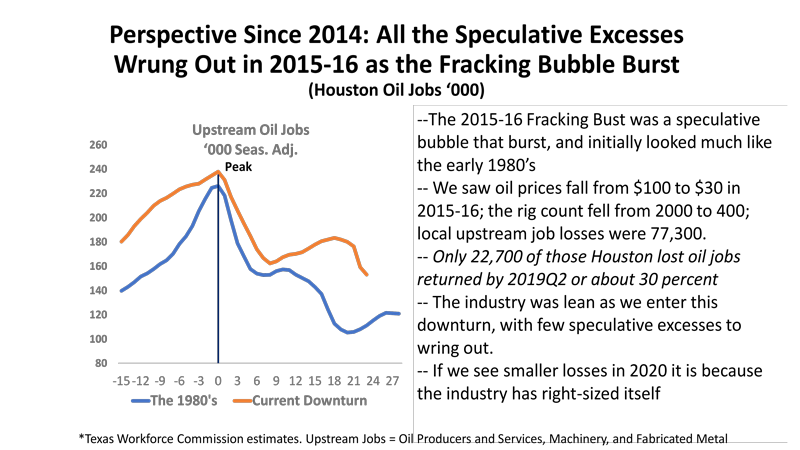
- The chart on the left shows the long decline from 2000 working rigs in 2014, to all-time lows in 2016, and then a new all-time low in of 270 in August 2020.
- Recovery has been steady but slow. We are still not back to a March average of 400 rigs if seasonally adjusted.
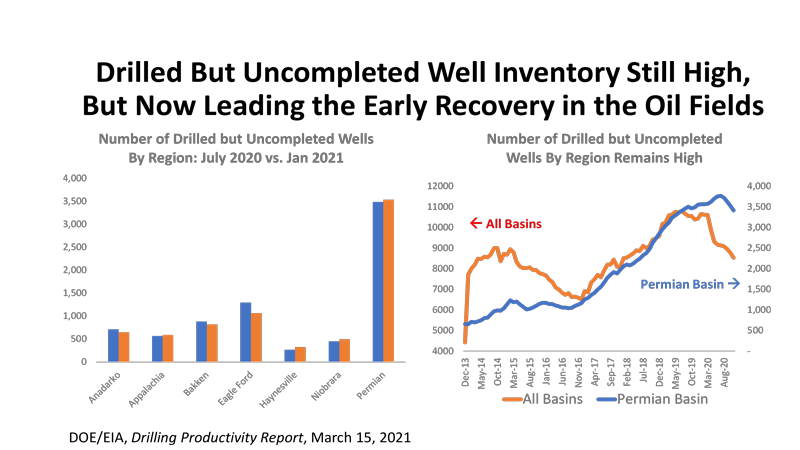
- There is a competitor to the rig count for activity. Fracking is a two-step process of (1) drilling and (2) fracturing and completion. Both take a about the same amount of resources and cash and can occur weeks or months apart depending on scheduling.
- The COVID crisis left a large backlog of drilled but uncompleted wells (DUCs) and it makes sense to turn to this backlog before drilling in many cases. Just use the DUCS to replace or expand reserves since half the cost is already incurred – and a surge was expected.
- The number of DUCS has declined by a couple of thousand – but mainly outside the Permian Basin. It has not outstripped drilling activity as expected.
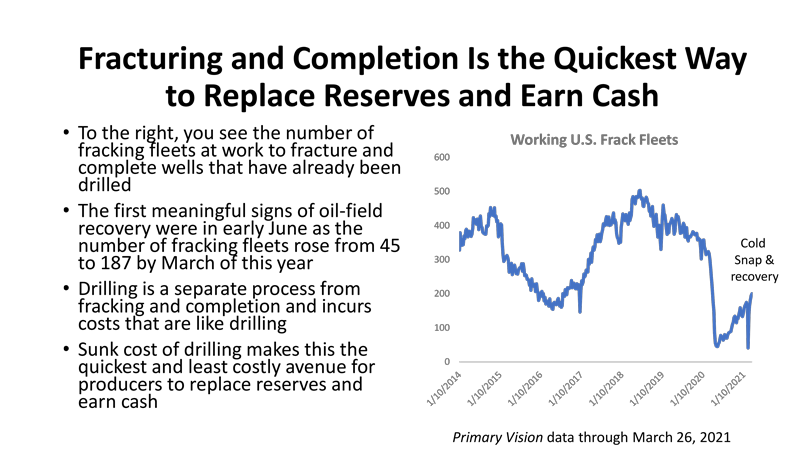
- To go with the DUCs there is a second measure of oil-field activity that is a count of the number of working “frack fleets” or frack spreads” that carry out the completion of the DUCs.
- This measure shows a slow and partial recovery again, but 40% of the previous 2018 peak is back. Contrary to expectations, by this same measure, about 40% of the 2018 rig count is also back. There has not been the powerful and expected turn to “DUCS first.”
We are seeing a slow but steady recovery in the oil fields. In March, it was still at all-time record low levels of activity measure by pre-pandemic performance. But making progress ...
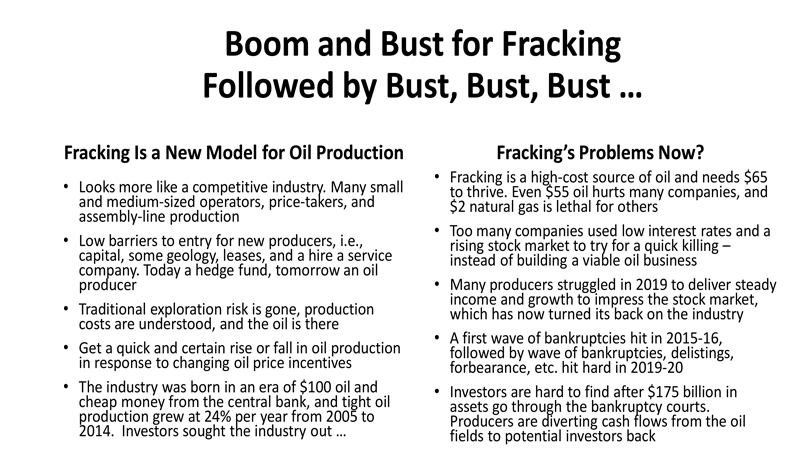
- However, the industry has now taken $175 billion in assets through bankruptcy in recent years. Investors have moved beyond the fool-me-twice stage and this capital-intensive industry will have to make major changes to its financial model to bring investors back.
- These changes ultimately mean a smaller and more focused industry. Oil will have less impact on Houston for years to come
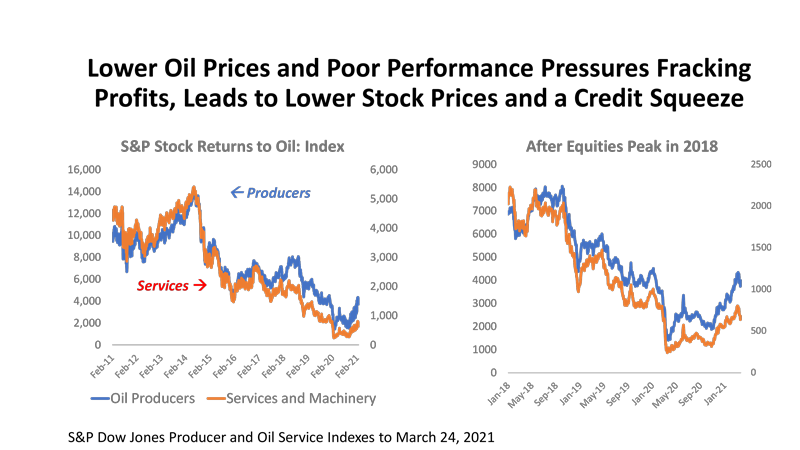
- The stock market turned its back on the fracking industry 2018. in 2018 It was simply acceptance of the fact that the industry has not delivered the returns expected.
- Equity is a small part of the industry financing – but a good indicator of general sentiment
- The left side of the chart is the recent history of stock prices for US oil producers and for the oil service and machinery industry. Their stock is currently valued at levels that are well below the worst periods of 2015-2016. This is for producers and oil services alike.
- On the right side you see that the one-two punch of lower oil prices and tighter credit followed by the COVID crisis. The recent turn up in equity values is general market momentum plus higher oil prices.
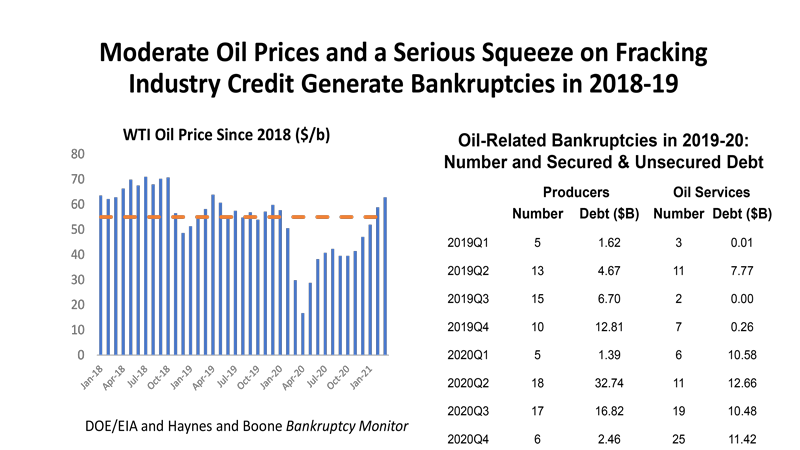
- It is important to remember that serious fracking financial problems were underway beginning in 2018: (1) OPEC had adopted a strategy of holding oil price near $55 to at least slow the rate at which U.S. producers were stealing their market share, (2) the Fed was actively raising interest rates, and (3) bankruptcy and other signs of financial distress returned in 2019
- COVID proved to be yet another financial disaster for the industry
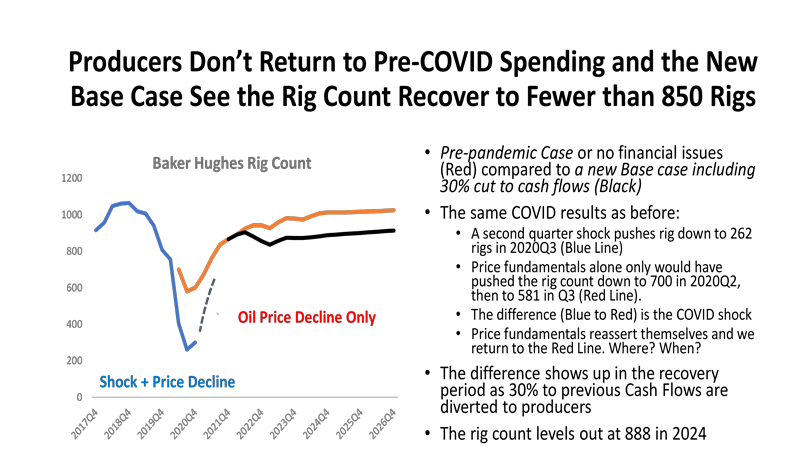
- What is an industry to do? It is highly capital intensive, and it needs cash and investors. What it has proposed is to divert large amounts of cash to potential investors. This is cash that otherwise would have gone to drill and produce more oil, or hire oil workers, and to see oil-related activity support the Houston economy
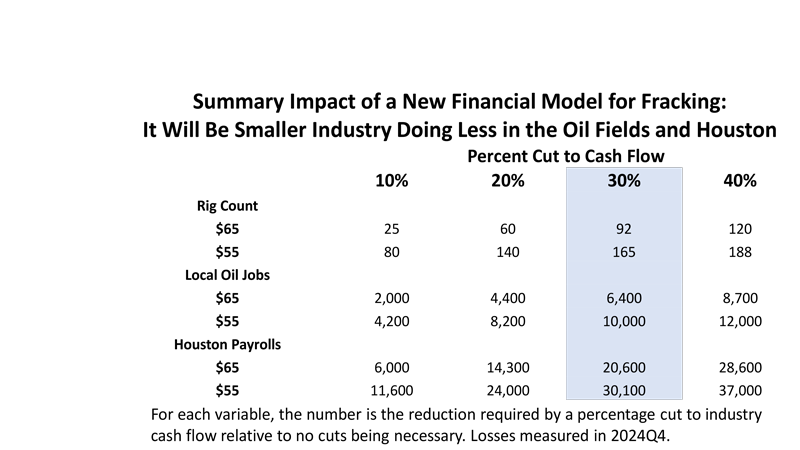
- It will be a smaller industry if it must pay potential investors heavily. How much smaller if 10% of cash flows are diverted to inventors? 20% 30% or 40%?
- We will use 30% cut to cash flow for our forecast. At 30% in this example, if OPEC chooses to target $65 oil after the oil fields begin to return to normal, there will92 fewer rigs at work, 6,400 fewer oil workers in Houston, and 20,600 fewer workers on Houston payrolls.
- These are not losses to a downturn or oil price changes that come and go. This is a permanent loss of rigs and jobs that has nothing to do with the business cycle. It is a different industry now at work.
- If OPEC goes back to targeting $55? A loss of 165 rigs, 10,000 local oil workers and 30,100 jobs?
No — not layoffs and workers sent home. These are jobs that never return and the oil recovery gets into full swing here in Houston
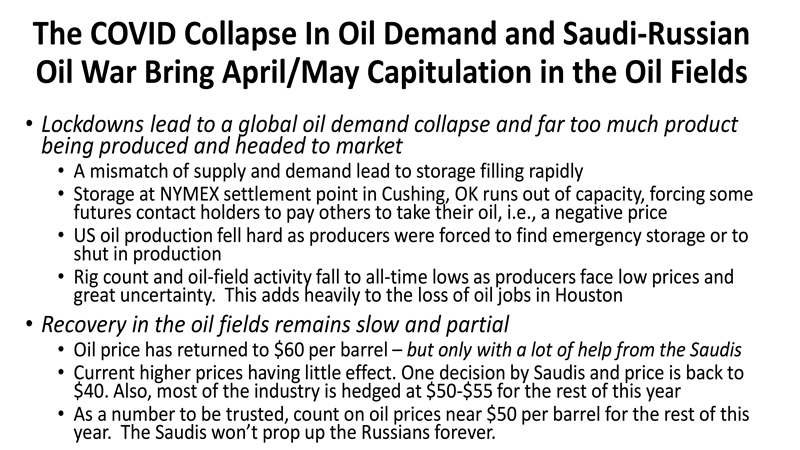
The Global Economy? It Is Mostly About COVID, Too
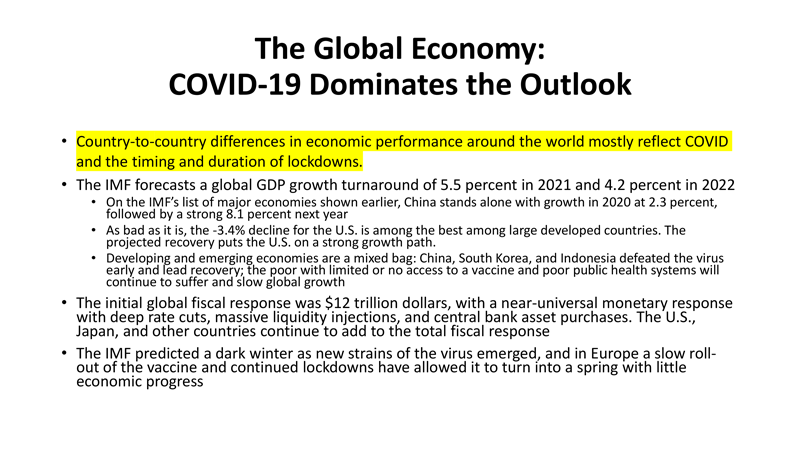
- Country-to-country differences in economic performance around the world mostly reflect COVID and the timing and duration of lockdowns.
- That is about what there is to say about the global economy. It is a collection of fishing line charts and the local response.
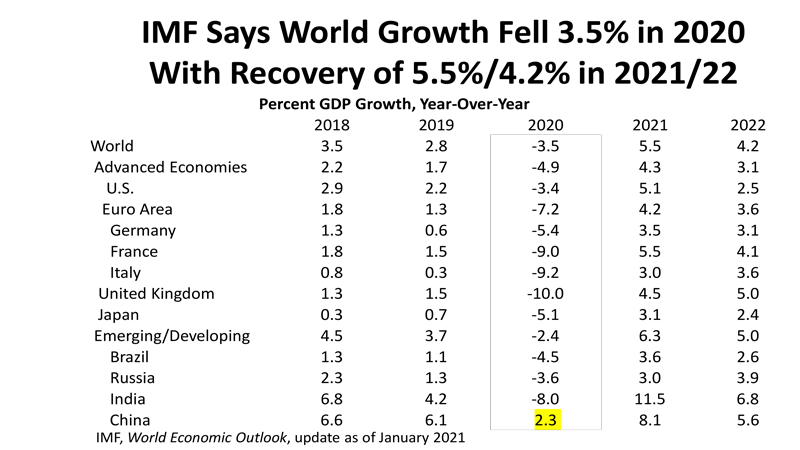
- There is broad recovery global ahead
Outlook for Houston: All the Guesswork Pulled Together
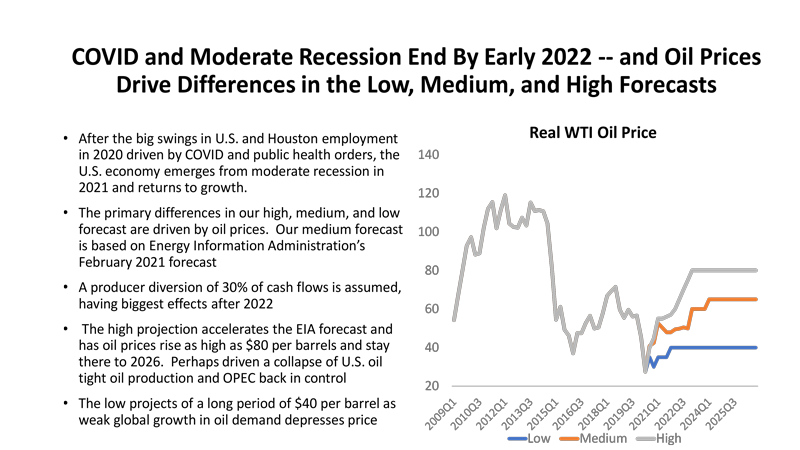
- The medium forecast is based on the DOE February forecast. This assumes a slow and subpar recovery due to low prices through 2022. After 2022 producers are assumed to cut cash flows by 30% for spending and to cut production.
- The current high oil prices are not included in the forecast. First, they are unlikely to last as OPEC+ producers are already breaking ranks. Second, the current high prices are ineffective since most producers hedged early in the year at $50-$55
- Highs and lows are just planning assumptions based on $40 and $80. What is the range of very good to continued tough times in the economy? Oil prices can always provide and easy answer to that question in Houston.
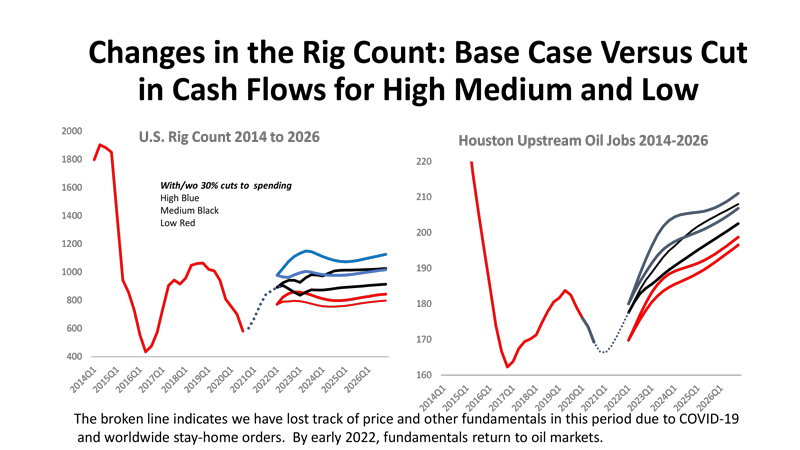
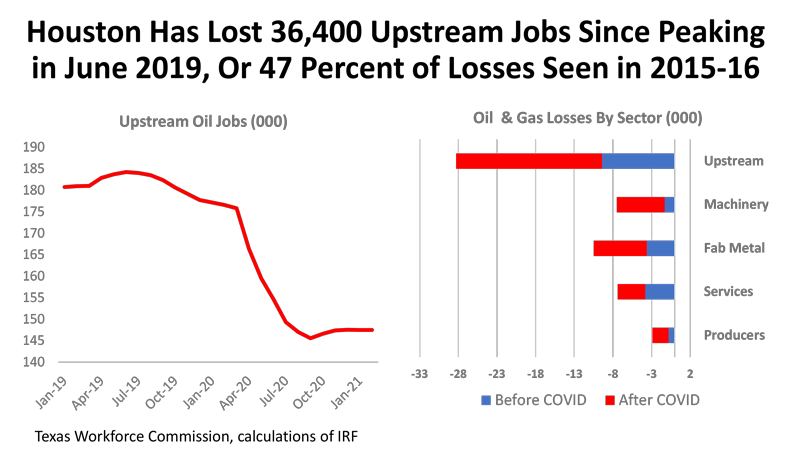
Given oil prices, this is the rig count forecast (high, medium, and low and with/without the fall cuts in oil production) and the same for upstream oil employment in Houston. There is an urban myth that oil jobs never return once lost. Not true. After all, how did we reach record oil employment in 2014?
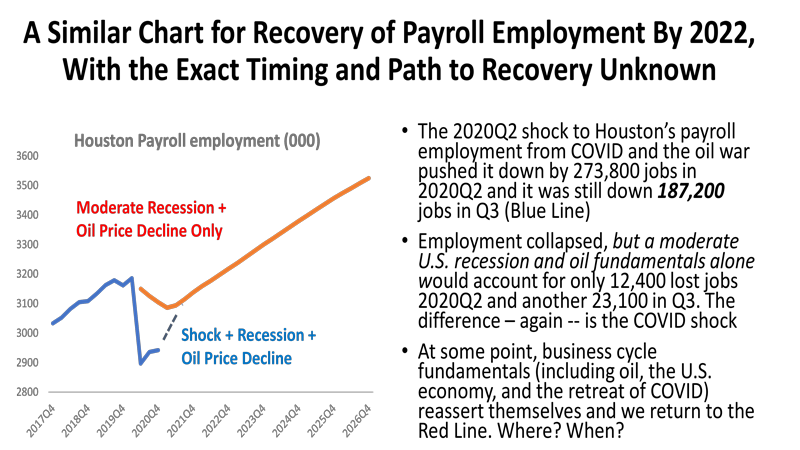
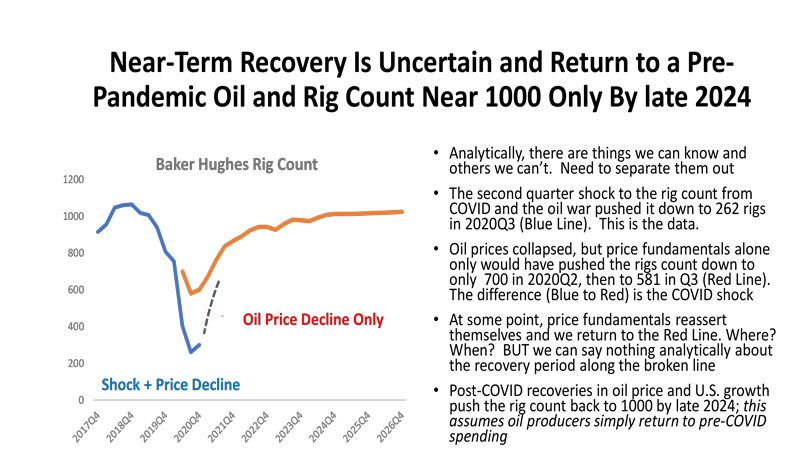
The problem is that we know where we are on the blue line – it is history. If we assume fundamentals of Houston employment reassert themselves as the virus recedes, and we will return to the red line – at some unknown time and point. The virus still has some control for the rest of this year making it impossible to know the pace. WE ASSUME that the economy reasserts control before 2022Q2.
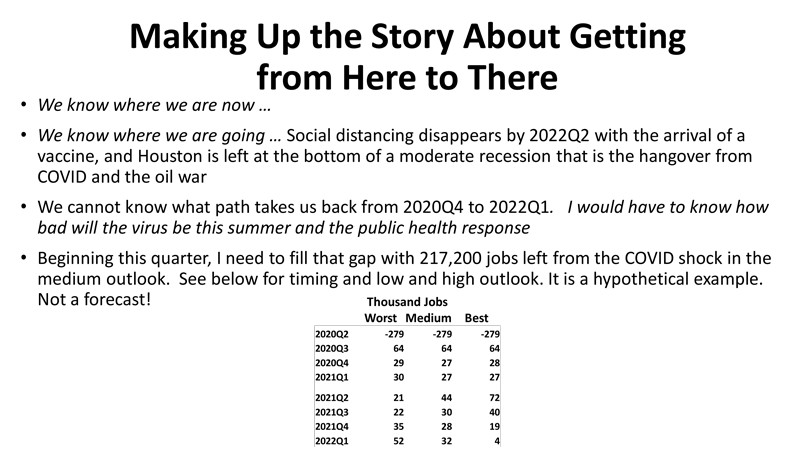
Because de do not and cannot know exactly what happens in the next few quarters leading up to 2022Q2, we have some high/low scenario as the economy brings back the COVID-sensitive jobs more or less quickly
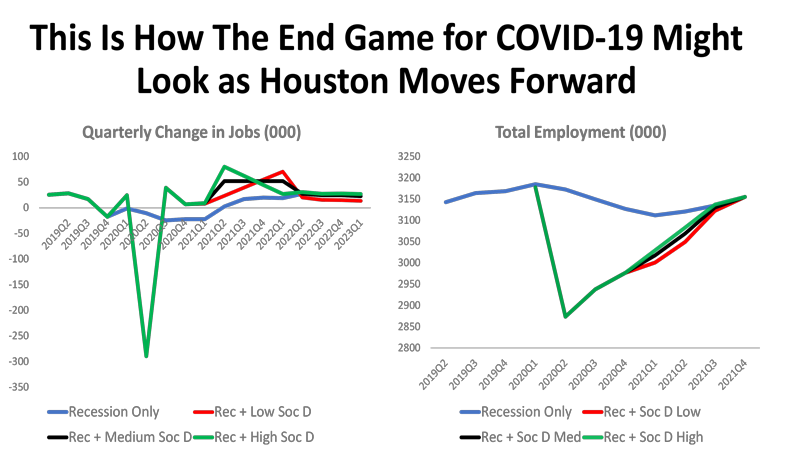
This is how the hypothetical numbers in the previous chart would fill in the blank spaces as high, medium and low examples. Quarter-to-quarter change on the left, and total employment on the right.
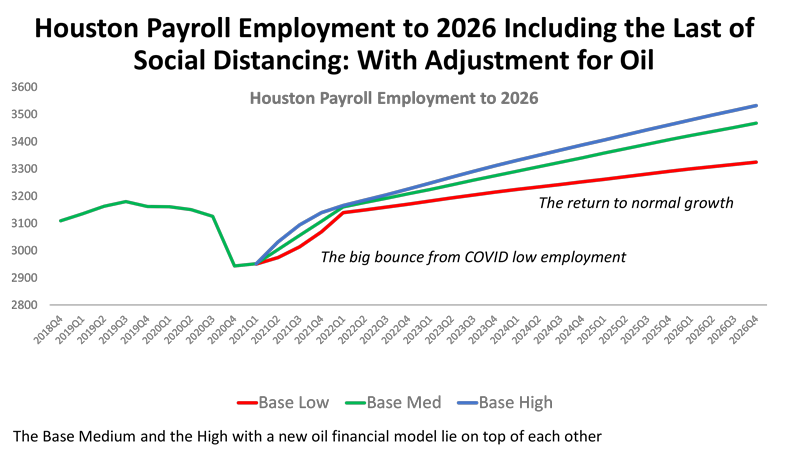
Extend our forecast out to 2026 and this the outlook. The interim guess at the very near-term is the bubble on the left as we bring back COVID jobs, then a normal Houston growth path as we move forward.
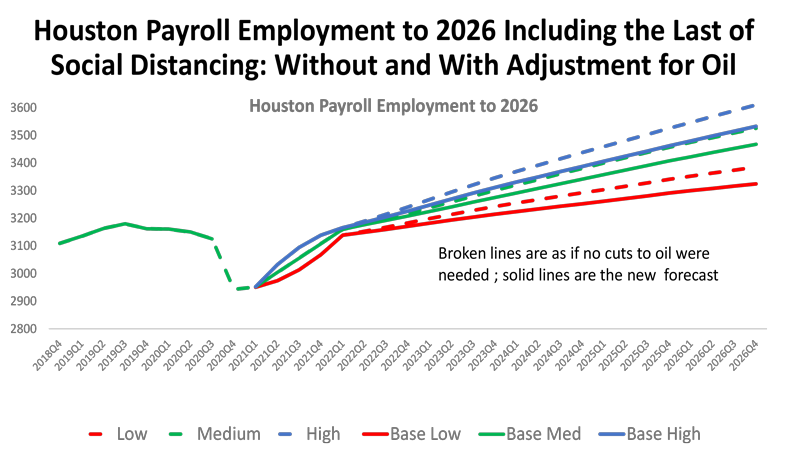
The chart in #50 included the cuts in the fracking industry outlook. The broken lines in this chart shows what was lost to oil in the long-term outlook. This loss is to a smaller oil industry – not to lower oil prices, a new administration or peak oil. Just to a new financial model in oil.
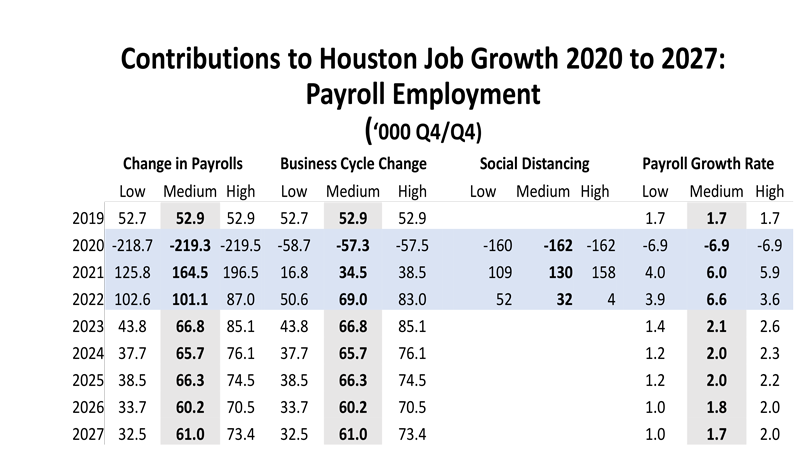
This chart shows our forecast for job growth for Houston based on these charts. The first three columns are total payrolls divided into the part driven by the business cycle (the local economic base performance) and the return of the jobs that hostage to the virus and tied to reactive social distancing or to continued public orders and required social controls.
- After losing an estimated 162,000 jobs to reactive or mandatory social distancing in 2020 we see 130,000 return this year as the vaccine takes effect. Another 32,000 return in 2022Q1.
- These numbers sound great but are just taking people off unemployment. It is recovery and not growth.
- The business cycle turns in the middle of this year, bringing back many of the base jobs as Houston’s economic drivers turn upward along with the rest of the U.S. and 34,000 jobs return here. The total increase is 162,000. Still trying to complete recovery.
- In 2022, 32,000 social-distancing jobs return, the local business cycle is still at work as the non-oil base works, and oil begins a substantial recovery in 2022 as well. The result is a solid and far above trend year of 101,000 jobs. Recovery is complete, and Houston expanding above pre-pandemic levels.
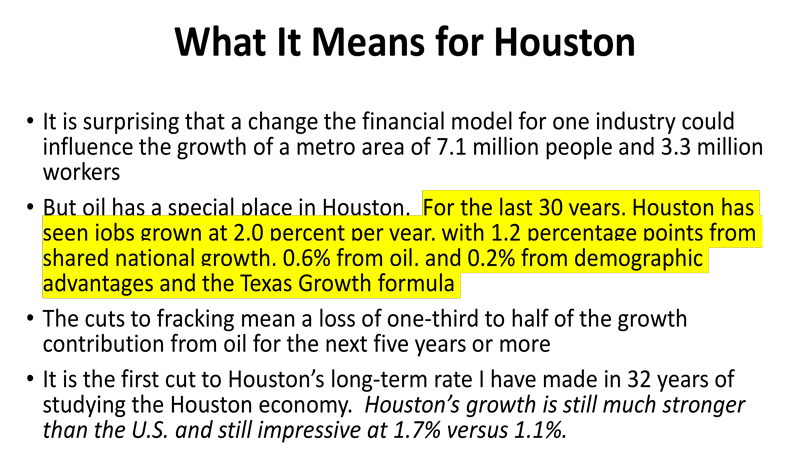
- The economy then slowly settles into a long-term growth rate of around 60,000 jobs or 1.7%. This is well below Houston’s long-term growth rate of 2.0% and — before the financial damages done to fracking – we would be growing at 70,000 jobs per year or better.
Written by Dr. Robert W. “Bill” Gilmer
April 1, 2021
University of Houston
C. T. Bauer College of Business
Institute for Regional Forecasting