Houston Updates
-
Archive
- June 2025
- March 2025
- December 10, 2024
- September 14, 2024
- May 21, 2024
- March 19, 2024
- December 9, 2023
- June 16, 2023
- April 6, 2023
- March 17, 2023
- Dec. 19, 2022
- Sept. 14, 2022
- July 4, 2022
- March 27, 2022
- March 9, 2022
- September 2021
- April 2021
- March 2021
- September 2020
- August 2020
- June 2020
- April 2020
- March 2020
- January 2020
- December 2018
- June 2018
- March 2018
- February 2018
- January 2018
- September 2017
- September 2017 Post-Hurricane
- June 2017
- March 2017
- January 2017
- September 2016
- March 2016
- December 2015
- September 2015
- June 2015
- March 2015
- December 2014
- June 2014
- March 2014
- November 2013
- September 2013
Revised Employment Data Confirm Houston's Slow-Growth Trajectory
March 10, 2016
The most timely and comprehensive data on the Houston economy is the payroll employment report. This monthly release tracks overall job growth, but also provides significant industrial detail on the local economy. Always an essential tool for monitoring local economic trends, it takes on added importance in times of economic stress such as Houston is currently experiencing.
On March 4, the Texas Workforce Commission issued revised payroll employment figures for the Houston metropolitan area. This is a significant reworking of past estimates, extending back to early 2014 for most industries. Table 1 shows that total 2014 growth was revised up from 104,700 new jobs measured December to December, to 117,800 jobs. These impressive numbers almost certainly mark the last hurrah of the shale boom in Houston, a period of strong, oil-driven job growth that began in 2004.
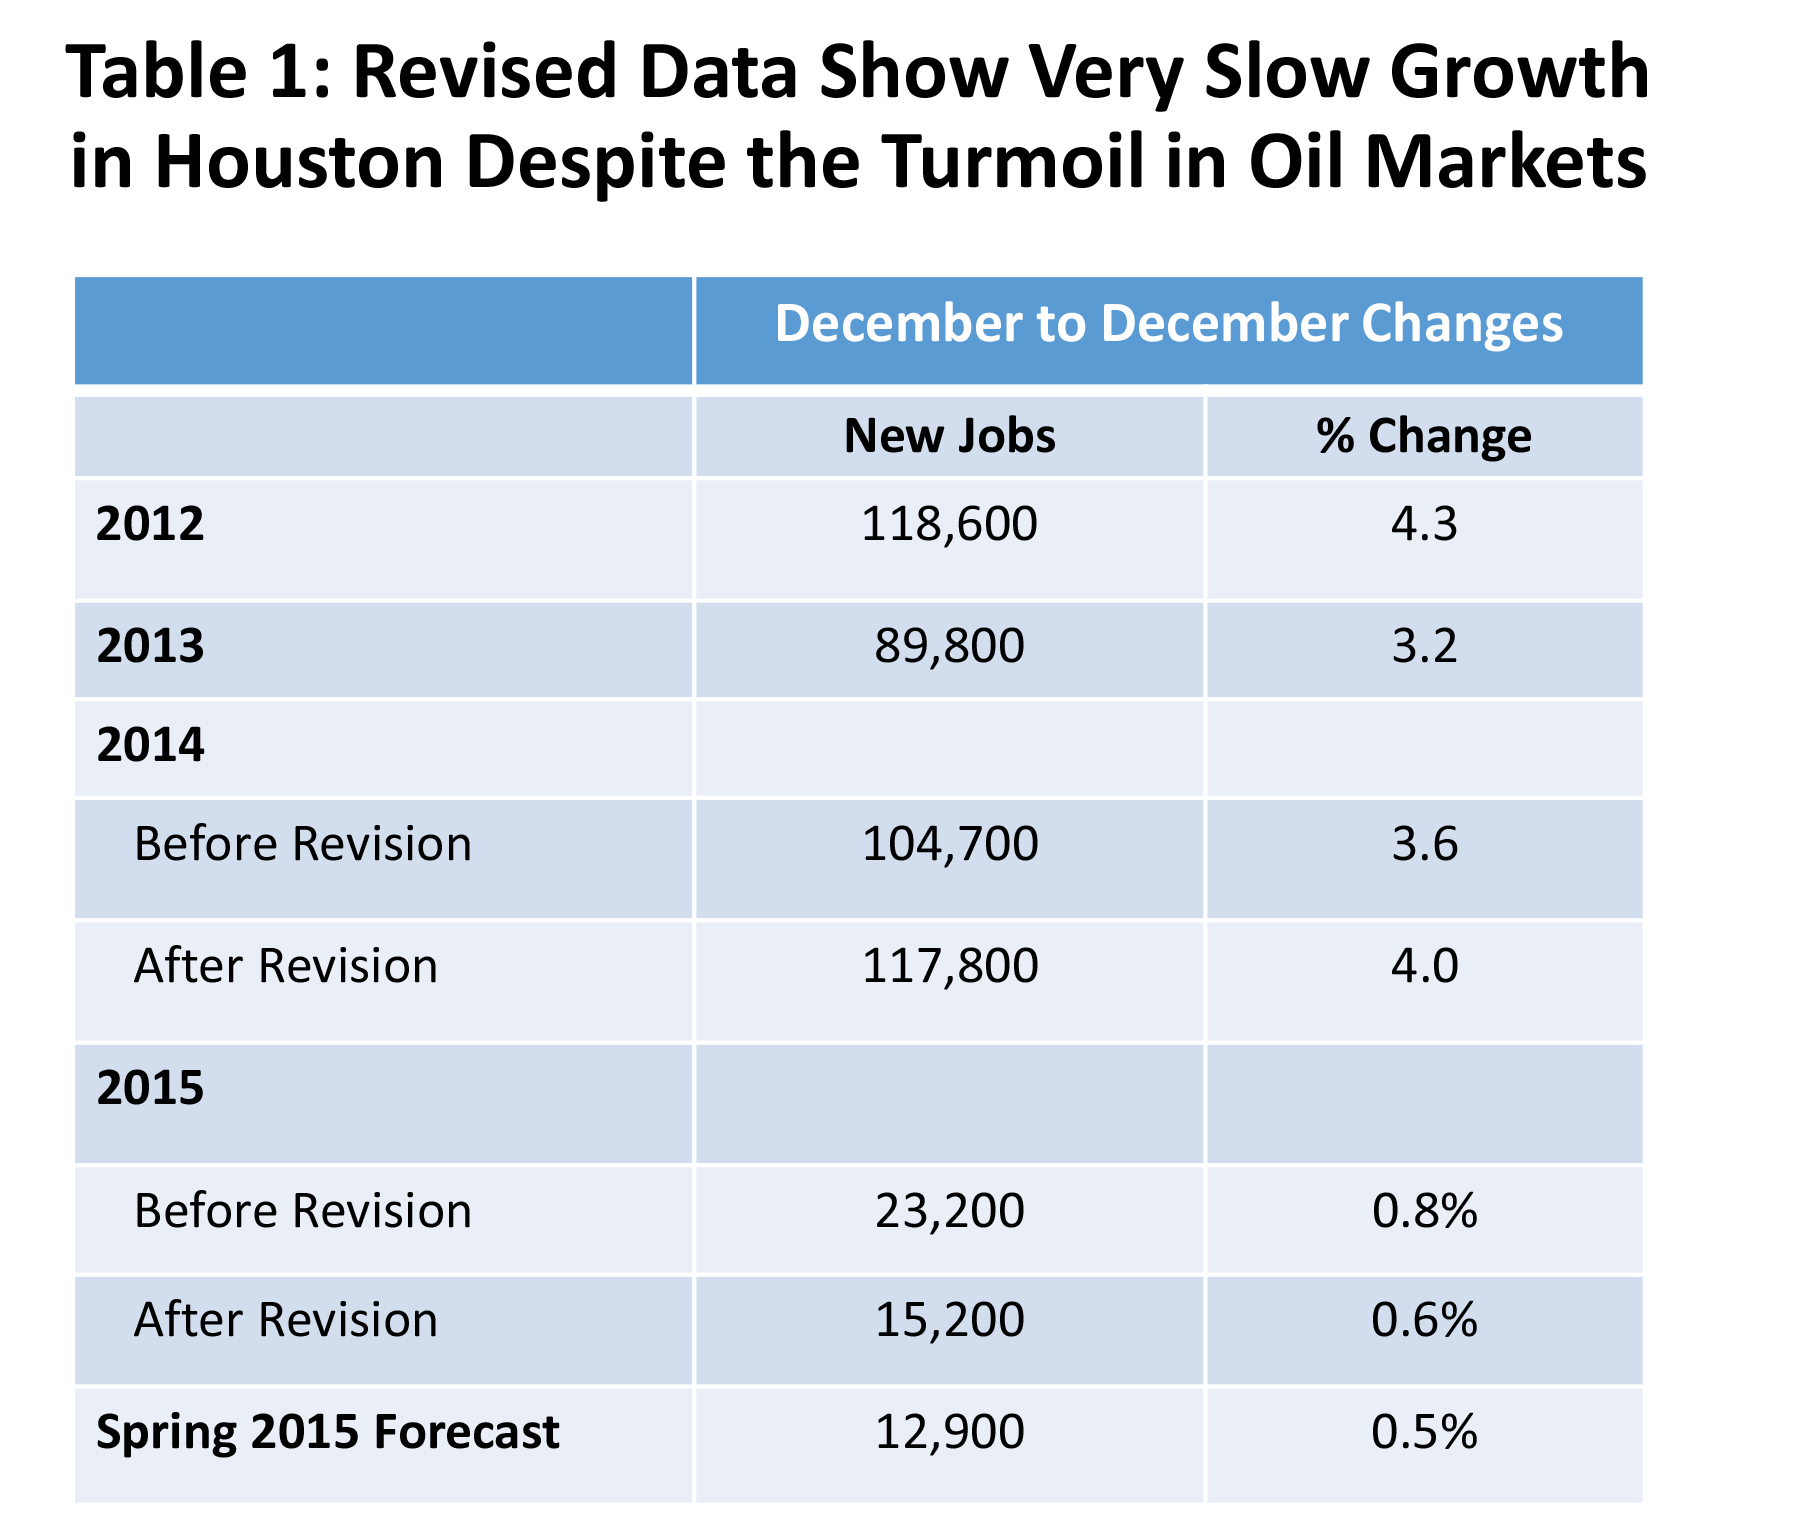
The overall revision to 2015 total employment was small, pushing job growth down to 15,200 jobs from the prior estimate of 23,200. These headline changes are in line with expectations that a combination of strong U.S. expansion and an eastside petrochemical construction would be just enough to keep Houston growing – even in the face of low oil prices. That fundamental story remains intact.
Why revisions?
The payroll employment data reported for Houston are part of the Current Employment Statistics Survey carried out by the Bureau of Labor Statistics (BLS) in conjunction with state agencies such as the Texas Workforce Commission. The initial report is an estimate of the number of business and government employees on payrolls that are covered by unemployment insurance, and as such it does not count farm workers, the self-employed, household workers such as housekeepers or nannies, or unpaid family members.
The monthly report is based on a survey of 146,000 businesses and over 600,000 worksites across the nation, and it is designed to provide geographic and industrial detail on employment, hours, and earnings. The sample begins to look much smaller, however, once we realize that it is meant to cover 50 states and 450 metropolitan areas, and smaller again if industrial detail is considered. In Houston, for example, employment detail is provided for 77 individual sectors.
The revisions to the data stem from the fact that we begin with an estimate of the number of workers eligible for unemployment insurance that is based strictly on a sample of employers. But over the following 6 or 7 quarters, administrative records slowly accumulate that will give us a very accurate count of the number of payroll employees, so the initial estimates are ultimately replaced by a definitive number. The first post-sample count is typically available about 12-14 weeks after the initial published estimate. In early March of each year, BLS and the Texas Workforce Commission stop the sampling, look back at the new administrative records that have accumulated over the prior 12 months, revise the prior sample-based estimates, and restart the sampling from a newly revised employment level. These revisions are often referred to as the annual benchmarking of the payroll employment data. Revisions can be substantial, with times of economic change often bringing the largest revisions, but revisions should move data toward a more accurate count of payroll jobs.
Industry Detail
The fact that Houston is growing slowly might leave the impression that there is simply little economic stimulus at work. Nothing could be further from the truth. Three major events are shaping Houston’s economy right now — two positive and one negative — and growth becomes a question of their relative power, and where the net differences among them finally settles. First, we certainly have the worst drilling downturn since the 1980’s, and by some measures it is the worst oil bust ever. Second, unlike the typical drilling collapse of recent years, this one is not accompanied by U.S. or global recession. Perhaps two-thirds of Houston’s job growth since 1990 has come from broad national economic trends, and the U.S. business cycle continues to work in our favor. Finally, in east Houston, the downstream refining and petrochemical industries are experiencing the greatest construction boom in the history of the Texas and Louisiana Gulf Coast with more than $50 billion in projects underway in Houston alone. Another 10,000 Houston-based construction workers are expected to be hired in 2016.
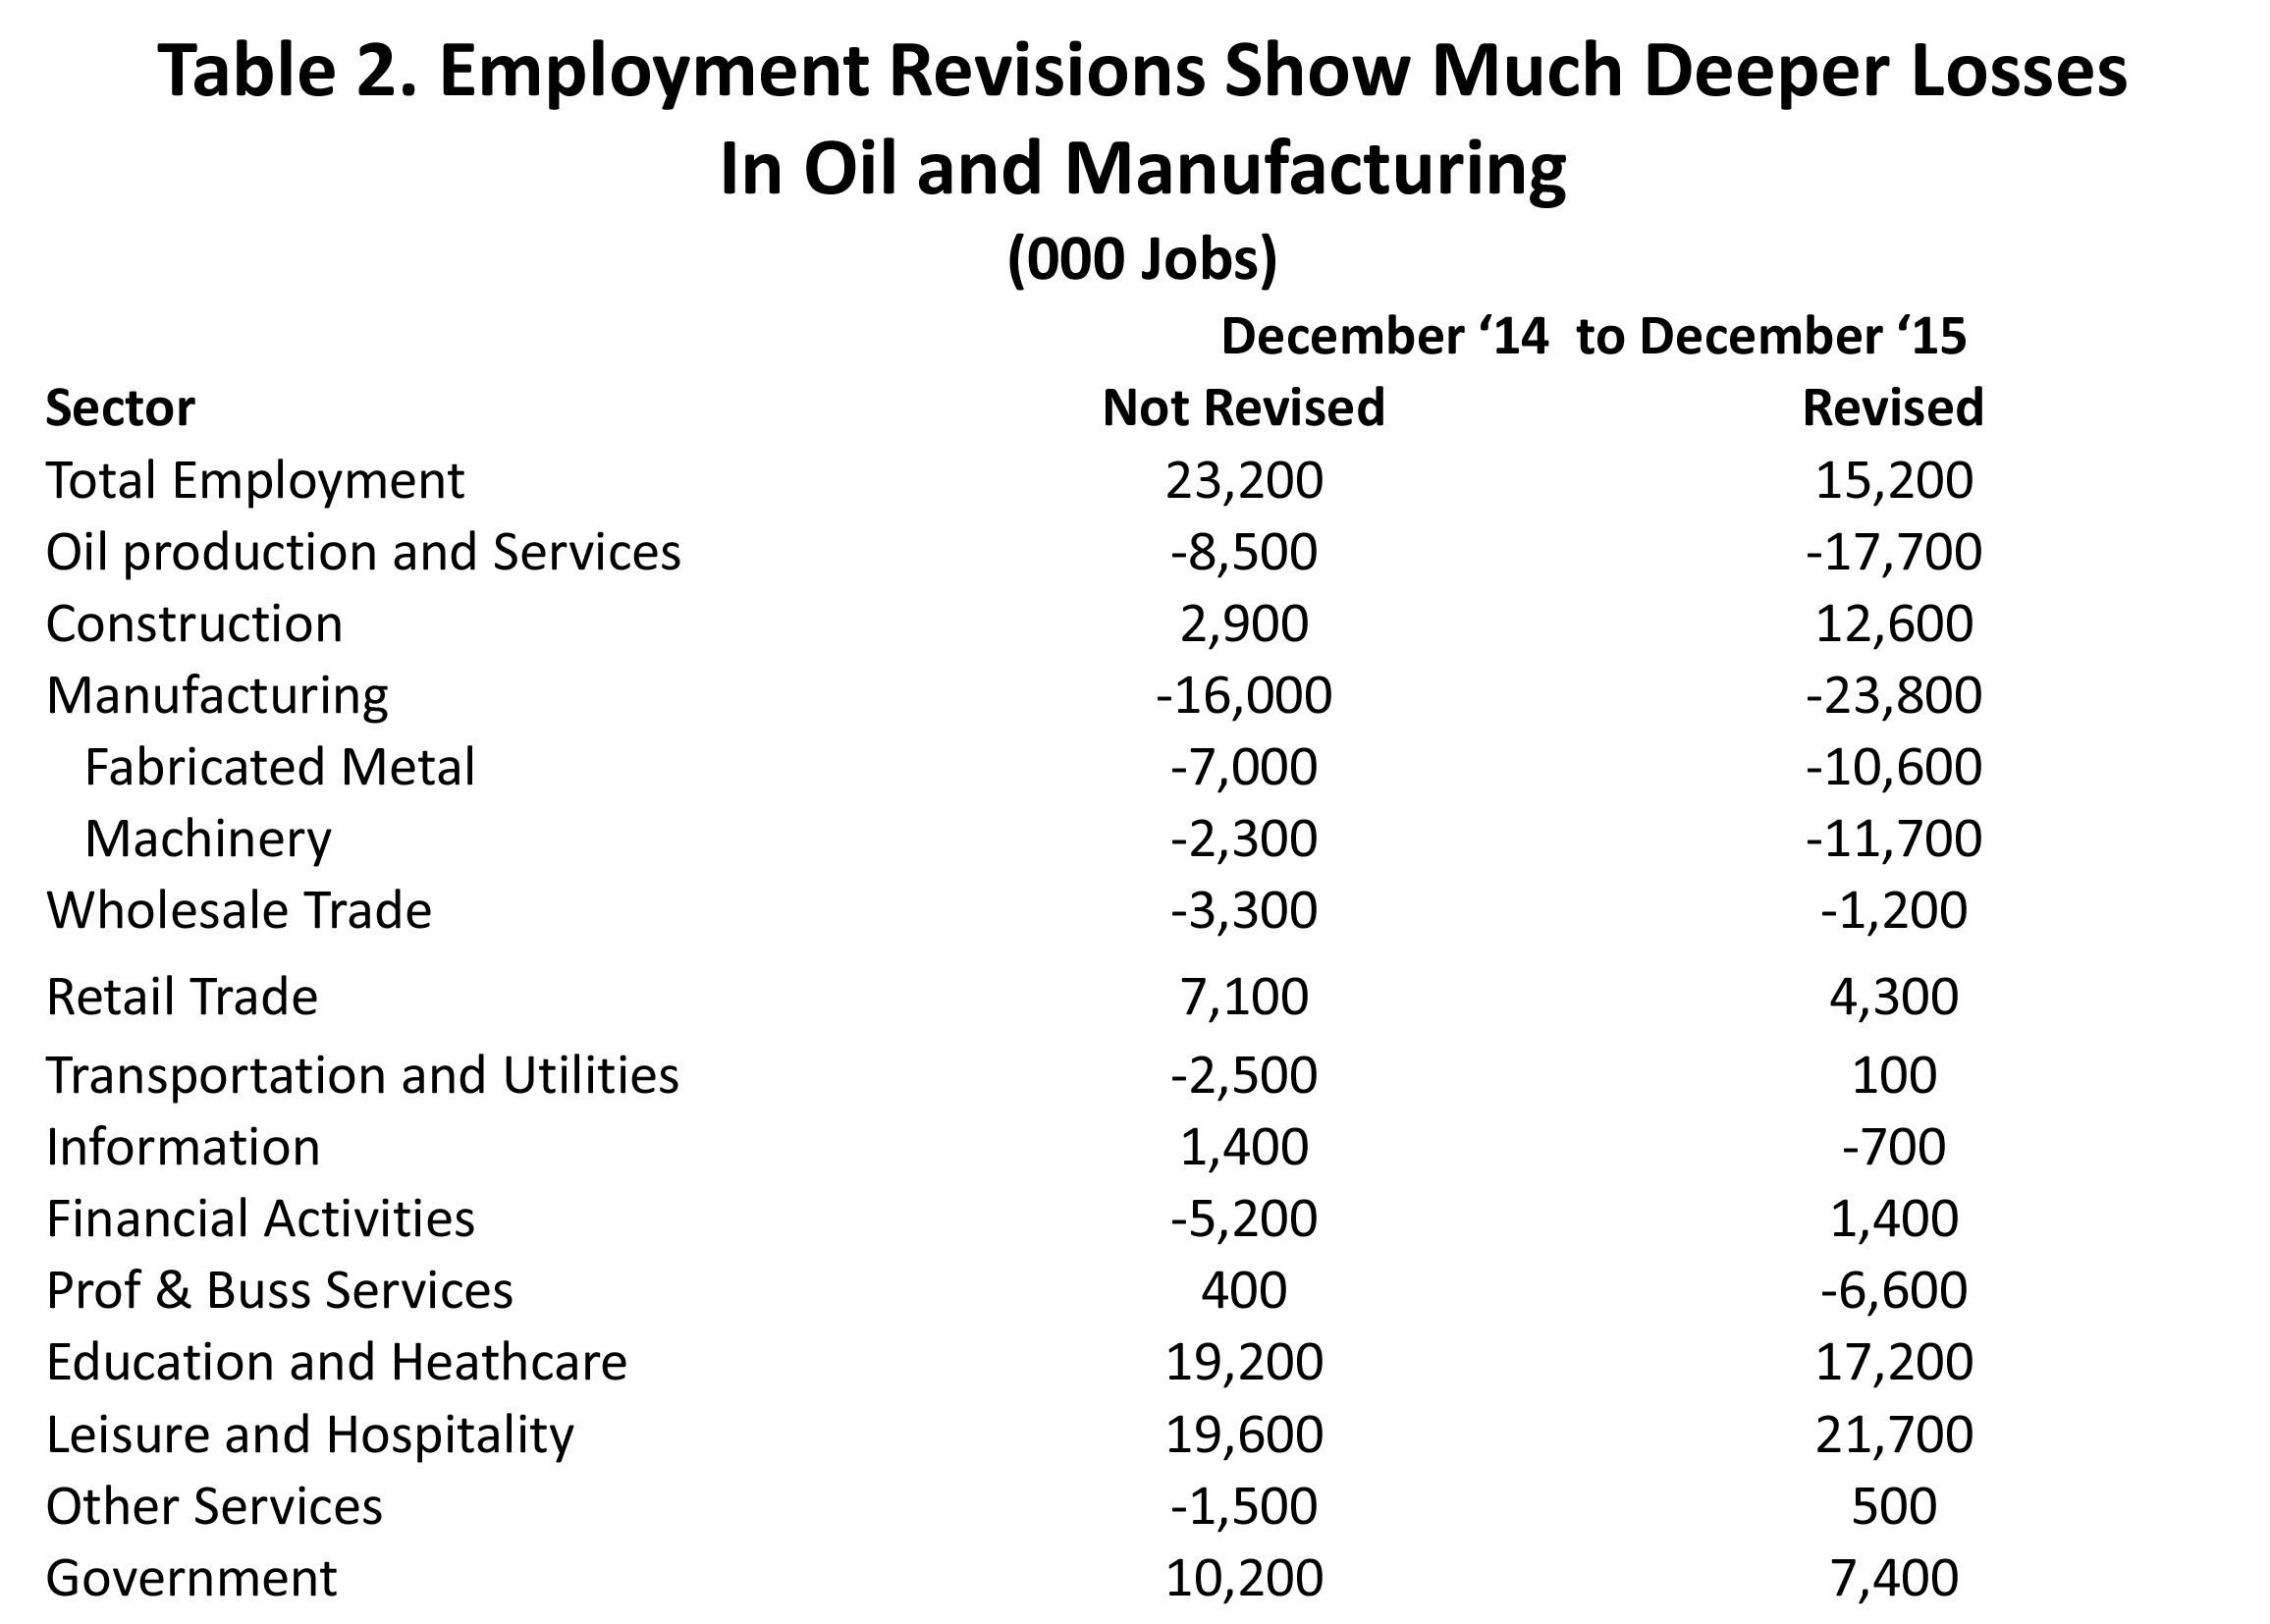
The revised industry detail in Figure 2 reflects the conflicting economic trends at work. First, job losses in oil production and oil services doubled with the revision, from 8,500 to 17,700. Losses in manufacturing rose sharply from 16,000 to 23,800, with over 22,000 jobs lost in energy-related fabricated metal and machinery industries. Machinery had previously been showing a loss of 2,300 jobs, but this was revised up to sharply to 11,700. The 6,600 jobs lost in business and professional services are also probably related to energy. Many of these unemployed workers were likely to have been contractors for oil companies, providing accounting, personnel, engineering, and other support services. It is always easier to lay off contractors and consultants than your own employees, and out-sourcing is a way of life in the cyclical oil industry.
Construction employment data are not reported in such a way that jobs tied to the large chemical, refining and liquefaction projects can be separated out. Oddly enough, to the BLS a refinery or ethylene cracker is just one more “building.” We know that the slowdown in Houston has hurt residential and commercial construction, with fewer new homes built and many apartment and office projects postponed or cancelled. Construction equipment can be seen stacking up in industrial yards all over the city. However, the overall construction employment number for Houston in 2015 was revised up by nearly 10,000 jobs, telling us that the east side industrial projects – so far – have been enough to more than offset the decline in commercial and residential activity.
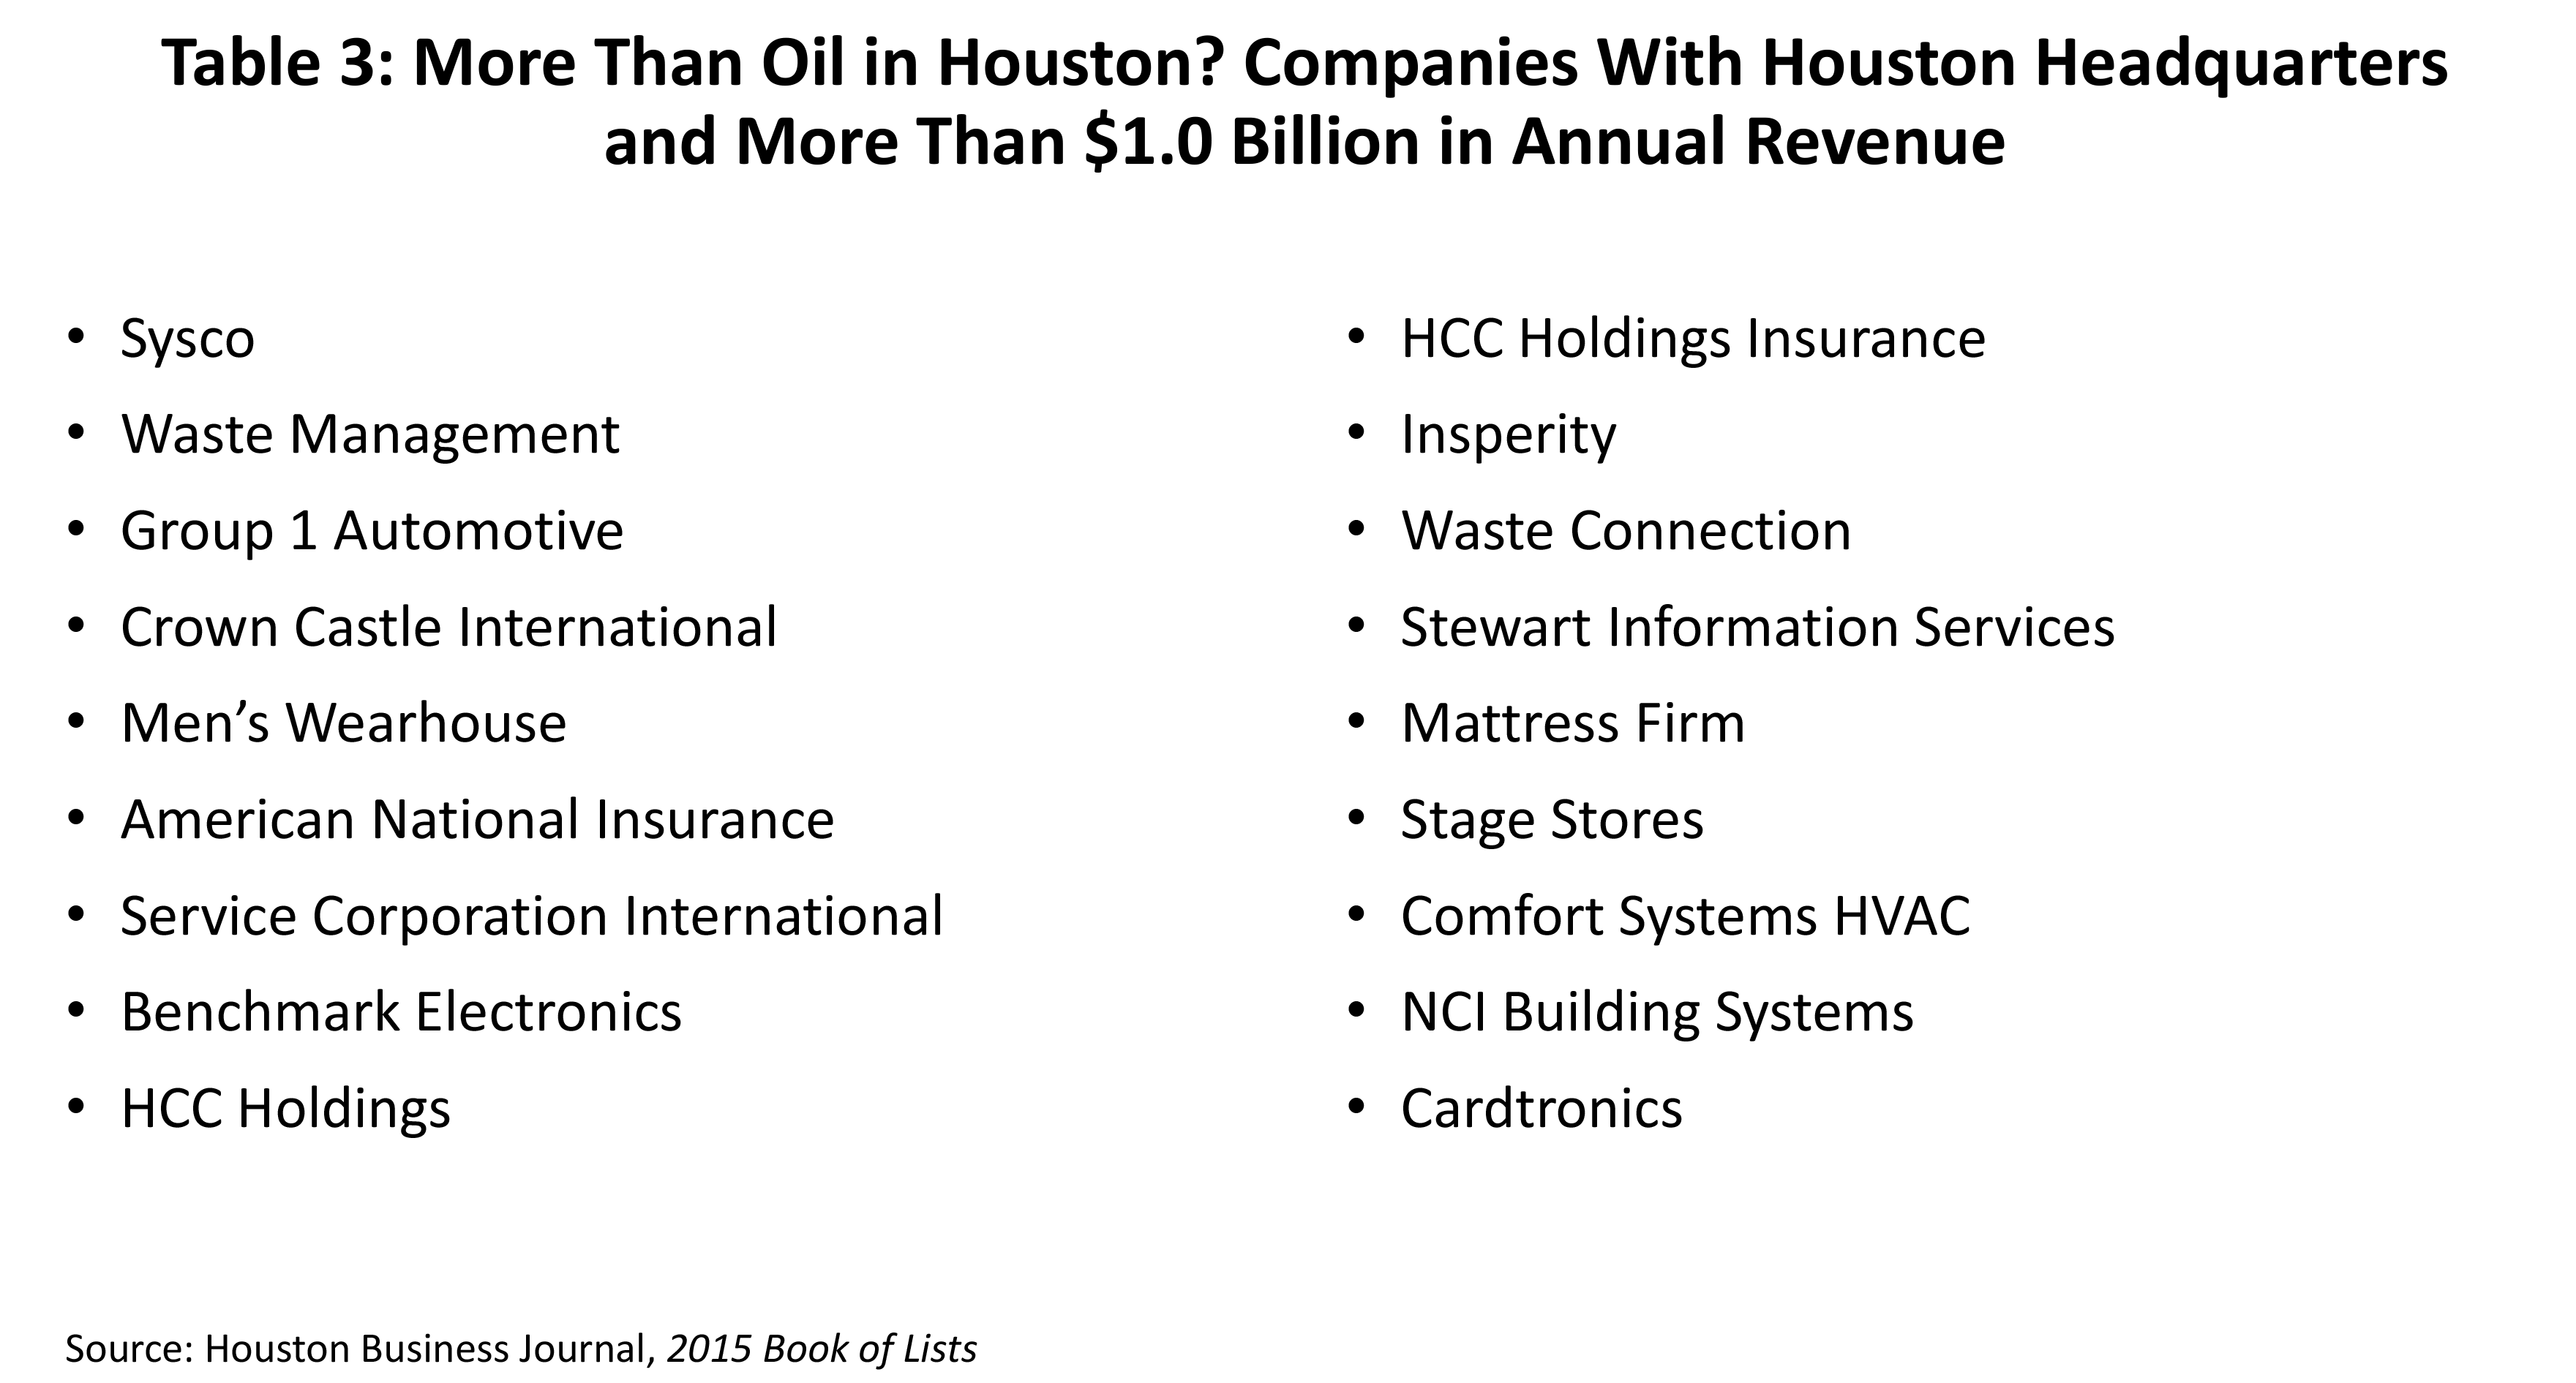
It is hard to isolate the broad role of the U.S. economy in Houston, but right now it provides an important underpinning for local business activity. Table 3 shows a list of local companies that are headquartered in Houston with a billion dollars or more in annual revenue. And many other companies, like United Airlines, HP, or AIG may not be headquartered here, but they maintain a major employment base in the city. Because these companies reach into national markets, they should be largely immune to events in the oil industry, and may even benefit from low oil prices. The continued strength of local sectors such as leisure, healthcare, education, and retail trade should at least partly reflect this support from the national economy.
Where are we now?
So far, 2016 has seen conditions in the oil fields go from bad to worse. Figure 1 compares drilling activity in this downturn to the 2008-09 period, and in both cases the collapse in the number of rigs was on the same downward spiral through last spring. Then drilling conditions stabilized last summer: the price of oil returned to near $60 per barrel, the rig count bottomed out and briefly turned up, and oil-related lay-offs came to a halt. Then in quick succession the Iran Nuclear Agreement was signed in July and the Chinese devalued in August. Then the price of oil tumbled again, and hopes were crushed for a V-shaped turnaround in drilling activity like 2008-09.
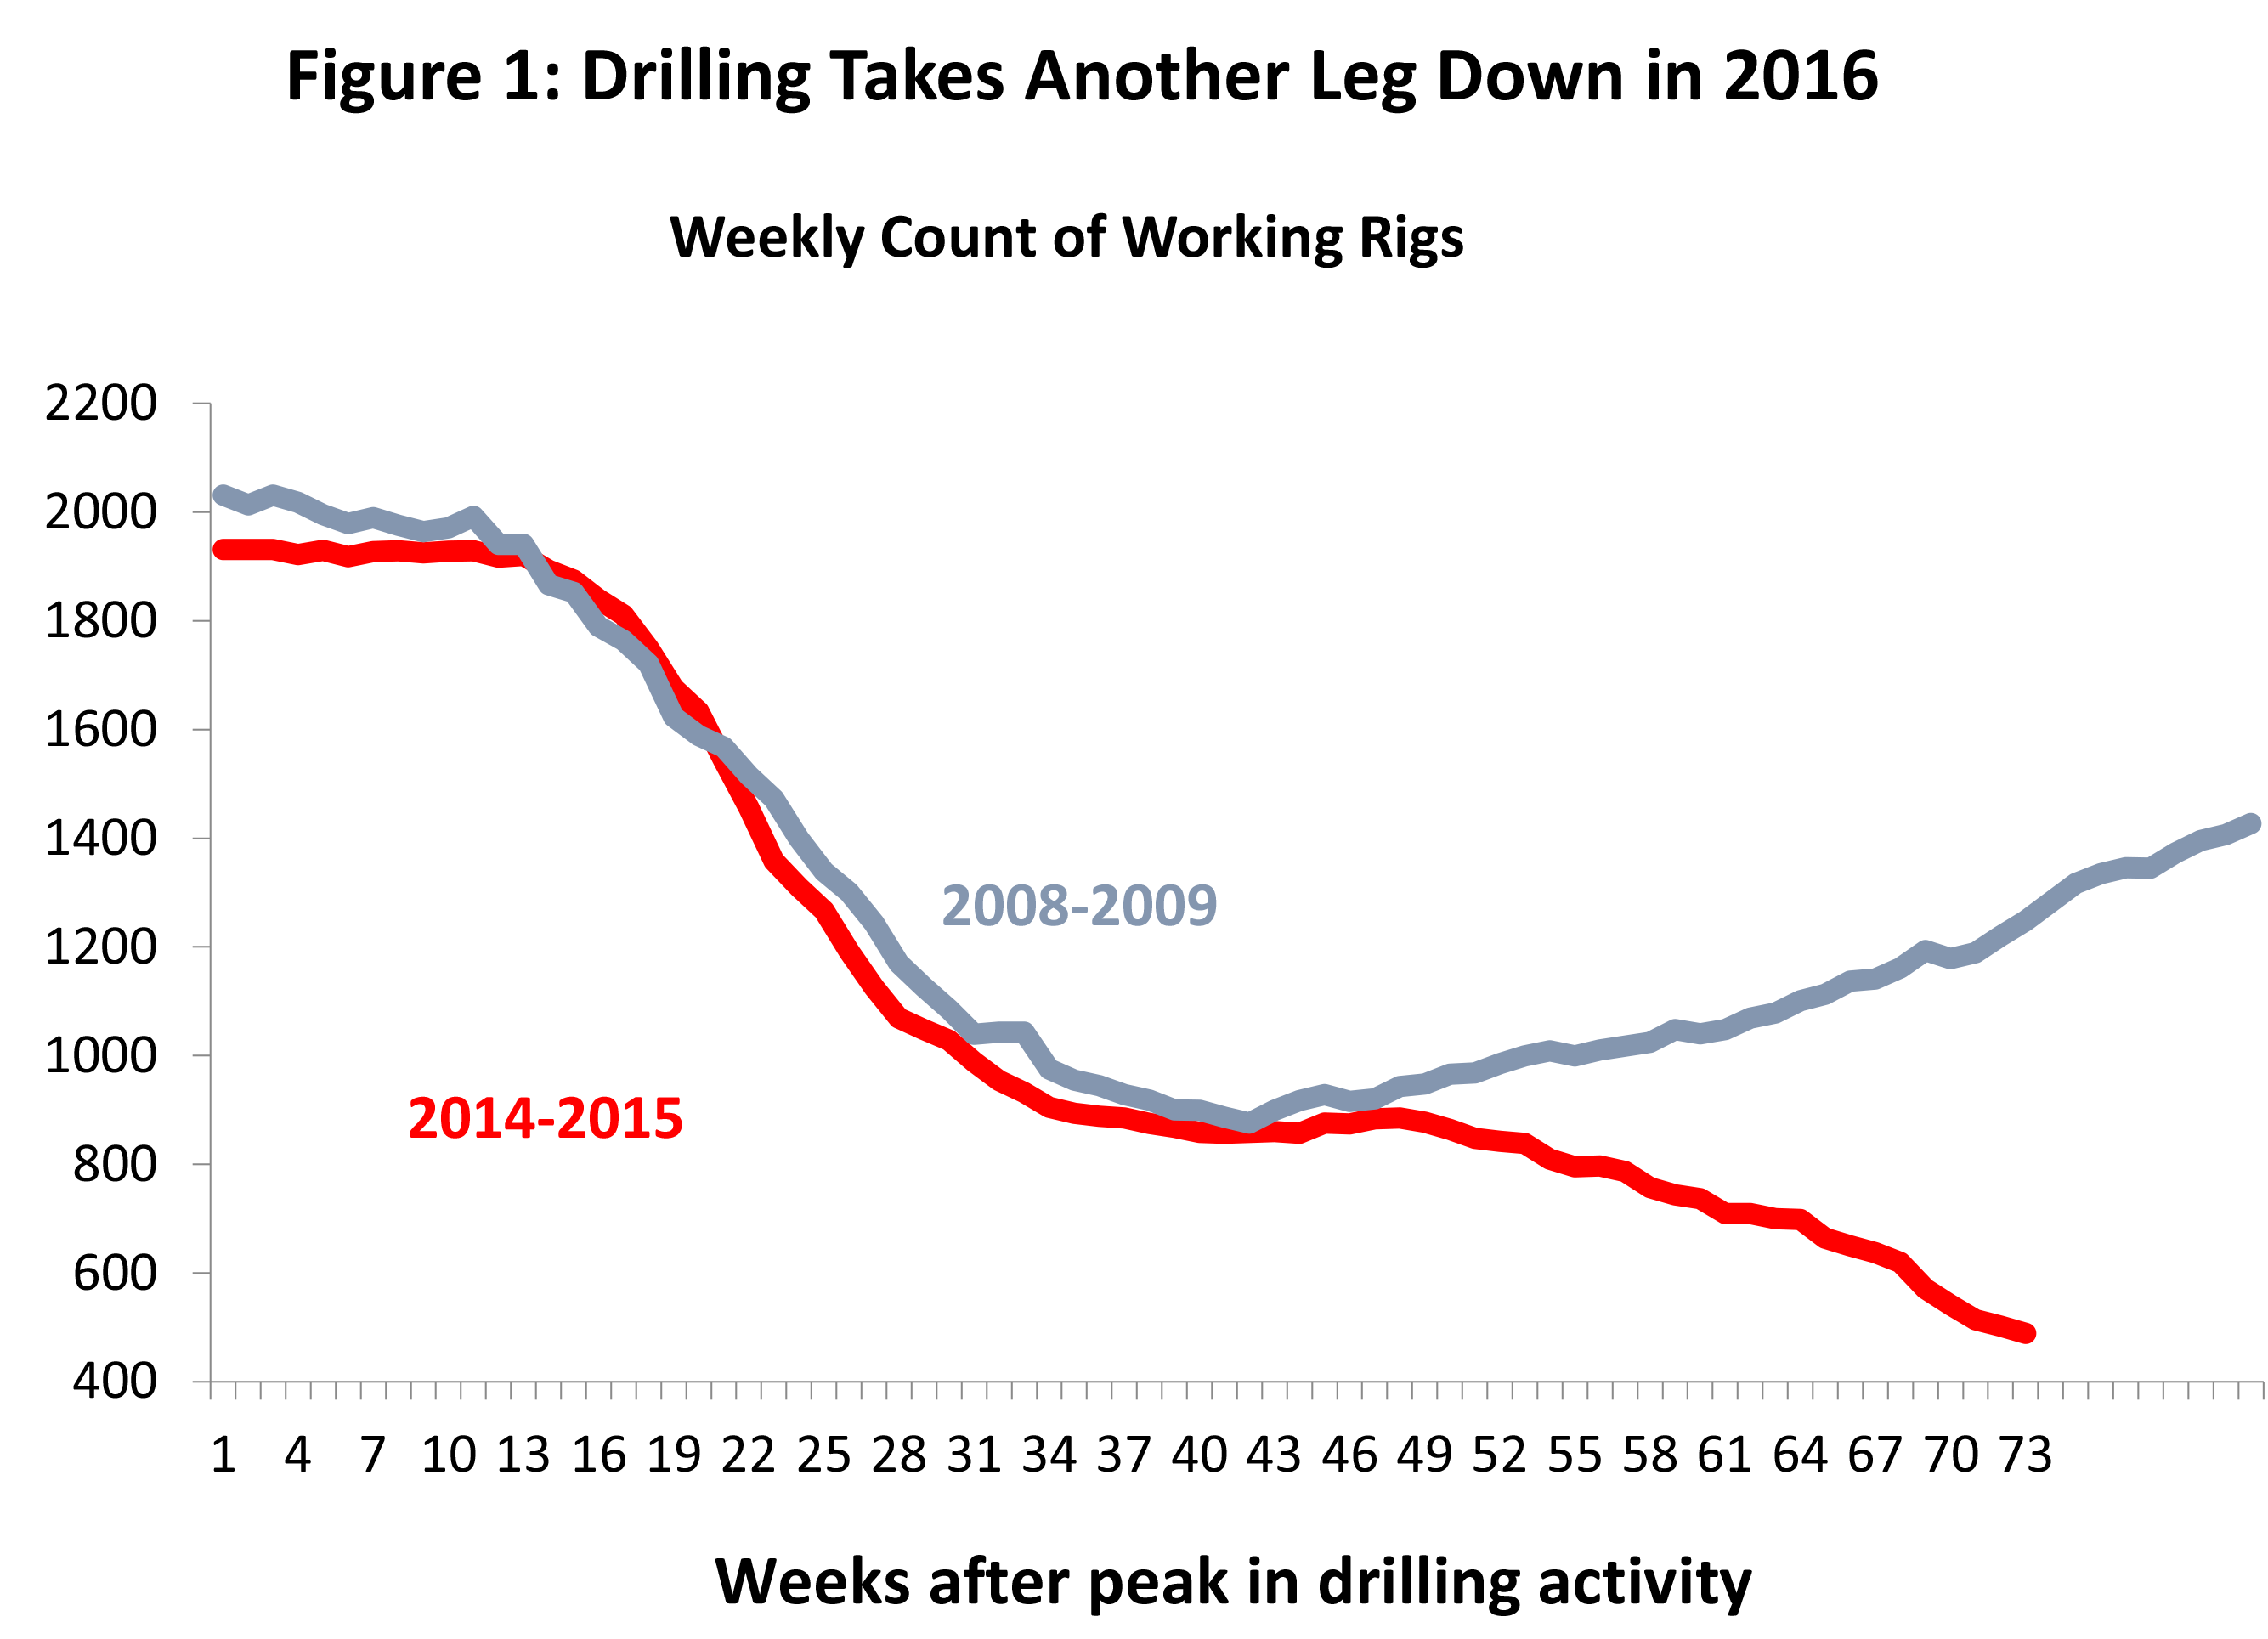
We began 2016 with 698 working rigs, and by early March only 489 remained, a fall of 30.0 percent. We currently sit on the verge of the smallest domestic rig count since 1949. Oil producers and service companies are under growing financial pressure as cash flows shrink along with the price of oil. Tougher and tougher decisions must be made to save the company, further squeezing capital spending and headcount. So far 2016 has not brought a V-shaped recovery, or a U-shaped recovery, but just one more leg down for drilling activity and energy employment.
Meanwhile, the eastside continues to hire thousands of construction workers, and the U.S. economy is growing strongly. After some bad headlines early in the year, fears of any major U.S. slowdown or recession are behind us. Gauging Houston’s economic performance remains a question of adding up several large plusses and minuses, and finding the small net gain or loss that will be local job growth. After putting the first quarter behind us, we should be better able to judge where we stand in energy markets, where overall job growth will fall out, and the near-term prospects for industries ranging from retail to real estate. A new employment forecast for 2016 and beyond will be the centerpiece of the IRF’s Spring Symposium to be held on May 17, 2016. Registrations will begin on March 28.
Notes
1 The administrative records are tracked by BLS in the Quarterly Census of Employment and Wages (QCEW). For Texas counties, the first report from QCEW that corresponded to the employment estimates made in the third quarter of 2014 were released on March 31, 2015. These QCEW figures are themselves subject to continued revisions and updates for several quarters.
2 The Texas Workforce Commission revisions come only once a year, but the Federal Reserve Bank of Dallas does not wait. They continuously rebenchmark and revise the payroll employment data as new QCEW reports become available. They anticipated this round of revisions very accurately at the aggregate levels and in the industrial detail. http://www.dallasfed.org/research/econdata/tx-emp.cfm
Written by:
Robert W. Gilmer, Ph.D.
Institute for Regional Forecasting
March 10, 2016