 Capt. Horatio T.P. Webb's Explorer Fashions |
MACROS Parks -- Fall 2013
|
|
|
Capt. Horatio T.P. Webb's Explorer Fashions |
MACROS Parks -- Fall 2013
|
|
This page demonstrates various uses of vbscript as a programming language for Excel macros. The example assume there is a web store -- Capt. T.P. Webb's Explorer Fashions -- whose inventory system tracks product demand. See the store front here.
An Excel spreadsheet has been design to examine the impact of the inventroy order policy for nine products sold on the web site and in addition to make forecast of future demand. The Excel data for the analysis is stored in an Excel spreadsheet here: http://www.bauer.uh.edu/parks/honorsB.xlsm. This spreadsheet has macros (VBA code) and is stored NOT a a *.xlsx file BUT as a *.xlsm file (it has macros). Save the file in a place you can remember.
To View the VBA code necessary to perform the tasks below, you will need to set up Excel to show the "Developer" tab. to do this follow these instructions: Click here for Excel 2013 OR Click here for Excel 2010.
There are two parts to the analysis:
You will see two tables with data:
Beginning Inventory - Sales (i.e., demand when possible) + Orders Received = Ending Inventory
An order is placed (for Reorder Quantity) when the Ending Inventory < Reorder Point
The Reorder Point and Reorder Quantity are determined at the beginning of each month (see the blue values on the first day of each month)
When a it has been determined that an order is to be placed, the delivery time (between 5 and 15 days) allows the reorder quantity to appear in the column labelled "on Order" for each day the order is pending (yellow values in the "On Order" column). When the order arrives, it appears in the "Recvd" column and is added to the inventory.
For all products, the current policy is to use last year's monthly demand as the "Reorder Quantity" and one-half the Reorder Quantity as the Reorder Point. This mimics the traditional "two-bin" system where: orders received were split in half and placed in two equal size bins. Inventory was removed from the first bin only. When the first bin was empty, an order was placed. Inventory from the second bin was used until the new inventory arrived (a simple and easy to implement rule).
The code performs the tasks necessary to populate the Inventory table. Rather than using the built-in Excel functions, the "inv" macro used Visual Basic to manipulate the cells.
Cells(r,c).Interior.Color = RGB(255, 255, 0) turns the background of a cell to yellow
To run the macro click on the "Run" on the options at the top, then Click: "Run Sub/User Form F5" to execute the code
It takes from 15 to 20 seconds for the macro to populate the inv table shown in the spreadsheet
To save the macro click "File", then "Save"
To forecast of the sales of the 9 products for the twelve months (of the year 2013) several alternative methods are used to produce a linear regression.
TREND
See this about TREND http://office.microsoft.com/en-us/excel-help/trend-HP005209320.aspx
See also LINEST http://office.microsoft.com/en-us/excel-help/linest-HP005209155.aspx?CTT=1
See also SLOPE http://office.microsoft.com/en-us/excel-help/slope-HP005209264.aspx
See also INTERCEPT http://office.microsoft.com/en-us/excel-help/intercept-HP005209143.aspx
About Forecasts (Least Squares Methods):
The idea us to take a set of paired data (x=time, Y=observation (i.e., the data values) and compute a trend line of the form:
y = slope * time_value + intercept
This represents a simple linear equation of the form y = m*x + b (m=slope and b=intercept)
We do this by relating the paired values of the independent variable (time or X) and the dependent variable (y).
There are two formulas (one easy to compute and one hard to compute)
Given N observations (i.e, x,y pairs)
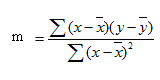
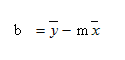
Regression Equation: y = b + mx
Slope(m) = (N*ΣXY - (ΣX)*(ΣY)) / (N*ΣX2 - (ΣX)2)
Intercept(b) = (ΣY - b*(ΣX) ) / N
and
SEASONALITY
The data you are using is HIGHLY seasonal. The page above (trend.xlsm) has an example of how to compute the seasonal indexes for the sample data (PART 6 -- gray).
The general idea is to remove the trend component in the data. This is accomplished by using the trend equation to compute a trend value FOR EACH observation (i.e., use the values of time in the trend equation to calculate a value for each Y). This is shown in the gray column labelled "TREND".
Then we DIVIDE the "observed value of Y" by the "trend value for Y". This is shown in the column labelled "Y/TREND"
We then sum the de-trended values of Y for each month (column labelled "sum y/t") and calculate the average for each month (column labelled "ave y/t). These are the seasonal indexes for each month. We can use the
To forecast the future year, we use the trend equation calculate by any method above (See PART 7 -- "dark blue" on the Excel page). Then we adjust each forecast with the seasonal indices calculated in PART 6.
PART 8 (dark green) uses the EXCEL TREND Function to perform the same analysis.
EXCEL CHARTS & GRAPHS WITH MACROS
An EXCEL Chart is created to show the relationship between the time series (months 1 to 132 and the actual Y values and trend). This is just a small example.
See this chart making discussion and this chart making-spreadsheet done with macros.