Houston Updates
-
Archive
- March 19, 2024
- December 9, 2023
- June 16, 2023
- April 6, 2023
- March 17, 2023
- Dec. 19, 2022
- Sept. 14, 2022
- July 4, 2022
- March 27, 2022
- March 9, 2022
- September 2021
- April 2021
- March 2021
- September 2020
- August 2020
- June 2020
- April 2020
- March 2020
- January 2020
- December 2018
- June 2018
- March 2018
- February 2018
- January 2018
- September 2017
- September 2017 Post-Hurricane
- June 2017
- March 2017
- January 2017
- September 2016
- March 2016
- December 2015
- September 2015
- June 2015
- March 2015
- December 2014
- June 2014
- March 2014
- November 2013
- September 2013
Houston and the Future of American Fracking
March 18, 2021
Summary of results
Since the growth of tight oil and natural gas exploded in the early 2000s, it has been boom or bust for American fracking. Oil production boomed at 24.6 percent annual growth rates from 2004-2014 as a result of OPEC driving $100 oil prices, zero interest rates from the central bank after 2008, and speculative excesses by both the fracking industry and those who financed it. The fracking bubble burst in 2015-16 when OPEC slashed oil prices, but it took until 2018 and rising interest rates from the Federal Reserve before the last avenue of growth was cut off from this capital-intensive industry. Investors suddenly saw fracking as unable to deliver either significant growth or stable returns, and in 2018-19 the industry entered its second round of major bankruptcies since 2015. The COVID-19 crisis in 2020 made the industry’s bad financial situation much worse.
To convince current and future investors of the fracking industry’s potential, oil producers have widely committed to a substantial diversion of their cash flow to reward investors and limit capital spending. It will take years of commitment to convince investors that the industry is serious after having sent $175 billion in producer and oil service assets through the bankruptcy courts since 2015.
It may be surprising that a shift to a new financial model by a single industry could influence the economic outlook for a major metro area like Houston with 7.1 million people and 3.2 million payroll workers. But oil has always had a special and outsized role in the local economy. Houston payroll employment has grown at 2.0 percent per year since 1990, and 0.6 percentage points or about one-third of that growth stems from oil. The estimates described below imply that 0.2 to 0.3 percentage points of oil’s growth in Houston may now be lost to fracking’s financial problems and the need to clean them up. These are not temporary losses to a recession or global oil crisis, but semi-permanent losses as the fracking industry buckles down for years of financial stringency.
But even if oil were to disappear tomorrow, the other contributors to Houston’s growth — the U.S. economy, demographics, the Texas Growth Formula — remain healthy over the long run, and Houston’s job growth would outperform the rest of the country 1.4% to 1.1%. Add back the now-smaller contribution from oil, and the comparison is 1.7%-1.8% locally to 1.1% for the U.S. These are still impressive results.
By measures other than the number of jobs, however, the damage from oil may be more meaningful. Oil is a headquarters and research operation in Houston, providing tens of thousands of high-quality executive, engineering, and other technical jobs that pay far above average. Per capita income and retail sales, for example, will likely be hit harder than the job numbers above would indicate.
The summary table below describes how financial change is felt in the oil fields, as well as its impact on Houston’s upstream oil sector and broader payroll job growth. We assume 10/20/30/40 percent of fracking’s operating flows will be diverted from capital spending to cleaning up company balance sheets and directly rewarding investors. Oil prices still matter, of course, with oil price being the top-line determinant of industry cash flows. The table assumes either: (1) after a COVID recovery, oil prices slowly return to a healthy $60-$65 and near the long-run marginal cost of oil; or (2) that OPEC follows its instincts from 2018 and holds price at a subdued $55 or at a level low enough to keep fracking firmly in check to protect market share.
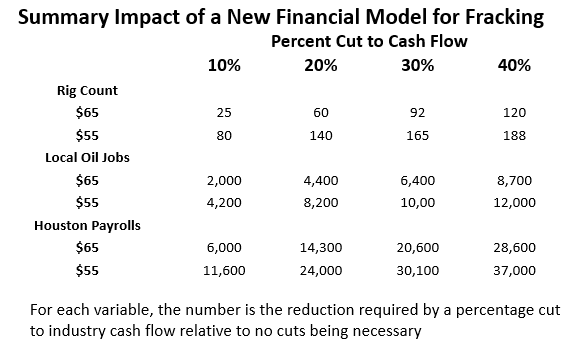
- At a $65 oil price, cuts in fracking industry cash flows and the diversion to investors of 20/30/40 percent mean a fall from no-cut levels to 60/92/120 fewer rigs. This is the reduction in the rig count compared to a hypothetical world where no financial adjustments are needed by fracking.
- If the lower $55 price prevailed, then the fall in the rig count would be 140/165/180. Whether at $55 or $65, these reductions push the rig count and oil-field activity to the lowest levels of the post-2000 fracking era apart from periods of brief major downturns.
- After losing 30,000 upstream jobs to bankruptcy and the COVID crisis, the no-cut, no-financial-problems baseline would see a return of all those losses to Houston by early 2023. The financial reforms and cuts to cashflow push this recovery back further and into 2024.
- The reductions in upstream oil jobs from baseline levels forced by financial conditions are substantial in number. For $65 oil and 20/30/40 percent cuts to cash flows, the fall in 2024Q4 would be 4,400/6,400/8,700; for the $55 oil price these upstream losses are 8,200/10,000/12,000.
- The U.S. economy is assumed to enjoy a moderate and sustained recovery once COVID is put to rest, and Houston shares fully in U.S. recovery and expansion. However, for every job lost to upstream oil, two more local workers in non-oil industries are laid off. Solid economic recovery continues at a good pace in Houston thanks to the U.S. economy, but oil’s financial problems slow that recovery.
- With oil price set at $65 and losses measured relative to the no-cut baseline, we see payroll job losses of 14,300/20,600/28,600. At a $55 oil price the 20/30/40 percent cuts to cashflows become payroll cuts of 24,000/30,100/37,000. For the three-year period 2022-24, this would mean the potential loss of 5-6 months overall growth in the local economy. This slower growth becomes a permanent feature of Houston’s long-run outlook.
Report introduction
The future of the American fracking industry is critical to the prospects for Houston’s economy. Houston has grown much faster than the rest of the United States over the last thirty years, with local payrolls averaging 2.0 percent per year from 1990 to 2019 while the U.S. averaged only 1.1 percent. The sources of Houston’s two percent growth can be divided roughly into 1.2 percentage points from shared growth with the U.S., 0.2 percent from long-run factors like a younger workforce and the Texas growth formula, and 0.6 percent from oil. In other words, it is oil that largely sets Houston’s expansion apart from the rest of the country.
However, Houston’s faster growth is accompanied by high volatility from oil markets, and the local business cycle fully shares fully shares its wide swings in oil prices. Occasionally, as in 2015-16 we see a strong U.S. economy work to offset the damage from oil markets, but the much more common result has been oil and the U.S. economy positively correlated, i.e., U.S. recession triggers weak oil prices and Houston takes a double blow from both U.S. recession and falling oil prices. Despite many claims of on-going diversification in Houston’s economy, there is little evidence that the role of oil — until now — has changed much in the last 30 years.
This article focuses on the fracking industry that dominates activity in U.S. oil fields, and on its prospects for recovery from the current COVID-induced economic crisis. The major questions about fracking and the oil industry as it moves through the coming five years revolve around three major issues.
- Oil prices — Fracking is a high-cost source of oil that needs prices of $60-$65 per barrel or better for sustained success. In some ways, the price problem is the easiest part of the post-COVID problem to resolve. Once global oil demand recovers and returns to its previous 100 million barrels per day, we should see price revert to levels near $60-$65. The COVID vaccine begins to provide a timeline for this recovery, although it still may take as long as two years to bring less developed and emerging economies fully back online. Complicating the picture substantially is the unstable tug-of-war for market share between the United States and OPEC+ led by Saudi Arabia and Russia.
- Industry credit problems — The modern fracking industry was born in the late 1990s, initially focused on natural gas, but was joined by oil-directed drilling by 2005. A fully-fledged take off into rapid growth followed. This capital-intensive industry was placed on steroids by the aftermath of the Great Recession and a long period of $100 oil prices and zero interest rates. The combination bred numerous speculative excesses in the industry, but credit problems began to mount in 2018-19 as the Saudi’s targeted oil prices at a tepid $50-$55 and the Federal Reserve moved to normalize interest rates. Bankruptcies, forced mergers, write downs, and delistings rose rapidly. As COVID-level oil prices rise, and many of the current stringencies from low oil prices recede, the need for substantial fracking-industry financial reform is apparent. This will mean a smaller U.S. fracking industry as we move forward with serious implications for the work available in the oil fields and for employment in Houston’s oil sector.
- Environmental policy — This subject deserves its own report but is only mentioned in passing her. It is important because it came to the forefront with the November election of a new administration and Congress. Broad environmental policy change is potentially underway with important implications for fracking. For purposes of this report, however, we have largely put the issue aside except to say that the administration has a long list of possible targets to limit drilling activity. However, fracking’s opposition faces an industry that has proven many times that it is entirely capable of defending itself. There are few specific actions so far and the timing and success of these measures are impossible to gauge at this point. We focus in this report on the more concrete effect of fracking of the industry’s self-inflicted financial problems.
Fracking and Houston’s economy
Following an oil boom that rivaled the 1980s and brought 100,000 new payroll jobs to Houston each year from 2011 to 2014, the local economy has since struggled through six difficult years. Both boom and bust have been led by oil markets, especially by horizontal drilling and fracturing. The technology required for this new industry existed for many years, but rapid and large-scale growth beginning in the early 2000’s seemed fully justified by $100 oil prices and low interest rates following the 2008-09 recession. OPEC production cuts were instrumental in maintaining these high prices thorough 2014, even as American fracking continued to steadily erode OPEC’s market share.
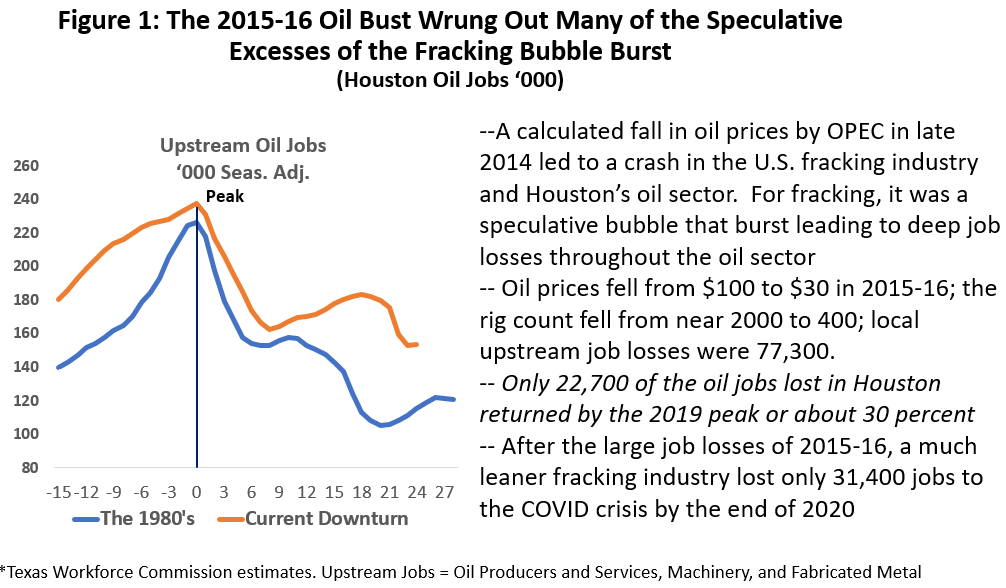
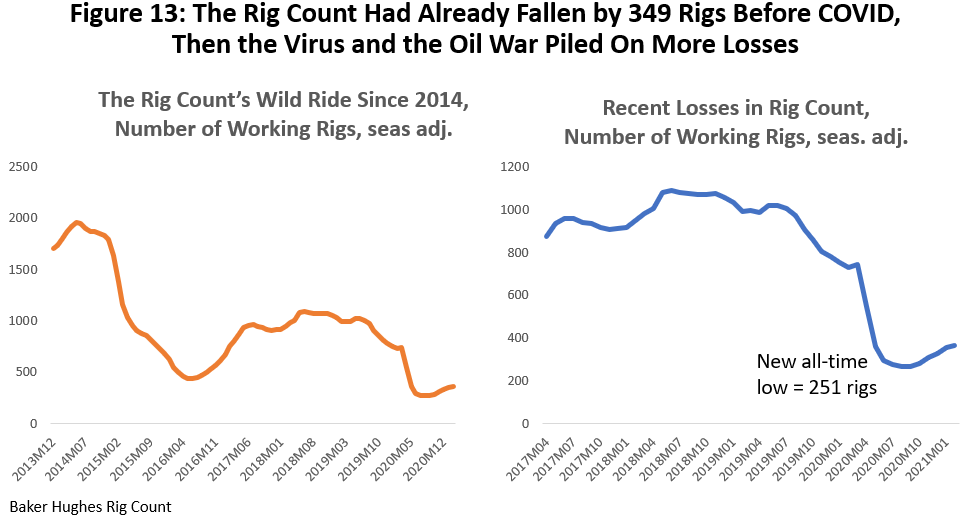
Fracking’s problems began in November 2014 when OPEC tired of losing sales to U.S. producers, recognized fracking’s status as a high-cost source of oil and withdrew as the swing producer in global oil markets. This carefully calculated oil-price crash saw oil briefly fall under $30 per barrel, the U.S. rig count fall from 1900 working rigs in 2014 to near 400 in 2016, and Houston lose 77,300 jobs in oil production, oil services, fabricated metals, and machinery industries. See Figure 1. This crash of the fracking industry and Houston’s oil sector was the bursting of a speculative bubble. Subsequent years have seen a return of more normal oil-market conditions, as real oil prices averaged $57 per barrel during 2017-19 and the U.S. rig count rose to 952. But 54,600 of Houston’s oil-related jobs were permanently lost to the fracking bubble.
Local oil jobs peaked again in mid-2019 as an industry-specific credit crunch took hold, forcing a series of large and small bankruptcies, forced mergers, and delisting of many fracking companies by major exchanges. Just as the credit crunch appeared to be easing in early 2020, the COVID pandemic and the brief Saudi-Russian oil war returned the industry to full-blown crisis.
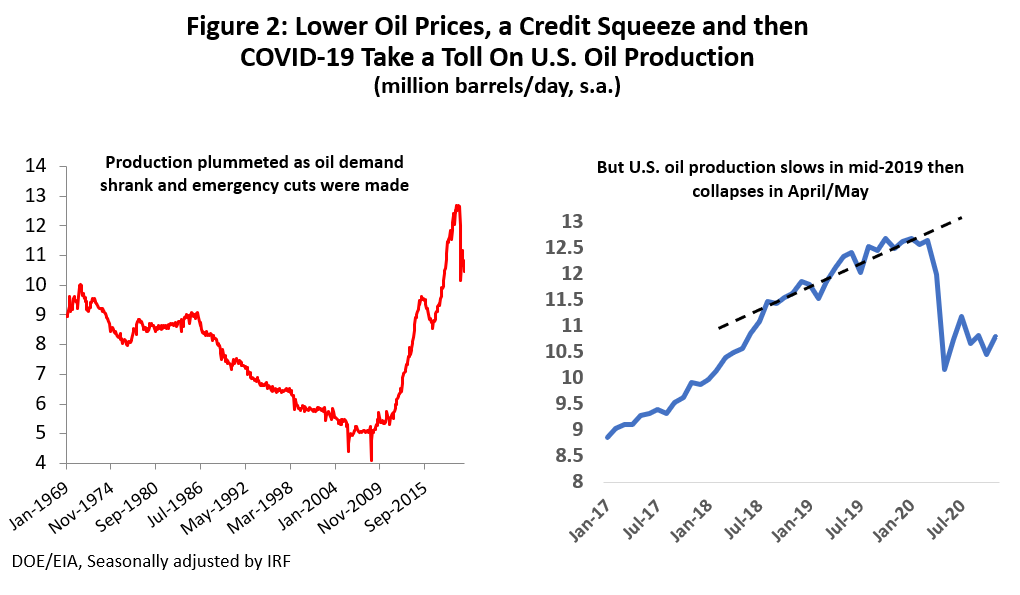
Apart from this latest crisis, however, American oil production continued to growth rapidly until March 2020 and the COVID-19 outbreak. (Figure 2.) Following the price decline of 2015-16, U.S. oil production quickly recovered and pushed to all-time high levels that made the U.S. the largest oil producer in the world and a major oil exporter. Even following the collapse in oil demand due to COVID, the industry has continued to produce a steady 10-11 million barrels per day of oil.
Key characteristics of a new industry
Fracking is a new departure in the oil industry, standing well apart from the past in its industrial structure, technical and economic requirements, and in its financing needs. Descriptions of the industry are too often too often built on narrow and selected perceptions of reality, much like the ancient parable of the blind men and elephant, where individual perspective depends on whether they grab the tail, the trunk, or felt the side of the beast. Similarly, fracking can be described as a return to American oil pre-eminence, an escalating treadmill of high capital requirements that must inevitably lead to industrywide collapse, or a devastating engine of environmental damage. With oil and fracking now enmeshed deeply in the culture wars, a broader view is often necessary for both elephants and the new industry.
The fracking industry developed with an industrial structure that sets it well apart from the handful of large producers that had historically dominated American oil, companies like Shell, Exxon, BP, or Chevron that were focused on multi-billion-dollar, multi-year projects that could take a decade before they would produce a barrel of oil. In contrast, fracking has a competitive structure comprised of many small- and medium-sized operators with relatively easy entry into the market; they are highly responsive to oil-price incentives and can quickly expand or shut down production using methods that are more like assembly lines than project-oriented traditional drilling. While there is risk in fracking at every turn, drilling risks are reduced compared to vertical drilling, production costs are well understood, and the resulting output is quick and sure.
Fracked wells can deliver large quantities of oil in a few months, with 40 to 60 percent of the value of oil produced by the well in the first year. This makes the producer highly dependent on current and very near-term oil prices. Compare the discounted cash flows of revenues generated by the newly-fracked well to a new discovery in the Gulf of Mexico that will — after years of further work and enormous upfront development costs — slowly and steadily produce oil for the next 20 years. Present value calculations for this well would be based on a long-term oil price. Depending on your perspective — like the elephant — the recently fracked well is a one-step-at-a-time process that provides a steady path into the future in terms of oil delivery and cash flow, or it is the rapid depletion of a wasting resource by an industry that requires sustained, very high capital needs to ever work.
In summary, fracking operations live with the oil price cycle, starting, slowing, or stopping operations as the price of oil rises or falls. The trade-off with the large offshore project in price risk, technical risk, cost of production, and timing of delivery is clear. Fracking’s flexibility also explains why OPEC found it hard in 2015-16 to use low oil prices as a weapon against the industry. Fracking production slowed and stopped, with substantial medium-term damage to many small and medium-sized companies, but as soon as OPEC raised prices again in 2017, the fracking engine simply restarted and pushed U.S. production to new highs.
Recovery in the oil fields Is underway
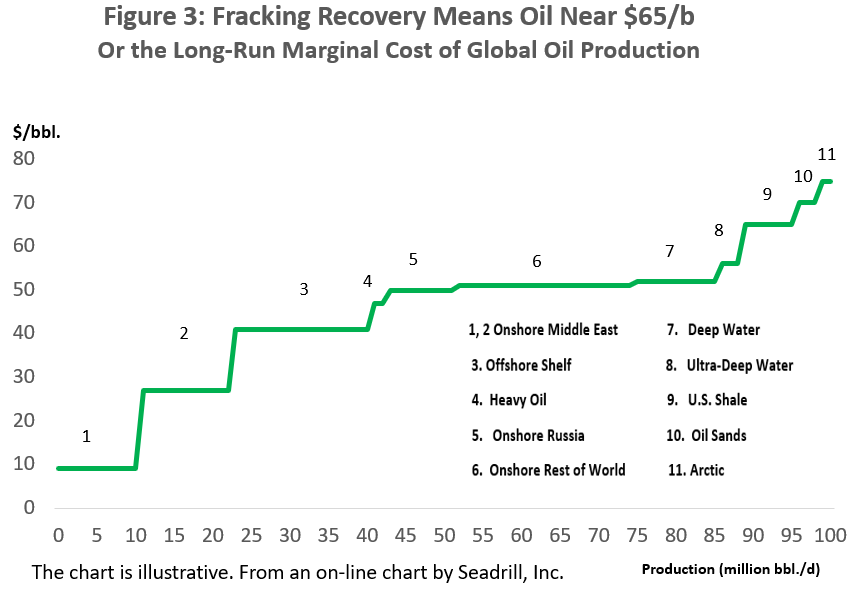
Economists know little about the outlook for oil prices, even in times less turbulent than today. The oil futures market can sometimes provide a peek into future for a month or two, but not always and rarely for any longer than that. Figure 3 is the long-run marginal cost of oil or a long-term supply curve; it tells us that to provide 100 million barrels per day of oil to the world — as we did in 2019 — we will have to pay $60-$65 per barrel for oil from U.S. shale or Canadian oil sands. Other less expensive source of supply will be fully exploited at the lower prices and we must turn to higher-cost oil. Equilibrium oil prices — supply equals demand — mean we see price match these long-run costs, but equilibrium rarely rules for long in volatile oil markets.
Following the April/May COVID collapse in oil markets and the Saudi/Russian oil war, prices quickly stabilized near $40 per barrel, slowly rose to end the year near $50, and have since surged past $60 in recent weeks. Enthusiasm about the COVID vaccines, a coming economic recovery, combined with sturdy Chinese oil demand, all supported a strong rebound in oil prices.
However, the major statistical agencies that forecast oil prices have not followed the market up in terms of their outlook for 2021 or 2022. They see renewed lockdowns in the U.S., Europe and Australia weighing on short-term demand, and a vaccine rollout that remains a partial solution for much of the world for as it takes two years to reach many less developed and developing economies.
Further, the oil-price recovery so far has been heavily supported by discipline from global oil producers, but the incentive to increase production rises along with oil prices. At the December meeting of OPEC+, Russia urged production increases while the Saudis wanted discipline because of the growing COVID lockdowns and potential for demand weakness. The Saudis finally acquiesced to Russian demands, accepted their production increase, and then implemented the Russian cuts themselves to keep production low. These cuts will continue until in place until April. Given the volatile relationship between the two countries, this pattern is not likely to be easily or long repeated.
Financing Fracking: Fool Me Once ...
The history of U.S tight oil production has been one of extraordinary growth from 300,000 barrels per day in early 2005 to 8.2 million by the time the COVID pandemic arrived. This is a compound annual growth rate of 24.6 percent. The fracking industry needs oil prices above $60 for success, and these high oil prices generally prevailed from 2004 to 2014 except for a brief period during the Great Recession. See Figure 4.
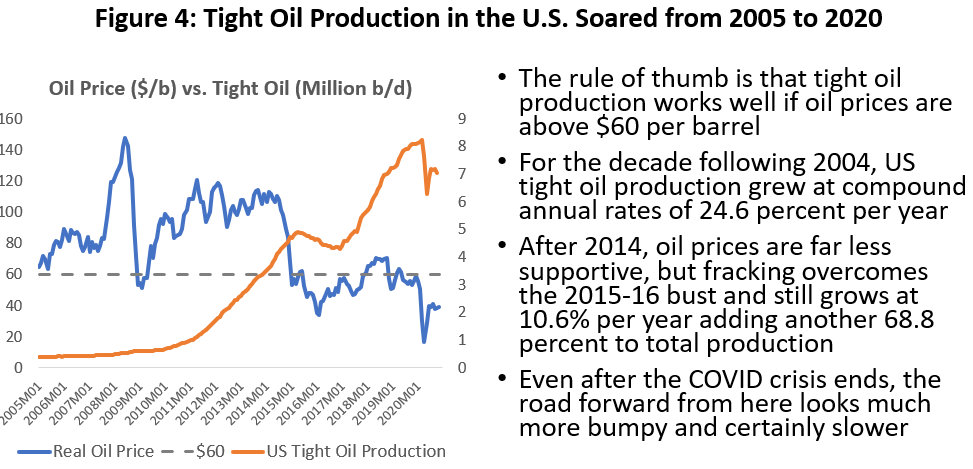
Both before and following the Great Recession the oil-price support to tight oil provided strong incentives for industry growth, and after the recession low interest rates from the Federal Reserve added fuel to the fire. Low rates were explicitly intended by the central bank to push investors into risky assets like high-yield bonds by taking away any return to safer assets like treasuries. Here was a new industry growing at nearly 25 percent per year, seeming to offer the model provided in recent years by the rapid growth of tech firms as they disrupted old markets and opened new ones. If fracking required huge amounts of new and risky capital, investors were happy to provide it.
After 2014, however, oil prices were less supportive. The market disruption offered by fracking was real enough, but it turned out that the OPEC competitor could produce the same product at much lower cost — it was just painful for Saudis and Russians to sell it that cheaply. The low oil prices of 2015-16 were simply a short-term effort to push the Americans back out of the business. This proved to be a short-term failure for OPEC. After a brief decline in U.S. tight oil production, OPEC raised oil prices again in 2016 and fracking growth promptly resumed at 10.6 percent per year. By early 2020, fracking production was 68.8 percent higher than 2014.
- How did this renewed growth happen? There were modest gains in the efficiency of U.S. fracking that perhaps moved the long-run curve down from $60-$65 to $55-$60. When OPEC tried to raise prices above this level in 2017, the fracking industry promptly went back to work.
- Besides production efficiencies, the industry had a recent history of substantial investment in land and leases that provided a backlog of sunk cost and an inventory of wells that had been drilled but not completed. The companion oil service industries also had invested heavily in the growth of fracking, and low levels of equipment utilization forced deep cuts in their service rates and fees.
- The industry had been heavily hedged against oil price declines in 2015, typically 50-90 percent, which helped carry them through the early stages of the downturn.
- Financial markets continued to be supportive in 2017, at least in the sense of continued low interest rates and the incentives offered for risk taking.
- After the industry dived deeply into bankruptcy — oil producers took $82.76 billion in secured and unsecured debt through the courts from 2015-17, soon followed by $54.1 billion by oil service companies1 — and the industry stabilized its long-term dept level. An important part of the cost of shedding this debt was the damage to its reputation as a trusted borrower. Private equity entered as a major new source of funding for the industry in 2017 as other capital sources backed out.
From this point forward, the fracking story is still about oil prices, interest rates and how the industry finances itself. But to discuss the future we need to back up and find perspective on how the industry finances itself. Figure 5 is a highly simplified and hypothetical example of a cashflow statement for a fracking company from the boom years when investors were tempted by the industry’s fast growth and financial condition.
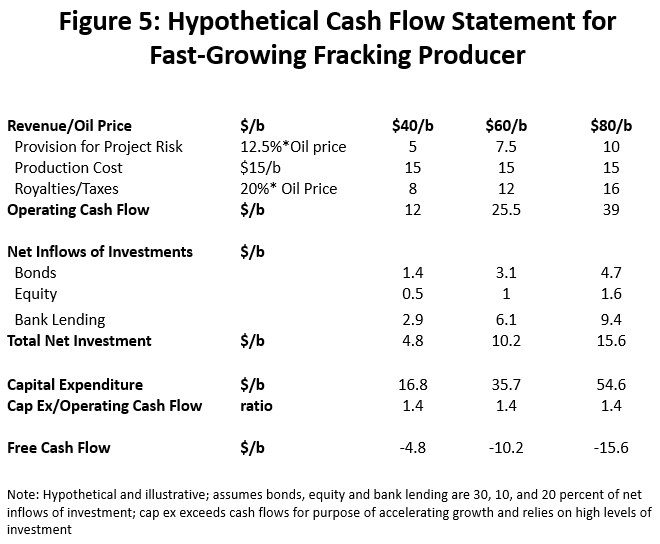
The top part of the chart is the operating cash flow calculation of revenue less cost, and we have stated it as dollars per barrel of oil production.2 The cash flow results depend heavily on the price of oil, and three price levels are used at $40, $60, and $80. The provision of 12.5 percent of the price of a barrel for project risk is a haircut for a contingency fund, hedging costs, or other risk management tools. An allowance of $15 per barrel is for the cost of drilling, fracking, completion, transportation, depletion, etc. Plus, we subtract an additional cost of 20 percent per barrel to pay royalties and taxes. The remaining free cash flow is assumed to be devoted 100 percent to capital expenditures.
Now assume our 2012 company was growing at the industry average of 24 percent per year and has easy access to equity and high-yield bond markets as well as bank lending. These large inflows of external capital allow additional investment of $4.8 to $15.6 billion dollars during the year, depending on the price of oil.
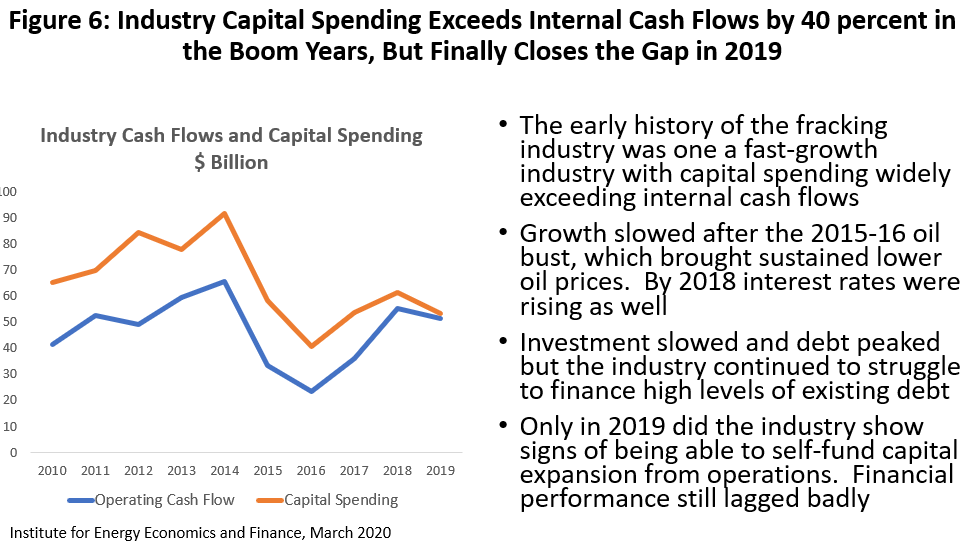
Borrowing allows our hypothetical company to fund rapid 40 percent growth in oil production with large increases in capital spending and drilling activity, and the only penalty is a rising level of long-term debt that the company could easily handle in 2012 markets. Based on a sample of 34 fracking companies and calculations of the Institute for Energy Economics and Finance, Figure 6 shows how actual capital spending for these companies ran a sustained 40 percent higher than operating cash flows from 2010 to 2014.3 And Figure 7 shows long-term debt mounting rapidly until 2015 when the price of oil would crash and put the industry’s finances in a much more realistic and negative light.
Our elephant analogy is a work again: Was this early fracking growth a reasonable but mistaken investment in a fast-growing industry working against a backdrop of $100 oil and zero rates? Or were investors fooled by a scam run by shady companies that would quickly take $88 billion in secured and unsecured investor debt through bankruptcy?
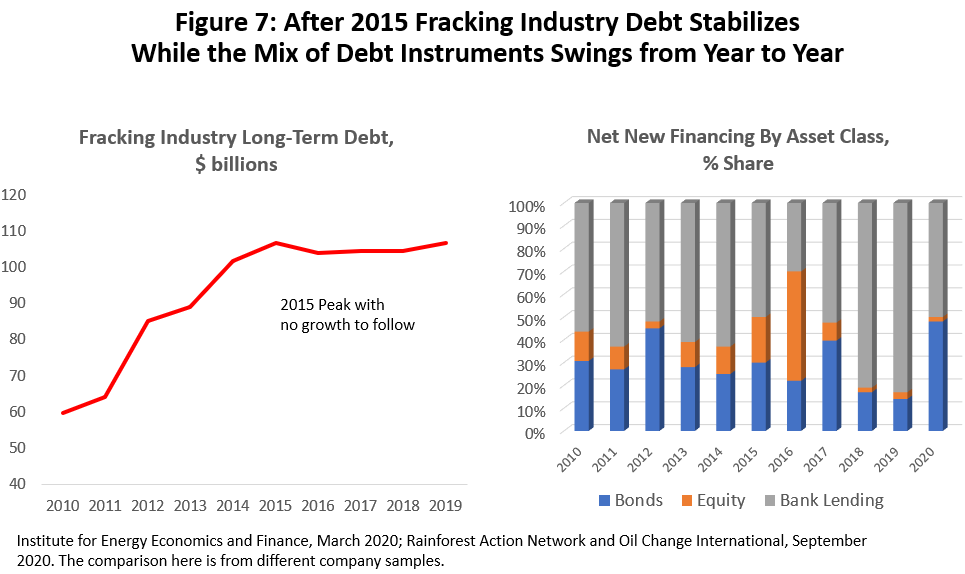
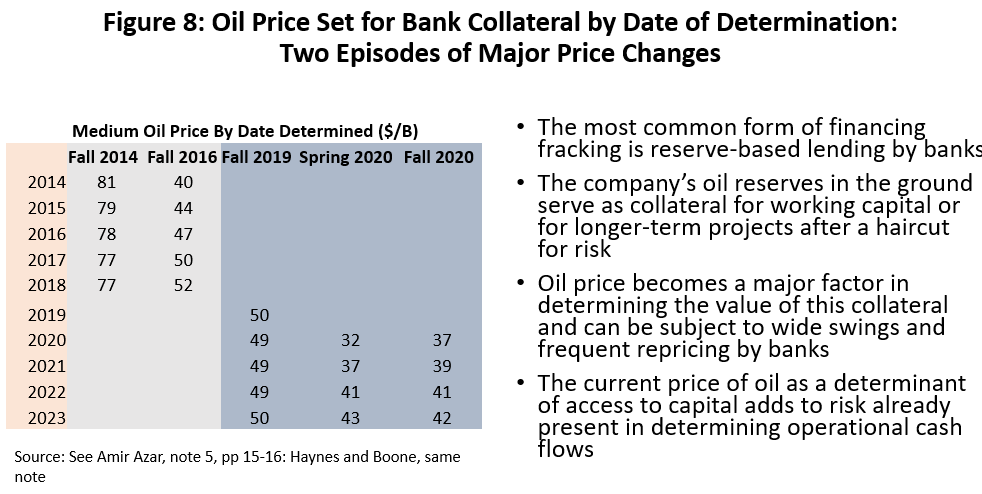
The fracking industry’s financing has come from high yield/noninvestment grade bonds, public and private equity, and bank financing. The right side of Figure 7 shows that the typical annual share of financing since 2010 has averaged roughly 30 percent bonds, 10 percent equity, and 60 percent bank financing.4 Bank financing has been a staple of the oil industry as a source of both working capital and longer-term financing since the 1980s, where it has been at center stage in the 1980’s crash, the 2015-16 downturn, and now the COVID pandemic.5
Bank lending to the energy industry mostly relies on the borrower’s oil and gas reserves as collateral. The extent of reserves available for future production and delivery is based on the professional judgement of a reserve engineer engaged by the lender, and the value of the reserves depends on the banker’s best guess at the future price of oil. Both the quantity and price of collateral are judgements that have been proven less than reliable many times over.
Oil price is especially volatile, and for the fracking company it adds another layer of price risk to the cashflow calculations. Oil price sits on the top line of the simple cash flow statement in Figure 5, making it a major determinant of operating cash flows; but reserve-based lending means that a fall in oil prices will cut into investment cashflows as collateral values swing with the oil market. Oil prices for collateral are given a significant haircut by the bank before the loan is made and price will typically be reset every six months. However, Figure 8 shows the potential for dramatic changes in the availability of bank funding based on the repricing of collateral that took place in 2015-16 and now in the latest COVID downturn.
Financing Fracking: Fool Me Twice ...
After 2015, the IEEAF sample sees the fracking industry begin to stabilize its long-term debt at around $105 billion dollars per year. Our simple cash flow statement in Figure 5 would then tell us that the industry was self-financing its capital expenditures, i.e., total capital expenditure equals 100 percent of cash flows. In each oil-price column the amount of investment from bonds, equity, and bank lending must net out to zero. No additional total debt is added but refinance and roll-over of existing debt can continue, or the debt may move to a more favorable mix of debt and equity, for example.
However, the IEEFA data also show an industry that continued to struggle after 2016. For example, from 2017-19 the sample shows annual increases in net income of only $1.4 billion or 1.3 percent of revenues, compared to an average of $13.6 billion and 12.1 percent from 2010 to 2014. The problem with Figure 5 is that simplification omitted key parts of the cashflow statement for financing the industry’s high level of debt. Stabilizing debt was not enough. Just carrying the existing debt dragged down performance and meant that the fracking industry could no longer impress financial markets with fast growth or deliver meaningful earnings and profits.
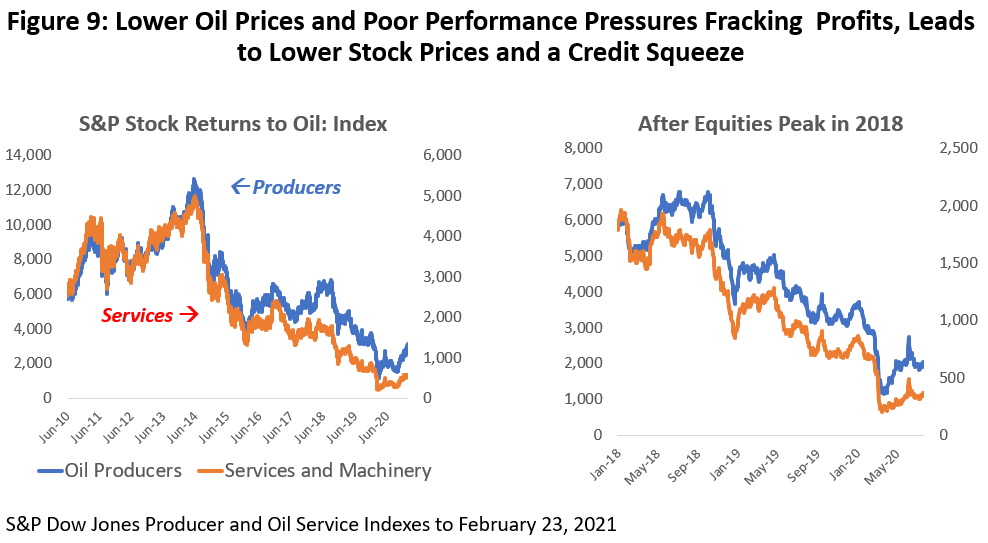
Wall Street effectively turned its back on the fracking industry in 2018. The S&P Producer and Oil Service and Machinery stock Indexes are shown in Figure 9. There was no substantial recovery in equity values after 2016, and after leveling off through 2017 stock values were again in full retreat by 2018. Equity is a small part of the industry’s overall financial picture, but this was a clear signal of general financial stress.
By 2018, the industry saw its problems multiply. After one round of bankruptcy, it had moved toward stabilizing debt and self-funding capital spending but needed further reductions in the size of its balance sheet to be profitable. Meanwhile, OPEC had adopted a strategy of setting the price of oil near $55. Not even OPEC could afford another long period of low oil price required to kill the fracking industry, but $55 was low enough to slow industry growth. Finally, the Fed began to move toward normalizing interest rates and raising the cost of capital.
This combination created enough financial stress to see write-downs, delisting of some fracking companies by their exchanges, and the return of bankruptcy in early 2019. These pre-COVID bankruptcies reached $25.8 billion in secured and unsecured assets in 2019. See Figure 10. This came only months after the end of the previous $82.8 billion bankruptcies in 2015-17.
However, by early 2020 the bankruptcies appeared to be subsiding. If we divide the industry into two parts — those companies building and operating a solid oil company as opposed to those more interested in using financial gains to impress the stock market — there was a sense that the core of well-run oil companies would survive, while the financial bets on fracking had already been lost. The surviving companies would face years of stringencies in patching up their balance sheets, but they would continue in business.6
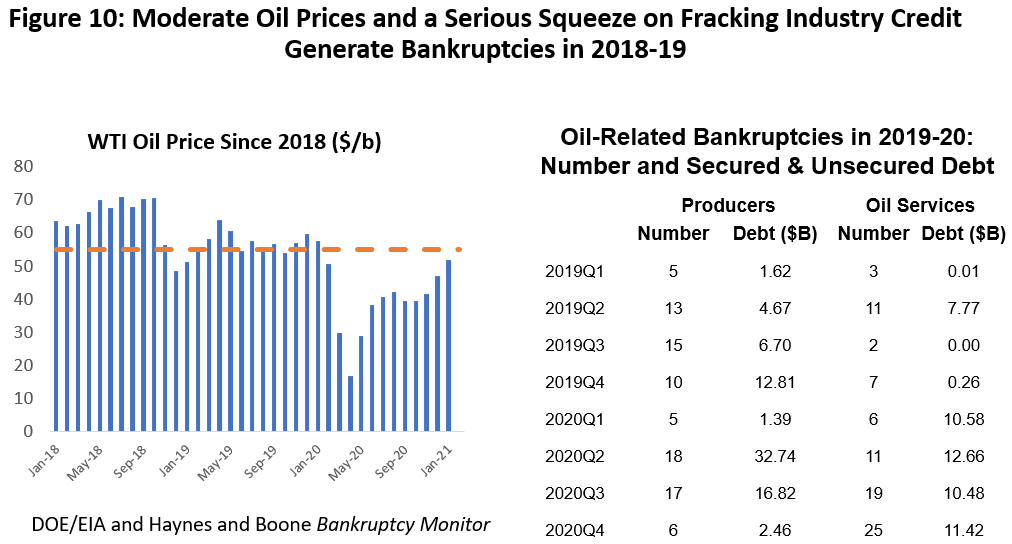
Then came the COVID pandemic, bringing with it a collapse in oil demand, emergency well shutdowns as storage filled, and oil prices falling hard before stabilizing near $40 per barrel through most of 2020. The remainder of 2020 would see another $53.1 billion in bankruptcies for producers and oil services added to the on-going second wave of legal filings. By late 2020, the bankruptcies appeared to be slowing for producers if not for services.
The IEEFA financial results for its sample firms is described below for the first three quarters of 2020 in millions of dollars.7 It shows a pre-COVID industry trying to keep capital spending within operating cash flow boundaries through the first quarter of 2020, only to run into the massive COVID disruption. Despite slashing capital spending 36.3 percent in the second quarter, it could not keep up with a fall in oil prices and operating cash flows of 61.6 percent. The third quarter saw a rebound in operating cashflows, further declines in capital spending, and cap ex reaching only 70 percent of operating cashflows. The fourth quarter should see modest continued gains in cash flow as oil prices slowly rose, and capital spending was also rising slowly but steadily based on the improved rig count and number of frac spreads.
| Operating Cash Flow | Capital Spending | Free Cash Flow | Ratio: Cap Ex/Cashflow | |
|---|---|---|---|---|
| 2019Q3 | 12,899 | 13,936 | -1,037 | 1.08 |
| 2019Q4 | 12,861 | 12,039 | 822 | 0.94 |
| 2020Q1 | 12,972 | 12,515 | 457 | 0.96 |
| 2020Q2 | 4,976 | 7,967 | -2,991 | 1.60 |
| 2020Q3 | 8,333 | 5,807 | 2,526 | 0.70 |
Targeting Cash Flow Cuts
By this point, it should be clear to all that the elephant is ill and will require a long period of convalescence. The debate is now whether the elephant can survive by mending its ways, getting healthy, and emerging as smaller but still effective, or whether the elephant is doomed because it was never meant to survive in an economic ecosystem of normal oil prices and positive interest rates. No matter what, this will be a smaller and weaker elephant.
After two successive rounds of bankruptcies that totaled $174.8 billion since 2015, building investor confidence in fracking will be a long and slow process. A fool-me-twice attitude by investors is understandable. Pre-COVID financial results told us that that the industry needed to reduce the debt load it was carrying, and the second round of bankruptcy now has done much of that work. However, this remains a capital-intensive industry that must seek out and mollify twice-burned investors. If the previous goal was to match cap ex with operating cash flows, fracking now faces the need to divert substantial portions of operating cash flow to further cleaning up its balance sheet and rewarding investors with higher and reliable returns.
Fracking will be a slower-growing industry over the coming years. Diverting cash flows to financial maintenance and building investor confidence converts immediately into less capital spending. But the first round of cuts is just the beginning: the initial capital spending cuts imply lower production and revenues, bringing another smaller round of cuts in cash flows, bringing another smaller production cut, and so on. Where do cuts end and where does the production level stabilize?
Implementing the cuts depends on two simple questions. First, how big must the cuts be to impress investors after successive financial disasters, perhaps as much as 20-40 percent of cash flow? Second, a more technical question. If we divert cash flows to investors, cap ex should fall by a similar amount, then production must be cut and revenues fall. This triggers a second round of cash flow cuts, followed by another fall in cap ex, production and revenues. Then a third round and so on.
The cuts in cap ex should be more or less proportional to cash flow cuts, but the initial cuts in production and revenue should be smaller since they will be directed to the least productive land, equipment, and people. Should the production/revenue cuts be 100 percent of the cuts to cash flow — or 90, 80, 70 or 60 percent as large?
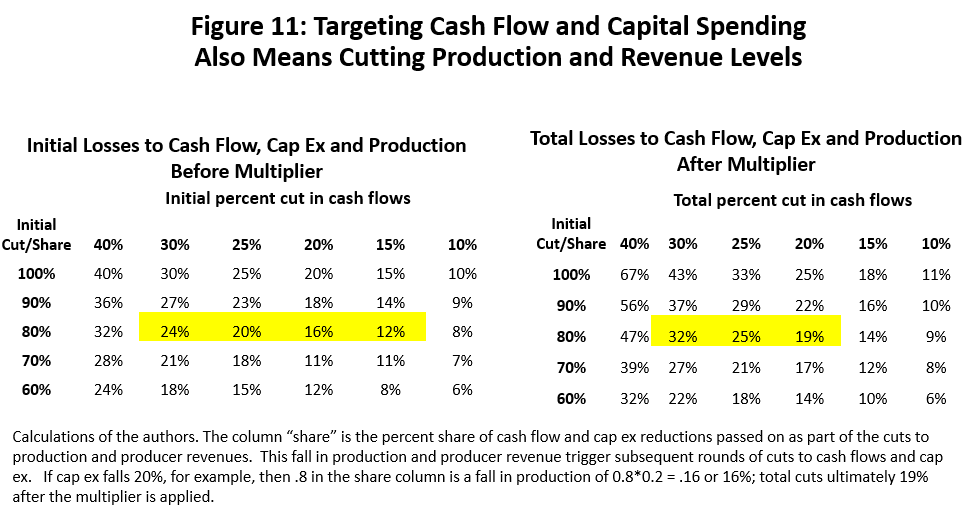
The left panel of Figure 11 calculates initial cuts to operating cash flows and capital spending on the top line of the chart ranging from 10 to 40 percent. These are cuts to impress potential investors with better financial results, and the top line of the table assumes that the percentage cut to cash flow will carry directly and 100% to capital spending and then to the value of lost production. The lower lines of the table assume that production and revenue cuts only will be a percentage or share of the cash flow cuts, ranging from 60% to 90%. Since we have little visibility into the losses of producer revenue, we are forced to assume that perhaps only 90, 80, 70, or 60 percent of revenue is lost while still achieving the same cash flow objective.
Once the initial cuts and diversion of cashflow to investors take place, they trigger a multiplier that ultimately results in larger total reductions before stabilizing. The total fall in cash flows and cap ex results in the multipliers shown in the chart on the right, and it depends entirely on how production and revenues respond with each round of production cuts. Smaller declines in production can be a big positive in controlling the total impact of initial cuts.
As an example, suppose we decide to pass through 16 to 24% percent of operating cash flows to investors as in the initial change table on the left side of Figure 11. We also assume that production falls by 80 percent of the cash flow/cap ex cut. See the highlighted cells in the 80 percent row. The total change after subsequent declines in production is in the table on the right and would be a 19 to 32 percent decline in cash flows and cap ex. The more useful way to use the tables is as follows: If we want to target total 19-32% cuts on behalf of investors, we should start with initial 16-24 percent in the first table and let the multipliers take care of the rest.
The Impact of fracking on the oil fields
What happens as the fracking industry shrinks in coming years? Oil prices will have less of an impact on the rig count; less activity in the oil fields means less oil-related employment growth in Houston; fewer oil jobs could slow Houston’s growth for years to come. By how much? We will connect the various links in this chain of events.
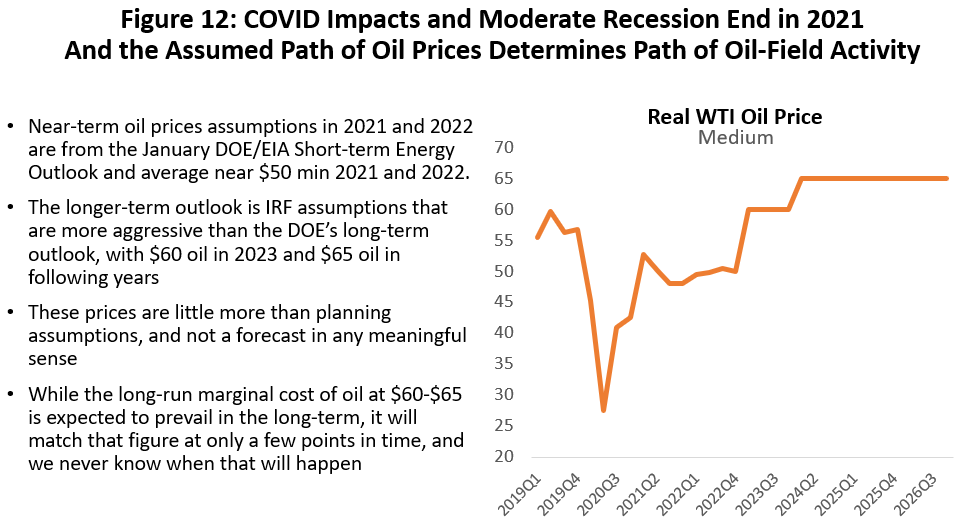
The beginning point is the future of oil prices, and we primarily followed the lead of the Energy Information Administration for the medium outlook in 2021 and 2022, as well as use their long-term forecast through 2026.8 However, our projection after 2022 is moderately more aggressive than DOE as it rises to $60 in 2023 and $65 each year after that. DOE’s long-term forecast is $55 in 2023, $58 in 2024, $61 in 2025, and $64. in 2026. See Figure 12.
Drilling activity in the oil fields is recovering slowly but steadily. As an indicator of oil-field activity, the rig count has long been the industry bellwether in terms of the outlook for activity levels, hiring, and future oil production. The rig count stabilized in June and has improved every week since early September except for Thanksgiving week.9 Figure 5 makes it clear, however, that the gains have been slow, and that drilling activity remains at low levels. The 1081 working rigs at the June 2018 peak in activity is a distant memory today, much less the 1946 rigs at work in June 2014. The previous all-time low in 2016 was 434 rigs and the 362 rigs averaged in February was still below even that basement-level standard.
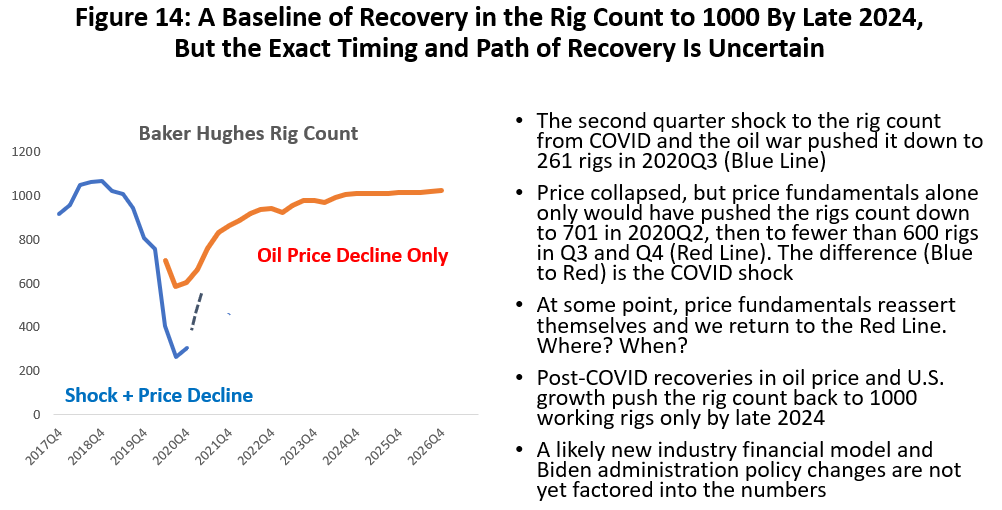
Where is the rig count headed from here? The purpose of this report is (1) to ask if a new industry financial model will drive changes in oil-field activity and the rig count, and (2) what these changes would mean for Houston. To serve as a baseline for change, and before worrying about fracking’s financial issues, what would we expect from the coming COVID recovery? Figure 4 outlines the problem.
- The blue line in Figure 4 is the actual data showing the COVID collapse in the rig count and the modest recovery through 2020Q4.
- The red line asks the following question: What if 2020 had seen only a moderate economic downturn in the U.S. and Houston economies accompanied by a sudden fall in oil prices to $27 per barrel in 2020Q2 followed by stabilization near $40 for the rest of the year? This would be a situation that Houston and the oil industry have met several times before and this history is indicated by the red line.10
- The red line assumes there is no long-term structural break with the past forced by the pandemic, that oil demand returns normally as the virus is put behind us, and the fracking industry is left capable of operating at pre-COVID levels.11
- The difference between the blue and red line is the COVID-specific shock generated by the pandemic: a sudden negative demand response due to unanticipated lockdowns, an emergency shutdown of oil production as storage filled, and a surge in foreign oil supplies oil driven by the Saudi-Russian oil war. Once the vaccine is in place the COVID shock should slowly disappear. We move from the blue line to the red line representing the future growth path. If the vaccine is as effective as expected, and its delivery remains on the anticipated timetable, normal economic conditions should begin to fall into place by the third and fourth quarter of this year.
- The broken line is the path from blue to red, but we cannot know this path without also knowing the course of the virus and the public health response to it. We can only guess that by the second half of 2021 how the vaccine will have cleared a way for an on-going return to normality.
- Figure 14 shows a long road back for the fracking industry under the best circumstances. With the virus conquered and no concerns about fracking finances, U.S. and Houston employment begin to recover rapidly by mid-2021, oil prices slowly return to $60 per barrel in 2022, and the rig count moves to 2018 pre-COVID highs near 1000 working rigs — but only by mid-2024.
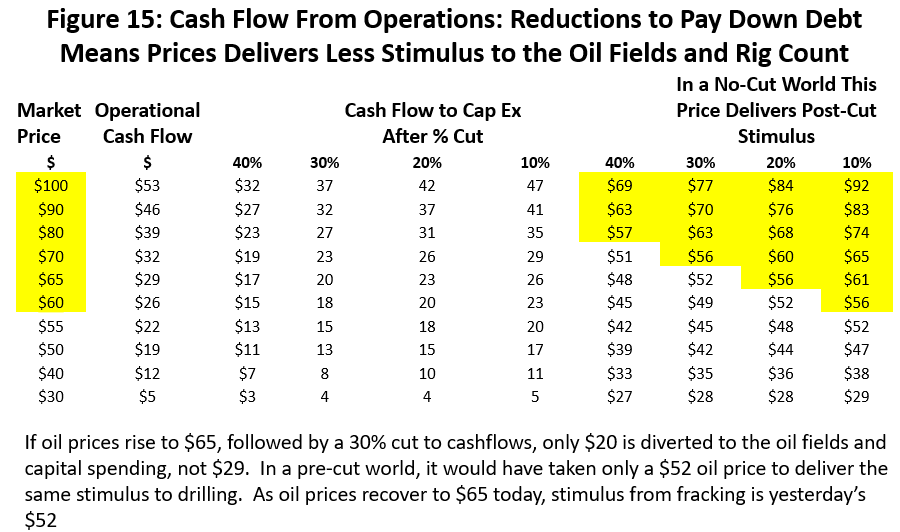
Looking forward and into the post-2021 world after COVID-19 is put to rest, we assume that economic recovery and rising oil prices allow the fracking industry to widely implement cuts to cash flows and capital spending to reward potential investors. Using the calculation of cash flows from Figure 5 and the total cuts targeted in Figure 11, what is the effect on the rig count and Houston’s upstream employment?12
First there is substantial downward pressure on oil-field activity associated with these cuts. If oil prices were to return to a medium-run price of $65, for example, a 30% cut in producer cashflows that meanly $20 is left for capital spending. Without those cuts, and in a 2018-2019 world, cash flows of $20 would have been associated with an oil price of $52.13 In other words, a $65 post-COVID recovery now generates what we would have associated with $52 oil prices and recovery in the past. See Figure 15.
Assuming a slow recovery in oil price to $65 per barrel as in Figure 12, the impact on the rig count is shown in Figure 16. The top line is the baseline calculations with no continuing financial concerns and a return to activity near 2018-19 levels at about 1000 working rigs. The lower lines show the reduced activity as producers implement cuts to cash flow ranging from 10 to 40 percent. As a result, the rig count will be lower by 25, 60, 92, and 120 rigs in 2024Q4 and compared to the baseline.
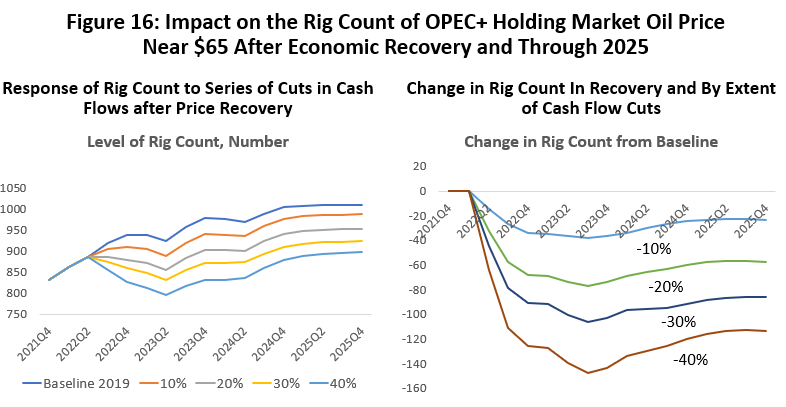
These cuts are not the typical price swing from oil markets that will correct themselves in a few quarters, but semi-permanent cuts made by producers as the industry tries to exhibit multi-year financial commitment after successive financial disasters.
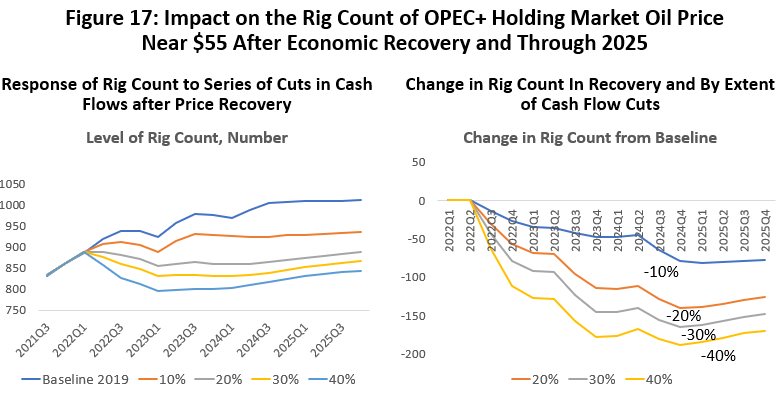
A combination of lower oil prices and the need to reward potential investors can quickly add up. For example, in 2018 OPEC and the Saudis used a $55 price target to strategically slow the growth of the fracking industry and protect their market share. Figure 17 shows the effect of substituting $55 for $65 in our plans for oil recovery over the next few years. Now by the end of 2024, the progressively bigger cuts in cash flows lead to rig count reductions in 2024 of 81, 139, 163, and 184 rigs.
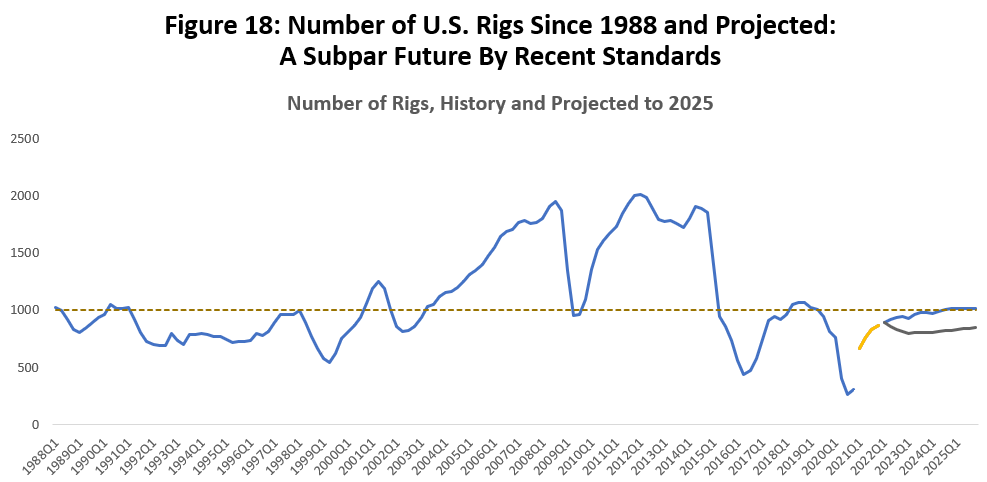
To gain perspective on these lower levels of activity, Figure 18 shows the Baker Hughes rig count since 1988. The projected future rig counts on the far right have the “no-financial-consequences” baseline as the higher level and the worst-case $55 oil and a 40% cashflow cut at the bottom. The rig count varies in 2024 from 800 to 1000 rigs depending on the financial scenario.
Except for specific drilling downturns in the Great Recession, the 2015-16 Fracking Bust, and the current COVID decline, this level of rig activity will be the lowest levels in 20 years. It is one more significant step down from 1,931 rigs working as recently as 2014. A rig from 1988 or 1998 rigs cannot be compared to the power and productivity of their modern equivalent, but even so it is no mistake to compare today’s drilling outlook to the subdued level of the rig count in the 1990s.
Cuts by the fracking industry reach Houston
The same charts are used in Figures 19 and 20 to examine the consequences of industry financial reform and how they reach Houston’s upstream employment. By upstream we mean oil producers, oil services, machinery and fabricated metal. Now $65 oil and cuts in cash flows of 10/20/30/40 percent leads to the local oil jobs reduced from the baseline by 2,000/4,400/6,100/8,700 by 2024Q4. If we apply the additional price pressure of $55 oil prices these levels of employment fall by 4,200/8,200/10,000/12,000.
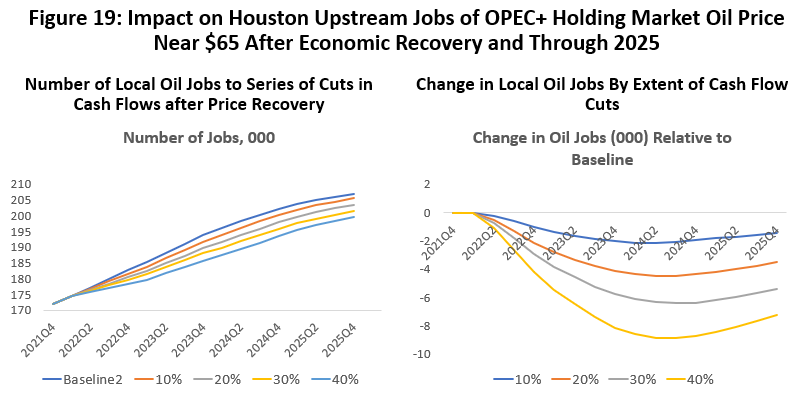
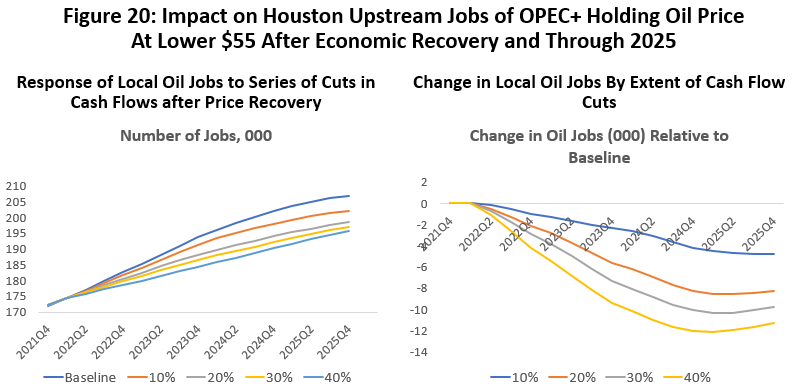
The damage indicated here is to longer-term growth and depends on the extent of financial reform but says less about the recovery of 30,000 oil jobs to pre-COVID levels of activity. This post-COVID recovery is slowed until early 2023 by low oil prices, but once prices return to $55 or $65 per barrel the jobs lost the prior peak in 2019Q3 are restored. The no-cut baseline has them back by 2023Q1 and even the lowest growth scenario of $55 per barrel and 40% cashflow cut has them restored by early 2024.
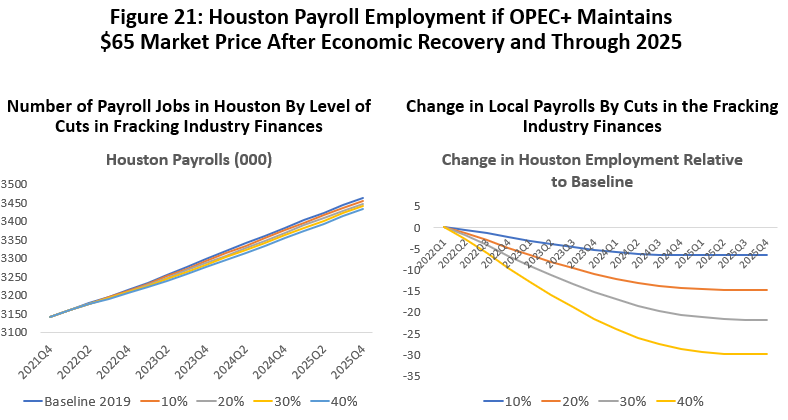
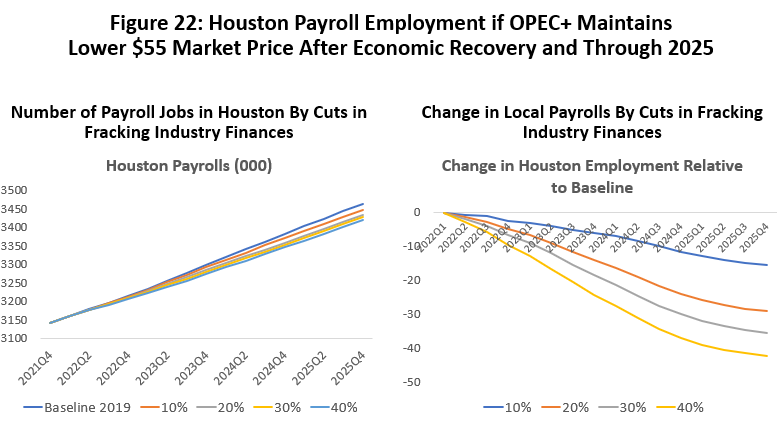
We are primarily measuring effects of financial reform on the fracking industry. This is a because of self-inflicted wounds by the industry, where lost oil jobs are not tied to major recession or global crisis. Using such a narrow scenario, it might seem hard to find any significant impact on the economy of a major metro like Houston with 6.7 million people and 3.2 million workers, but the effect shows up clearly in Figures 21 and 22.
Using the 10/20/30/40 framework for cashflow cuts and $65 oil prices, by 2024Q4 Houston’s payroll employment falls from the baseline by 6,600/14,300/20,600/28,600. At a $55 oil price, the payroll levels fall short of the baseline by 11,600/24,000/30,100/37,000 jobs. This is potentially 5-6 months of growth lost in the three years from 2022 and 2024; job growth in the baseline projection for this period would have been 2.5 percent but falls to 2.1 percent if cash flow cuts were as high as 40 percent.14
The bottom line?
Even if the fracking industry’s financial reforms are successful, the bottom line for Houston is a slower long-term economic outlook. In the introduction to this report, we noted that Houston’s history since 1990 was 2.0 percent payroll job growth and 0.6 percentage points of that growth could be attributed to oil. As the fracking industry is forced into significant financial stringencies and downsizing, it could mean a likely fall in Houston’s long-term growth rate by 0.2 to 0.3 percentage points. Oil remains a contributor to Houston’s growth but adding less than before.
If oil were to somehow disappear tomorrow, the other contributors to Houston’s growth — the U.S. economy, favorable demographics, the Texas Growth Formula — remain healthy, and Houston would outperform the rest of the country 1.4% to 1.1%. Add back the now-smaller contribution form oil, and the comparison to the U.S. is 1.7%-18% to 1.1%.
By measures other than the number of jobs, the damage from oil may be more impactful. Oil is a headquarters and research operation in Houston, providing high-quality executive and technical jobs that pay far above average. Per capita income and retail sales, for example, will be hit harder than the numbers above would indicate.
Written by:
Adriana Fernandez
Jesse H. Jones College of Business
Finance Department
Texas Southern University
Robert W. Gilmer
C. T. Bauer College of Business
Institute for Regional Forecasting
University of Houston
March 18, 2021
1 Haynes and Boone, Oil Patch Bankruptcy Monitor and Oilfield Services Bankruptcy Monitor, both dated December 31, 2020.
2 The cash flow calculations used here are borrowed from a Drilldown podcast by John and Richard Spears that simplifies the cashflow calculations to a bare minimum, and we also adopted their dollar per barrel of oil framework. We altered the triple-net calculation they use by having each “haircut” stated as a fraction of the price of oil, and not as a fraction of the cashflow left after the previous haircut. Our per barrel calculation boils down to operating cash flow equal to oil price times 0.675 minus $15. Richard and John Spears, “Thinking About Free Cash Flow,” The Drilldown, #179, October 14, 2020, https://spearsresearch.com/podcast/2020/10/14/thinking-about-free-cash-flow.
3 Clark Williams-Derry, Kathy Hipple, and Tom Sanzillio, “Shale Producers Spill $2.1 Billion in Red ink Last Year,” Institute for Energy Economics and Finance,” March 2020, https://ieefa.org/wp-content/uploads/2020/03/Shale-Producers-Spilled-2.1-Billion-in-Red-Ink-Last-Year_March-2020.pdf. This is a sample of public companies that make up less than half the industry and excludes the large integrated companies (Exxon, Chevron) that have large fracking operations in addition to many other roles in the oil industry.
4 Fracking Fiasco: “The Banks that Fueled the U.S. Oil Bust,” Rainforest Action Network and Oil Change International, September 2020. The data presented in Tables 6, 7 and 8 are from public data on a differing number of fracking companies. Public companies are less than half the industry and results may vary widely at times depending on the sample selected. https://www.ran.org/wp-content/uploads/2020/09/RAN_OCI_Fracking_Fiasco.pdf
5 A good discussion of reserve-based lending and its consequences in the 2015-16 downturn can be found in Amir Azar, “Reserve-Based Lending and the Outlook for Oil and Gas Finance,” Center for Energy Policy, Columbia University, May 2017.
6 Rystadt Energy, “U.S. Shale Is Not Going Bankrupt,” Press Release, September 25, 2019 reads “One should be very careful about extrapolating on the basis of a few distressed industries.” https://www.rystadenergy.com/newsevents/news/press-releases/us-shale-is-not-going-bankrupt/
7 Clark Williams-Derry, Kathy Hipple, and Tom Sanzillio, “U.S. Frackers Slash Capital Investment to Lowest Level in Over a Decade,” Institute for Energy Economics and Finance.” December, 2020 http://ieefa.org/wp-content/uploads/2020/12/US-Frackers-Slash-Capital-Investment-to-Lowest-Level-in-Over-a-Decade_December-2020.pdf
8 We used the January Short-Term Energy Outlook from DOE for our oil-price projections. Despite big changes in the futures market in recent weeks, the DOE forecast changed little from its latest February outlook. WTI prices averaged $49.75 and $50 in 2021 and 2022 in the January outlook, and $50.25 and $51.56 in the February report. However, our longer-term outlook after 2022 is more aggressive than DOE as it rises to $60 in 2023 and $65 each year after that. DOE’s January long-term forecast is $55 in 2023, $58 in 2024, $61.12 in 2025, and $64.10 in 2026.
9 Early in the COVID crisis it was speculated that a large backlog of drilled-but-uncompleted wells would slow recovery in the rig count. It was thought capital would be diverted first to uncompleted wells, then later focused on drilling. This has not turned out to be the case, however.
10 The idea that 2020 saw only a moderate U.S. recession has been discussed at length in earlier reports. It is based on the idea that there were two shocks last April, the virus shock to employment from lockdowns, reactive social distancing by the public, and public health mandates. This was accompanied by a large positive shock from the $2 trillion fiscal stimulus in early 2020. It has been easy to focus only on the job loss and overlook the stimulus that does not count in GDP (it is not current production) nor in determining whether a recession is underway. But the stimulus has kept personal income above pre-COVID levels throughout 2020, generated substantial savings by consumers, and kept retail spending at high levels. R.W. Gilmer, “Houston and “COVID-19: Are We Nearing the End-Game?” Institute for Regional Forecasting, October 2020, https://www.bauer.uh.edu/centers/irf/docs/Symposium-Presentation-October-26-2020-via-Zoom-Slides.pdf
11 The red line uses the actual oil prices in 2020 and applies a dynamic forecast to estimate the future rig count. The forecast is based on an autoregressive distributed lag model with appropriate statistical properties and a good statistical fit. It has been robust in the face of many large changes in past oil and natural gas prices. The basic calculations in the report for the rig count, local oil employment, and Houston payroll employment can be provided in summary by Adriana Fernandez at Adriana.fernandez@tsu.edu.
12 This analysis is like a December 2, 2020 blog post for the University of Houston Energy Fellows, R.W. Gilmer, Oil Producers and Value Vs. Growth: What It Means in The Oil Fields, https://www.forbes.com/sites/uhenergy/2020/12/01/oil-producers-and-value-vs-growth-what-it-means-in-the-oil-fields/?sh=1fd8c43c33b8
13 Operating cash flows = Oil price *.675 - $15 or C = P*.675 - $15. The oil prices on the right are the prices in a 2019 or pre-cut to cash flow world that would deliver equivalent post-cut cash flows. In other words, if C’ is the 2021 post-cut cash flow, the 2019 price would have been P = (C’ +15)/.675.
14 Houston’s long-run growth rate is about 2.0 percent, but local growth is higher in this period because in includes the recovery from the COVID downturn. The faster growth here is primarily driven by oil, with recovery of the U.S. economy largely complete by early 2022. While oil recovery is slowed by the fracking cashflow cuts, it still has a substantial rebound from COVID levels in 2022-23. Oil prices do not rise much past $50 in our outlook until 2022.